HAL Id: hal-01686750
https://hal.archives-ouvertes.fr/hal-01686750
Submitted on 17 Jan 2018
HAL is a multi-disciplinary open access
archive for the deposit and dissemination of
sci-entific research documents, whether they are
pub-lished or not. The documents may come from
teaching and research institutions in France or
abroad, or from public or private research centers.
L’archive ouverte pluridisciplinaire HAL, est
destinée au dépôt et à la diffusion de documents
scientifiques de niveau recherche, publiés ou non,
émanant des établissements d’enseignement et de
recherche français ou étrangers, des laboratoires
publics ou privés.
Modeling and Simulation of Baggage Handling System
in A Large Airport
Dina Hafilah, Andi Radja, Naly Rakoto-Ravalontsalama, Younsse Lafdail
To cite this version:
Dina Hafilah, Andi Radja, Naly Rakoto-Ravalontsalama, Younsse Lafdail. Modeling and Simulation
of Baggage Handling System in A Large Airport. The 18th Asia Pacific Industrial Engineering and
Management System Conference (APIEMS 2017), APIEMS, Dec 2017, Yogyakarta, Indonesia.
�hal-01686750�
Proceedings of the Asia Pacific Industrial Engineering & Management Systems Conference 2017
Modeling and Simulation of Baggage Handling System
in A Large Airport
Dina Lavender Hafilah
Industrial Engineering Study Program Bandung Institute of Technology, Bandung, Indonesia Tel: (+62) 81298973582, Email: [email protected]
Andi Cakravastia Radja
Faculty of Industrial Engineering
Bandung Institute of Technology, Bandung, Indonesia Tel: (+62) 2506189, Email: [email protected]
Naly Rakoto
Department of Control, Industrial Engineering and Computer Science (DAPI) IMT-Atlantique, Nantes, France
Tel: (+33) 251858306, Email: [email protected]
Younsse Lafdail
Air France, Roissy CDG, France
Tel: (+33) 174379363, Email: [email protected]
Abstract. Baggage Handling System (BHS) is a complex system because many factors are involved such as
quantity of the bags, interval of arrivals, barcode misreads, early bags and late bags, traveling time and security check. The main role of BHS is to sort and transport all transfer and check-in bags to each destination based on the time window. The airport which has the authority to handle BHS should ensure there is no failed bag in the system. Failed bag means it does not arrive in time for the assigned flight. Petri net was introduced for illustrating relations between conditions or situations and events. Petri net is a powerful tool for modeling because behavior comprising concurrency, synchronization and resource sharing can be modeled and visualized. Colored Petri Net (CPN) is a special type of Petri net which is enriched by color set to define discrete data types and set of expressions for the initial marking, guards and arc inscriptions. It has been used for modeling various systems such as manufacturing, robotic, transportation, etc. This paper will do a part of large airport’s BHS modeling and simulation which deals with more than 20,000 bags per day using CPN.
Keywords: baggage handling system, colored petri net, simulation, modeling.
1. INTRODUCTION
Airport is a place where many activities are involved. Baggage handling system (BHS) is one of crucial activities in airport because it can affect other operations such as flight schedule. The main roles of BHS are to sort and transport all transfer/transit and local/check-in bags to the destination based on the time window. The quantity of bags entering the system, interval of bags’ arrival time, early bags, late bags, capacity of the system, barcode misread and security check procedure are attributes that make BHS complex.
Simulation model is a mathematical model which is solved by imitating the actual system. Generally,
simulation is used to model a complex system that is difficult to solve by analytic model. Discrete event simulation (DES) concerns the modeling of a system as it evolves over time by a representation in which the state variables change instantaneously at separate points in time. These points in time are the ones at which an event occurs, where an event is defined as an instantaneous occurrence that may change the state of the system (Law & Kelton, 1991). Modeling and simulation are the way to try some scenarios before implementing it since doing experiments in the real system is costly.
One of the tools for simulation is Petri net. It was introduced for illustrating relations between conditions or
situations and events. Petri nets (PNs) present two interesting characteristics. Firstly, they make it possible to model and visualize behaviors comprising concurrency, synchronization and resource sharing. Secondly the theoretical results concerning them are plentiful (David & Alla, 1994). As a graphical tool, Petri nets provide a powerful communication medium between the user, like engineer and the customer. Complex requirements specifications, instead of using ambiguous textual descriptions or mathematical notation difficult to understand by the customer, can be represented graphically using Petri nets. As a mathematical tool, a Petri net model can be described by a set of linear algebraic equation, or other mathematical models reflecting the behavior of the system (Wang, 1998). Colored Petri Net (CPN) is a special type of Petri net which is enriched by color set to define discrete data types and set of expressions for the initial marking, guards and arc inscriptions (Jensen & Kristensen, 2009). CPN has been used to describe many different systems such as protocols and networks, transportation, manufacturing, robotic, biology etc.
In BHS, there are many bags and every bag is unique. In the real system, barcode is used to keep the unique information on each bag. This information is interpreted by color set as attributes for each bag in CPN such as time entering the system and departing time of the flight. These attributes also help for sorting the bags whether they must go to manual scanning, storage, or directly to destination gate. Sorting is performed by the guard in transition. This is the reason why using CPN is an appropriate choice to model BHS.
2. PROBLEM FORMULATION & RELATED
WORK
Today, airplanes are the fastest public transportation. The number of passengers continues to increase each year. Airport who has authority to exploit the baggage handling system and has to propose a logistical scheme allocation for each bag in order to optimize the sorting and to minimize the number of failed bags. By failed bag, it means a bag that does not arrive in time for assigned flight.
A large airport in Europe is facing a problem with failed bags. It caused additional cost for their operation. One of the reasons of this situation is the high percentage of barcode misread so that many bags must be processed in manual scanning. The process in manual scanning takes time and in the peak hours it causes long queue. Some queue policies in manual scanning is proposed.
The second reason is the high number of bags which come late or have minimum remaining time to go to the aircraft in their daily system. The remaining time is an important attribute for each bag. The existing system used the remaining time of the bags to decide whether the bags
go to destination gate or storage. The other factor that also can influence the system is the interval of arrival.
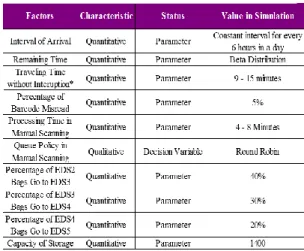
According to the causes of the problem, the queue policy in manual scanning will be decision variable and the percentage of failed bags is the key performance indicator (KPI). The percentage of barcode misread, the remaining time and the interval of arrival are the important variables that will be used in the simulation.
There are many researches trying to solve the problem in Baggage Handling System. Problem, method, key performance indicator, decision variable, and noise are five characteristics to identify the baggage handling system. The problem is divided to routing and non-routing problem. The problem can be routing problem e.g. (Cavada et al., 2017), (Johnstone et al., 2010), (Tarau et al., 2009), (Tarau et al., 2011), and (Zeinaly et al., 2012) or non-routing problem e.g. (BNP Associates Inc., 2011), (Baros and Tomber, 2007), (Johnstone et al., 2015), (Le et al., 2007), (Robinson , 1969), and (Wu and Xie, 2017). The researches with routing problem tried to optimize the route in baggage handling system. The non-routing problem focused on a part of baggage handling system. This research is in the non-routing problem because it focuses on the process in manual scanning but also considers the other process such as the arrival, security check, and also the storage.
Generally, the methods to solve problem in baggage handling system are analytical model or mathematical model and algorithm or scenario. The mathematical model is solved by mathematical optimization such as linear programming i.e. (Tarau et al., 2011) and software for linear programming is used to solve it i.e. CPLEX. Some heuristic and metaheuristic are proposed in the research which deal with algorithm i.e. (Johnstone et al., 2010). The scenario is the policy or the strategy that is proposed by the stakeholder, decision maker or the engineer e.g. (Cavada et al., 2017) and (Wu and Xie, 2017). For algorithm and scenario, simulation is the way to know the performance of proposed algorithms or scenarios. Arena (Baros and Tomber, 2007) and Matlab (Tarau et al., 2009) are the example of the software.
The Key Performance Indicator (KPI) could be time, output or cost of the system. Time as KPI could be the baggage travel time, delay or the waiting time e.g. (Baros and Tomber, 2007), (Cavada et al., 2017), (Le et al., 2007), (Robinson, 1969), and (Wu and Xie, 2017). For the output, throughput i.e. (Johnstone et al., 2015) and failed bags/mishandled bags i.e. (Baros and Tomber, 2007) are the common KPI. Cost is the other KPI for evaluating the BHS e.g. (BNP Associates Inc., 2011), (Tarau et al., 2009) and (Zeinaly et al., 2012). The KPI for this research is the percentage of failed bags which is the output of the system. The interval of arrival, remaining time and the barcode misread are the involved noises to test the performance of
the decision variable.
The scientific contribution in this research in on the decision variable. Policy, number of resources, processing time, and input condition are variables that used as decision variable in many researches. This research will focus on the policy in the queue. Policy in diverter and merger is usually the decision variable in routing problem. Queue in the check-in counter and security check have been discussed but there is no research for queue in manual scanning. For policy as decision variable, there are (Johnstone et al., 2010) who focused on diverter, (Johnstone et al., 2015) who discussed the merge analysis, and (Baros and Tomber, 2007) who considered the queue in check-in and (Wu and Xie, 2017) who optimized queue in security check or screening.
Noise is the variable or factor that can influence the KPI or/and the decision variable but can’t be controlled by the decision maker. There are input condition, barcode misread and security check failure.
The simulation model will be designed by using Colored Petri Net (CPN). There are many research building simulation model by Petri Nets in the airport, i.e. (Vidosavljevic and Tosic, 2010). But not many of them modeled the real Baggage Handling System. (Ehrig and Padberg, 2004) modeled BHS as an example of their theory. Building the simulation model of real airport baggage handling system can also be a contribution of this research since not many researches dealt with that.
3. MODEL AND SIMULATION
Petri Net was introduced for illustrating relations between conditions and events. The conditions are represented by the places and the events are represented by the transitions. There are 66 places and 60 transitions in the model. The model is built in CPN tools.
• Arrivals
In the actual system, the arrivals could be from the check-in counter (local bags) or transit bags. The function “iat2()” is used to define the time for arrival of the next bag. The counter is useful in verification and validation. “tm()” is the function of the current time in the simulation. In the simulation, the unit of time is second. So, the transition “Bags comes2” cannot enable anymore
in time 43200 because of the guard.
• Barcode Scanning Check
The aim of this process is to sort the bags based on the success of barcode scanning. “sc” is the guard of the transitions. 0 for the failed and 1 for the success one. For going to “MS” or manual scanning, it takes 180 seconds or 3 minutes. The function “timetrav()” is the random number between 1 and 3 minutes to go to the next place.
• Queue in Manual Scanning
The existing queue policy in actual system is Round Robin. There are 8 positions to do the manual scanning and each position has its own queue. The guard is “ct” variable which is used to define the queue for each bag. The function in transition “End MS” will change the attribute “sc” of the bag become 1 so that the bag can go to the next step.
• Stock
The bag which has more than three hours of remaining time must go to storage. The storage can keep 1400 bags. If it is more than 1400, the bags have to wait in the queue.
Figure 1: Arrivals
Figure 2: Barcode checking
In the storage, there are transition “add time” and “update2” for adding time in the system as the attribute of the bags and for updating the remaining time of the bags so that when it is less than three hours, the bag can go out of the storage.
• Explosive Detection System (EDS)
Security check in the baggage handling system use EDS. There are some levels in the EDS. The picture of EDS2 is presented in Figure 5.
After checking by the machine, the bag will go to the next level of security check or to final sorter. It is based on the attribute “sf”.
• Final Sorter
The function of final sorter in the actual system is to sort the bags based on their destination, but in the model the destination gate is ignored. At the end of simulation, the number of tokens in place “OK” and “notOK” will be used to calculated the KPI, the percentage of failed bags. The guard use attribute “rt” (remaining time) to decide whether the bag go to “OK” or “notOK”. The transition “update3” has high priority so that before the
sorting, the attribute “rt” will be updated.
After doing verification by checking the syntax and the behavior of the model, the next step is doing the simulation. The variables in the simulation are shown in Table 1.
The simulation result is tested with t-test for validation. The test said that the model is valid for representing the actual system of the baggage handling system. The processing time for simulating the system for one day took around 20 seconds. So, the performance of the model is good.
4. EXPERIMENTAL DESIGN
After obtaining a valid model, the next step is developing the scenarios. The scenarios mean the proposal of the improvements and the events that could happen in the system.
Four variables or factors will be involved in developing the scenarios. The proposal of the improvement is on the controllable variable, it is the queue policy in manual scanning. The uncontrollable variables will be represented the event that might happen but have impact to the proposal of improvement. There are three uncontrollable variables, they are remaining time, interval of arrival and the percentage of barcode misread.
Figure 4: Stock
Figure 5: Explosive detection system
Figure 6: Final Sorter
The existing queue policy is round robin (RR), see Figure 7. The proposed policies are First Available (FA) in Figure 8 and Priority with First Available (P-FA) in Figure 9. FA will lead the entity to the first available resource. P-FA will have two queues, one queue for the priority entity (with remaining time ≥10 minutes and ≤ 1.5 hours) and one for the rest. Once the resources free, they will take the entity from the priority but if the priority queue is empty they will take the other queue.
0, -1, and +1 is level of each variable or factor. 0 is level for the existing condition. -1 and +1 are level for developing the scenarios. The level of remaining time will be decreased and increased 15 minutes from the existing data. The number of late bags will increase when the remaining time is decreased. But when the remaining time is increased, the problem might occur in queue in storage not in manual scanning so that the effectiveness of changing the policy in manual scanning can be seen. The interval of arrival and percentage of barcode misread are
getting worse to see whether the proposed policy can handle it. The interval of arrival decreases 1 second and 2 seconds from the existing one in level -1 and +1.
The design of experiment (DOE) is used to guide how to run the simulation efficiently and effectively. The combination of four factors to simulate the event that might happen in the system. The full factorial design is chosen because the effect is shown clearly. Based on theory of full factorial design, the number of simulation needed are 34 = 81, it means there are 81 different scenarios. Each simulation will be run for five replications. So, the total number of simulations is 405.
In Figure 10, p-value for all factors is less than 0.05. It means that queue policy, remaining time, interval of arrival, Figure 7: Round robin policy
Figure 8: First available policy
Figure 9: Priority-first available policy
Table 2: Scenarios
Figure 10: Anova of experiment results
Figure 11: Effect of each factor to the KPI
and percentage of barcode misread have some effects to the KPI, percentage of failed bags. The interaction among all factors exist except the queue policy with remaining time and remaining time with interval of arrival. In Figure 11, the effect can be seen. The most influential factor is the percentage of barcode misread. The queue policy in manual scanning have an effect to the KPI but the effect is the smallest one.
In Figure 11, the effect of each factor can be seen but the effect of queue policy is not significant. It is because the effect of the other factors is much bigger than the queue policy. The effect of queue policy is quite significant, see Figure 12. Indeed, the reduction of the percentage is small but the difference from RR and FA to P-FA can be seen clearly. P-FA policy can provide better solution and FA is the worst one.
5. CONCLUSION AND FUTURE WORK
The advantages of developing the system with colored Petri net are for the engineer, it is easy to develop, check, and analyze and for the customer, it is easy to understand because it has graphics. It is quite hard to make the simulation has the same behavior with the actual system because baggage handling system is complex. The high complexity occurs because there are many factors involved, high amount of entities and the involvement of uncertainty.Three queue policies are compared, RR (round robin), FA (first available), and P-FA (priority with first available). The existing queue policy is RR. Based on the simulation result, the best queue policy in manual scanning is P-FA (priority with first available). Statistically, P-FA policy in manual scanning can reduce the percentage of failed bags from 2.42% to 1.76%. This value is a big amount when converting to the saving.
Baggage handling system is interesting subject for many researchers until now. This research can be developed with many alternatives. One of them is considering the capacity of the system. Expanding the scope of the model also an interesting research since there were many bags coming in the system without remaining time and also the possibility of success bags become failed bags at the end exists because of the transportation from the gate to the aircraft.
REFERENCES
Baros, A., & Tomber, D. (2007). Quantitative Analysis of Passenger and Baggage Security Screening at Airports. Journal of Advanced Transportation
Vol.41 No.2, 171-193.
BNP Associates Inc. . (2011). San Francisco International
Airport Terminal 3 Boarding Area F in Line EDS Optimization. San Francisco: San Francisco
Airport.
Cavada, J., Cortes, C., & Rey, P. (2017). A Simulation Approach to Modelling Baggage Handling System at an International Airport. Simulation Modelling
Practice and Theory, 146-164.
David, R., & Alla, H. (1994). Petri Nets for Modeling of Dynamic Systems - A Survey. Automatica Vol.30
no.2, 175-202.
Jensen, K., & Kristensen, L. (2009). Coloured Petri Nets. Springer Science & Business Media.
Johnstone, M., Creighton, D., & Nahavandi, S. (2010, March). Status-based Routing in Baggage Handling Systems: Searching Verses Learning.
IEEE Transaction on Systems, Man, and Cybernetics - Part C : Application and Reviews,
pp. 189-200.
Johnstone, M., Creighton, D., & Nahavandi, S. (2015). Simulation-based Baggage Handling System Merge Analysis. Simulation Modelling Practice
and Theory, 45-59.
Law, A., & Kelton, W. (1991). Simulation Modeling &
Analysis. Singapore: McGraw-Hill Inc. .
Le, V., Creighton, D., & Nahavandi, P. (2007). Simulation-based Input Loading Condition Optimization of Airport Baggage Handling Systems. Proceedings
of the 2007 IEEE Intelligent Transportation Systems Conference (pp. 574-579). Seattle: IEEE.
Robinson , G. (1969). Simulation Models for Evaluation of Airport Baggage Handling Systems. Proceedings
of the third conference on Applications of simulation, (pp. 226-235). Los Angeles.
Tarau, A., Schutter, B., & Hellendoorn, J. (2009). Decentralized Route Choice Control of Automated Baggage Handling Systems. Proceedings of the
12th IFAC Symposium on Transportation Systems
(pp. 70-75). California: IFAC.
Tarau, A., Schutter, B., & Hellendorn, J. (2011). Predictive Route Control for Automated Baggage Handling Systems Using Mixed-Integer Linear Programming. Transportation Research Part C, 424-439.
Wang, J. (1998). Timed Petri Nets. Miami: Kluwer Academic Publishers.
Wu, X., & Xie, L. (2017). On Load Balancing Strategies for Baggage Screening at Airports. Journal of Air
Transport Management, 82-89.
Zeinaly, Y., De Schutter, B., & Hellendoorn, H. (2012). A Model Predictive Control Approach for the Line Balancing in Baggage Handling System. 13th
IFAC Symposium on Control in Transportation Systems (pp. 215-220). Sofia: IFAC.