HAL Id: hal-00836838
https://hal.inria.fr/hal-00836838
Submitted on 21 Jun 2013
HAL is a multi-disciplinary open access
archive for the deposit and dissemination of
sci-entific research documents, whether they are
pub-lished or not. The documents may come from
teaching and research institutions in France or
abroad, or from public or private research centers.
L’archive ouverte pluridisciplinaire HAL, est
destinée au dépôt et à la diffusion de documents
scientifiques de niveau recherche, publiés ou non,
émanant des établissements d’enseignement et de
recherche français ou étrangers, des laboratoires
publics ou privés.
Articulatory copy synthesis from cine X-ray films
Yves Laprie, Matthieu Loosvelt, Shinji Maeda, Rudolph Sock, Fabrice Hirsch
To cite this version:
Yves Laprie, Matthieu Loosvelt, Shinji Maeda, Rudolph Sock, Fabrice Hirsch. Articulatory copy
synthesis from cine X-ray films. InterSpeech - 14th Annual Conference of the International Speech
Communication Association - 2013, Aug 2013, Lyon, France. �hal-00836838�
Articulatory copy synthesis from cine X-ray films
Yves Laprie
1, Matthieu Loosvelt
2, Shinji Maeda
2, Rudolph Sock
3, Fabrice Hirsch
4 1LORIA/CNRS, Nancy, France
2
LPP, Paris, France
3IPS, Strasbourg, France
4Praxiling, Montpellier, France
[email protected], [email protected], [email protected] [email protected], [email protected]
Abstract
This paper deals with articulatory copy synthesis from X-ray films. The underlying articulatory synthesizer uses an aerody-namic and an acoustic simulation using target area functions, F0 and transition patterns from one area function to the next as input data. The articulators, tongue in particular, have been de-lineated by hand or semi-automatically from the X-ray films. A specific attention has been paid on the determination of the cen-terline of the vocal tract from the image and on the coordination between glottal area and vocal tract constrictions since both as-pects strongly impact on the acoustics. Experiments show that good quality speech can be resynthesized even if the interval be-tween two images is 40 ms. The same approach could be easily applied to cine MRI data.
Index Terms: speech production, articulatory synthesis
1. Introduction
The rapid development of medical imaging technologies (X-ray, X-ray microbeam, MRI, ultrasound, electro-magnetography. . . ) since the second part of the last century made the observation of speech production partially possible. However, there is still no perfect observation technology which would cover the whole vocal tract with a sufficiently high sampling frequency.
Cineradiography was a major breakthrough because it en-ables a sagittal projection image of the vocal tract to be ac-quired at a reasonable sampling rate. This technique has been abandoned for healthy speakers because of the related health hazard. Two main alternatives are exploited today: electro-magnetography (EMA) to get the position of fleshpoints at a sampling rate of 200 Hz or above, and magnetic resonance imaging (MRI) to get the 3D geometry of static articulations [1] or more recently 2D slices of the vocal tract at a slow sampling rate [2].
Despite the emergence of these two techniques, X-ray films available [3] represent a valuable articulatory resource because they offer a good sampling rate, the coverage of the entire vo-cal tract. Moreover, cineradiography does not alter the speech production process because the machine is not very noisy, thus avoiding the Lombard effect, and the subject is sitting during acquisitions.
In parallel of the direct observation of speech production a vast number of works have been dedicated to acoustic cues which enable the perception of phonetic contrasts. The acoustic theory of speech production, and particularly nomograms cal-culated by Fant [4] for a concatenation of four uniforms tubes approximating the vocal tract shape, enabled the formants to
be related to their articulatory origin. More elaborated acous-tic simulations tools enable geometry of the vocal tract to be used to calculate the transfer function of the vocal tract and the speech signal corresponding to a time varying vocal tract [5, 6]. By linking the articulatory and acoustic domains articu-latory synthesis represents a valuable tool which enables the acoustic impact of articulatory gestures to be evaluated. How-ever, articulatory synthesis should rest on realistic vocal tract shapes. One solution often used consists of using static MRI images and interpolating vocal tract shapes from these static images. The advantage of films, here X-ray films, is to provide dynamic data close to real speech. This work is dedicated to ar-ticulatory copy synthesis and aims at generating speech signals from X-ray films.
2. Acoustic simulation and control of the
articulatory synthesis
We used the articulatory synthesizer proposed by Maeda [5, 7]. The direct calculation of the acoustic signal from the knowledge of the subglottal pressure and the 3D geometry of the vocal tract would require intensive calculations without guarantying the relevancy of the results. Maeda thus chose to associate an aerodynamic simulation to compute the airflow Udcin the
vo-cal tract and an acoustic simulation [7] approximating the sound propagation in the vocal tract as a plane wave to compute the synthetic signal. The input data is a sequence of key area func-tions together with their time stamp, F0 value and interpolation scheme from the previous area function. Area functions can de-rive from real data or can be created artificially to approximate known articulatory properties.
The vocal tract synthesizer generates sounds by modulating a periodic source signal located at the glottis or a noise located either at the glottis (aspiration) or at the main constriction of the vocal tract (frication). The airflow provided by the aerodynamic simulation is used to determine the noise amplitude which is proportional to Udc2/A where A denotes the cross-sectional area
of the strongest constriction between the glottis and the lips. The acoustical simulation solves one-dimensional wave equa-tions describing the propagation of the sound through the vo-cal tract given by a concatenation of short uniform tubes. The cross-sectional of each tube corresponds to the cross-sectional area of the vocal tract at the same position from the glottis.
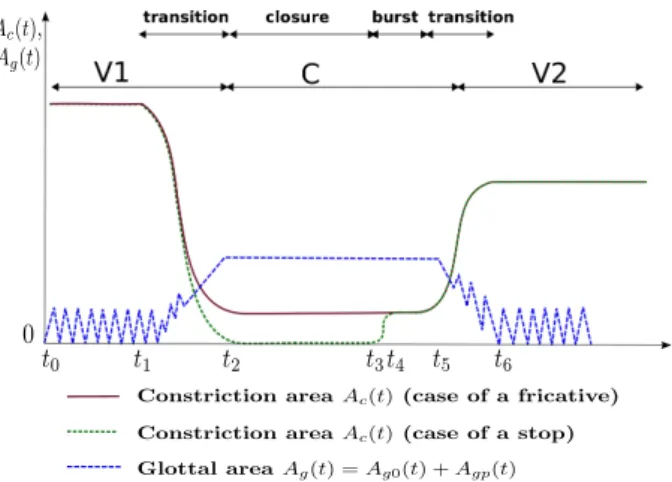
The glottal area is the sum of a slow time-varying compo-nent Ag0(t) and a fast time-varying component Agp(t)
corre-sponding to the vibration of vocal folds. For sake of simplicity the vibration of vocal folds is not simulated but directly given by
V2 V1 transition C transition closure burst
Figure 1: Coordination of supraglottal constriction and glottal area. The blue dotted line shows the schematic glottis area, the solid brown line indicates the constriction when producing a fricative and the dotted green line indicates the constriction when producing a stop.
the glottal area. The coordination between the vocal tract area and the source strongly impacts on the signal generated. During the production of vowels Ag0is set to zero, at least for normal
voices, and the glottis area is only given by the fast varying pe-riodic component Agp. When producing a stop or a fricative the
main constriction of the vocal tract should dominate that located at glottis and Ag0thus increases to a value larger than the
con-striction area. Too small a glottis area gives rise to an aspiration noise which excites the whole vocal tract. Fig. 1 shows this co-ordination scheme. The difference between fricatives and stops is the value of the constriction area which equals zero during the stop closure, jumps to a small value to realize the release burst and then produces the frication noise when approaching the target value of the vowel.
3. Description of data
The input data comprise X-ray images, i.e. one every 40 ms, and the original acoustic signal. The phonetic annotation of the acoustic signal gives the boundaries of sounds and bursts in the case of stops. In addition, F0 has been calculated and is used to control F0 in the synthesis.
Contours of articulators were extracted semi-automatically or by hand. Drawing contours by hand is a tedious task and several works have been dedicated to automatic tracking of ar-ticulator contours [8, 9, 10]. We developed a software package, called “Xarticulators”, which enables several tracking tools to be used according to the nature of articulators.
Rigid structures, like the mandible, can be extracted ro-bustly by correlating a reference image with images to process. In this particular case the image energy of the mandible is suf-ficiently stronger than that of the tongue to neglect its influ-ence. Moreover, the region to be correlated can be chosen so as to minimize the effect of the tongue. This simple extraction turned out to be very efficient for the mandible, the upper part of the skull to compensate for head movements and even the hy-oid bone provided that it does not move too high and intersect with other high photometric organs. The extraction provides the displacement parameters, i.e. rotation and translation of the template.
Structure deforming along time and giving rise to a
suffi-ciently salient contour, i.e. lips, larynx and epiglottis, have been tracked via the algorithm proposed by Berthommier and Fonte-cave [10]. Contours have been drawn by hand for a series of key images (approximately 10% of the total number of images to process) and approximated by B-spline curves with a con-stant number of control points. The general idea is to choose a region (not necessarily rectangle) in the image including the object to be tracked. Then, images are cut out to keep only this region in order to remove the influence of other organs. Non key images are indexed by calculating the distance of their DCT coefficients (Discrete Cosine Transform) to those of the key im-ages. For each image, the three closest key images are kept with their distance to the image analyzed. Finally, the new contour given by the control points of the spline is the weighted average of the contours of the three closest key images. If the visual evaluation of tracking shows that some images are not tracked correctly, because they are too far from key images, they are added as key images.
The tongue contour is much more difficult to track auto-matically since there are one or two contours depending on the tongue shape. The contour to consider is that of the mid-sagittal plane. In many images the tongue presents a marked groove lo-cated at the mid-sagittal plane which gives the relevant contour. The two upper edges of the tongue for some vowels as [i] may give rise to a second image contour (or exceptionally two if the tongue is not left-right symmetric at all). A second difficulty is the presence of teeth in the mouth cavity which hide the tongue contour. Human experts often use a completion strategy consist-ing in drawconsist-ing a convex contour in the mouth probably because this shape is much more natural. However, ultrasound images, and MR images as well, show that the tongue contour can be concave not only for retroflex tongue shapes but also for many other less extreme tongue shapes. A third difficulty stems from the concave shape of the hard palate in the direction of the X-ray beam. Therefore it does not appear as a clear line on images and the choice of a reference contour is not easy. If it is too low it could tend to overestimate the contact region between palate and tongue, or conversely to underestimate it.
Although there are some automatic or semi-automatic tracking algorithms, the difficulties presented above led us to draw tongue contours by hand to guarantee their relevance. The graphical interface of Xarticulators offers many tools to make this work easier.
4. From images to area functions
Since the propagation of the sound is approximated by a pla-nar wave the vocal tract has to be decomposed in small sections consistent with planar wavefronts. This is achieved by finding the centerline of the vocal tract and splitting it into small sec-tions perpendicularly to the centerline.
4.1. Determination of the centerline
One solution is to use the midpoint between interior and ex-terior contours in the coronal and axial directions [11], or in the directions given by an articulatory grid [12]. The points of intersection between the grid lines and the vocal tract contour define a series of segments. The centerline is formed by join-ing the midpoints of these segments. However, the grid lines do not correspond to the propagation of plane waves in the vo-cal tract and some additional smoothing is often applied. The fact that the grid is fixed, and thus not adapted to all sounds, does not guarantee that the centerline is always correct.
Con-sequently, the formant frequencies of the synthetic spectra are often shifted with respect to those of natural speech.
Takemoto et al. [13] proposed an algorithm consisting in propagating the numbering of each pixel of an image of the vo-cal tract from the glottis to the lips, and vo-calculating the line formed by the centroids of all points sharing the same number. The final centerline is then smoothed with a spline curve. This is a more interesting solution because it approximates the propa-gation of an artificial wavefront within the vocal tract. However, this algorithm presents two weaknesses. The first is that the wavefront is somewhat curious after a bend in the vocal tract, for instance at the larynx output. The second is that it separates the smoothing from the initial calculation of the centerline.
The objective was thus to design an algorithm which ap-proximates the centerline more correctly, and the idea is to find an initial line formed by center-points which is then deformed to be get a curve the farthest from the vocal tract wall and suffi-ciently smooth. This compromise between the distance and the smoothness criteria is expressed by the following energy, which has to be minimized:
E(s) =R αs0
(t)2+ βs00(t)2dt
+R (dint(s(t)) + dext(s(t))) × |dint(s(t)) − dext(s(t)|dt
(1) where s(t) represents the centerline, ext the exterior contour of the vocal tract (pharyngeal wall, palate and upper lip), int the interior contour (epiglottis, tongue, mouth-floor and the lower lipt), α the weight of the length curve corresponding to the first derivative of s and β the weight of the curvature corresponding to the second derivative of s. The construction of the centerline thus incorporates, at the same time, the centerline and smooth-ness aspects.
dext(s(t)), resp. dint(s(t)), is the minimal distance from
the point s(t) of the current centerline to the exterior, resp. in-terior, contour. The determination of the minimal distance from each point of the centerline to the vocal tract contours could potentially necessitate each vocal tract contour to be exhaus-tively scanned, and thus make the computation of E(s) very time demanding. However, only points of the vocal tract con-tours in the vicinity of the centerline points can reasonably min-imize the distance. The vocal tract is thus divided into sections according to a grid and the computation of the minimal dis-tance thus amounts to explore sections surrounding the center-line point considered.
The centerline s(t) is discretized and the minimization Eq. 1 is achieved by applying the Euler equation [14] in a way very similar to snake curves [15] and gives rise to an iterative process.
This iterative process needs an initial centerline, which is constructed by propagating a pseudo plane wave-front in the vocal tract. The wave-front is represented by segments linking one point of the exterior contour (the pharyngeal wall, palate and upper lip) to one point of the interior contour (the epiglot-tis, the tongue and the lower lip). The problem amounts to select a set of consistent segments from the larynx to the lips. Consis-tent means that the centerline joining two consecutive segments should be roughly perpendicular to segments.
We used dynamic programming to solve this problem con-sisting of minimizing an overall cost corresponding to the sum of cosine between the centerline and each of the segments rep-resenting the wave-fronts. In addition, the centerline should not be too long and not cross the contours of the vocal tract.
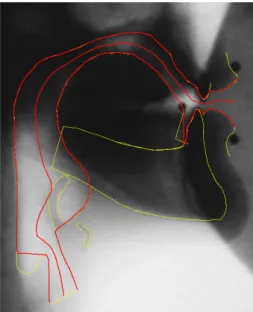
Figure 2: Centerline obtained an X-ray image of a sound /i/. The contours of the articulators are in yellow. The vocal tract contours and the centerline are in red. Since the acoustic im-pact of the epiglottis is negligible it has been discarded from the vocal tract.
4.2. Recovering the cross-sectional area
The next step consists of decomposing the vocal tract into small sections equally spaced on the centerline, and crossing it per-pendicularly. If the centerline presents a large curvature the length of sections can be changed locally to avoid overlap-ping sections. The area is calculated by using the standard transformation A(x) = α(x).d(x)β(x)proposed by Heinz and Stevens [16] where x is the distance from the glottis, d the sagit-tal distance, α and β are two functions controlling the area. The determination of optimal methods to predict the cross-sectional area gave rise to a number of works. The recent work of Mc-Gowan et al. [17] approximates the cross-sectional areas from known MRI data whose global sagittal cross-distance profile is close to that searched. However, the benefit is only marginal all the more so since a set of MRI images of the target speaker is required. Indeed, Ericsdotter [18] showed that the improve-ment of cross-sectional area has a very limited impact on acous-tics compared with the location of the main constriction when resynthesizing spectra from area functions. We thus used stan-dard α and β coefficients proposed by Soquet et al. [19].
5. Piloting synthesis from contours
extracted from X-ray images
All the images of the film are used to pilot the acoustic simula-tion according to the nature of sounds there are corresponding to and by taking into account surrounding sounds. The simple strategy consisting of linearly interpolating area functions from two consecutive images is not possible because the time inter-val separating two images, i.e. 40 ms, is longer than most of the articulatory events, and particularly burst releases. This would remove most of the acoustic cues of speech. We therefore de-signed the following strategy inspired by the concatenation of area functions proposed in [5].
V
F
V
transition transition phonetic segmentation original images images shiftedFigure 3: Choice of key images for a VFV sequence. In the upper line red filled circles represent the X-ray images and in the second line images shifted to realize vowel to fricative or fricative to vowel transitions.
V
V
transition phonetic segmentation original images images shiftedC
burst release transition frication noiseFigure 4: Choice of key images for a VCV sequence. In the upper line red filled circles represent the X-ray images and in the second line images shifted to realize vowel to consonant or consonant to vowel transitions.
If two consecutive images correspond to vowels a linear transition is used to interpolate area function between the two area function derived from images. If there is a vowel to con-sonant or concon-sonant to vowel boundary between two images a cosine transition is used to generate the intermediate area func-tions. In order to respect the phonetic segmentation of the orig-inal speech signal the images are shifted as shown in Fig. 3 and Fig. 4. A slightly more elaborated solution would have con-sisted of constructing these key images by weighting the two area functions surrounding the target date. Due to small errors stemming either from the global synchronization of the X-ray film with the acoustic signal, or from delineation of contours, or also from the duration of the X-ray pulse (2ms) we prefer to keep this simple solution.
The transition strategy depends on the nature of the con-sonant. The interpolation used for stops (Fig. 4) involves two stages unlike for fricatives. The first is very short and corre-sponds to the release burst. The second correcorre-sponds to the frica-tion noise and formant transifrica-tions. It is important to note that each area function is checked in order to guarantee that it is ap-propriate to the mode of articulation of the target sound. This means that there should not be any complete closure except for stops, and conversely that there is a complete closure for stops. If need be the area function is slightly modified.
If two consecutive images correspond to the closure of the same stop, the transition between the two images is linear and corrected if need be to guarantee a complete closure between the two images. Finally, in some rare cases the time interval of 40 ms was too long to get a key image representing the closure and an image sharing the same place of articulation and copied from a similar stop in the film has thus been used in place of the image expected.
Unlike schematic area functions used in [5] area functions used in this work directly derive from real images. Udcused
to govern the noise amplitude depends on the smallest area sec-tion in the vocal tract. Since this secsec-tion jumps from one place of constriction to another in the vocal tract the evolution of Udc
is not anymore derivable, which gives rise to small clicks. This strategy has been changed. Now each section in the vocal tract
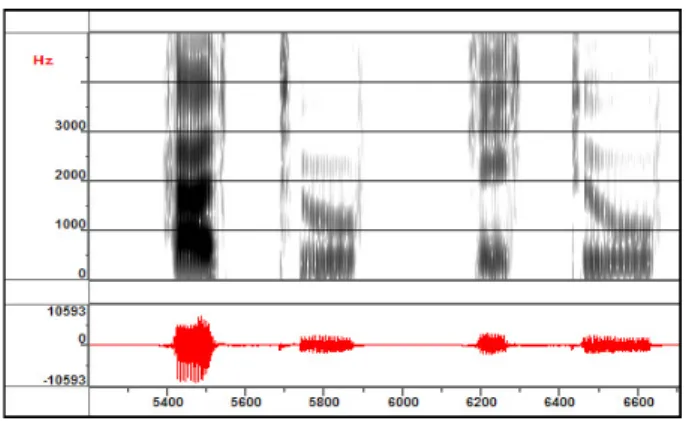
Figure 5: spectrogram of the synthetic /atu/ and /itu/
generates noise, which becomes audible only when the area is sufficiently small. This prevents the generation of spurious clicks.
6. Experiments and concluding remarks
We used two films (25 frames/s) of the DOCVACIM database [3]. The first film comprises six short French sentences of five syllables (proposed by Abry and Lalouache [20] in elab-orating their Movement Expansion Model MEM), uttered by one French male speaker at a normal speaking rate. The second film comprises six VCV nonsense words produced at a normal speaking rate by the same male speaker.
Although the time interval between two consecutive images is 40 ms the quality of speech is good for nonsense words (see Fig. 5) and sentences as well although the sentences contain complex consonant clusters. More examples and original films with contours can be found on http://www.loria.fr/ ˜laprie/ACS/index.htm.
There is also a good agreement between acoustic cues syn-thesized and those generated for consonants. The interpolation strategy used to generate transitions and in particular those be-tween consonants and vowels which are crucial for the percep-tion of consonants turns out to be relevant. It can be seen on Fig. 5 showing two dental stops that the formant transitions and the transient bursts are correctly rendered by copy synthe-sis although the time interval between two images is 40 ms, i.e. substantially longer than the burst in these two examples. Xar-ticulator software provides an interface to directly modify the image, or equivalently the area function, and recalculate the transfer function of the vocal tract. It is thus very simple to investigate the link between articulatory features and acoustic cues.
The first improvement will concern the control of the noise amplitude which is sometimes too low in burst transients and in some fricatives, which weakens some contrasts between modes of articulation. The approach described here can be exploited with other kinds of image of the vocal tract and could be used easily if 3D images of the vocal tract are available.
7. Acknowledgements
This work is part of the ARTIS French ANR and the MISHA Perturbation Programme.
8. References
[1] P. Badin, G. Bailly, L. Rev´eret, M. Baciu, C. Segebarth, and C. Savariaux, “Three-dimensional linear articulatory modeling of tongue, lips and face based on mri and video images,” Journal of Phonetics, vol. 30, no. 3, pp. 533–553, 2002.
[2] S. Narayanan, E. Bresch, P. K. Ghosh, L. Goldstein, A. Kat-samanis, Y. Kim, A. Lammert, M. Proctor, V. Ramanarayanan, and Y. Zhu, “A multimodal real-time mri articulatory corpus for speech research,” in 12th Annual Conference of the International Speech Communication Association - INTERSPEECH 2011, Flo-rence, 2011.
[3] R. Sock, F. Hirsch, Y. Laprie, P. Perrier, B. Vaxelaire, G. Brock, F. Bouarourou, C. Fauth, V. Hecker, L. Ma, J. Busset, and J. Sturm, “DOCVACIM an X-ray database and tools for the study of coarticulation, inversion and evaluation of physical models,” in The Ninth International Seminar on Speech Production - ISSP’11, Canada, Montreal, 2011.
[4] G. Fant, The F-Patterns of compound tube resonators and hors. The Hague: Mouton & Co., 1970.
[5] S. Maeda, “Phoneme as concatenable units: VCV synthesis us-ing a vocal tract synthesizer,” in Sound Patterns of Connected Speech: Description, Models and Explanation, Proceedings of the symposium held at Kiel University, Arbeitsberichte des Insti-tut f¨ur Phonetik und digitale Spachverarbeitung der Universitaet Kiel:31, A. P. S. ans M. P¨otzold, Ed., June 1996, pp. 145–164. [6] P. Birkholz and D. Jackel, “A three-dimensional model of the
vo-cal tract for speech synthesis,” in 15th International Congress of Phonetic Sciences - ICPhS’2003, Barcelona, Spain, Aug 2003, pp. 2597–2600.
[7] S. Maeda, “A digital simulation of the vocal tract system,” Speech Communication, vol. 1, pp. 199–229, 1982.
[8] Y. Laprie and M. Berger, “Towards automatic extraction of tongue contours in x-ray images,” in Proceedings of International Con-ference on Spoken Language Processing 96, vol. 1, Philadelphia (USA), October 1996, pp. 268–271.
[9] G. Thimm and J. Luettin, “Extraction of articulators in x-ray im-age sequences,” in Proc. EUROSPEECH, Budapest, september 1999, pp. 157–160.
[10] J. F. Jallon and F. Berthommier, “A semi-automatic method for extracting vocal-tract movements from x-ray films,” Speech Com-munication, vol. 51, no. 2, pp. 97–115, 2009.
[11] C.-S. Yang and H. Kasuya, “Accurate measurement of vocal tract shapes from magnetic resonance images of child, female and male subjects,” in Proceedings of International Conference on Spoken Language Processing, vol. 2, Yokohama, Japan, September, 1994, pp. 623–626.
[12] P. Mermelstein, “Articulatory model for the study of speech pro-duction,” Journal of the Acoustical Society of America, vol. 53, pp. 1070–1082, 1973.
[13] H. Takemoto, K. Honda, S. Masaki, Y. Shimada, and I. Fujimoto, “Measurement of temporal changes in vocal tract area function from 3d cine-mri data,” Journal of the Acoustical Society of Amer-ica, vol. 119, no. 2, pp. 1037–1049, 2006.
[14] M.-O. Berger, Les contours actifs : Mod´elisation, comportement et convergence. Th`ese de L’Institut National Polytechnique de Lorraine, F´evrier 1991.
[15] M. Kass, A. Witkin, and D. Terzopoulos, “Snakes: Active contour models,” International Journal of Computer Vision, vol. 1, no. 4, pp. 321–331, 1987.
[16] J. M. Heinz and K. N. Stevens, “On the relations between lateral cineradiographs, area functions and acoustic spectra of speech,” in Proceedings of the 5th International Congress on Acoustics, 1965, p. A44.
[17] R. McGowan, M. Jackson, and M. Berger, “Analyses of vocal tract cross-distance to area mapping: an investigation of a set of vowel images,” Journal of the Acoustical Society of America, vol. 131, no. 1, pp. 424–434, 2012.
[18] C. Ericsdotter, “Detail in vowel area functions,” in Proc of the 16thICPhS, Saarbr¨ucken, Germany, 2007, pp. 513–516.
[19] A. Soquet, V. Lecuit, T. Metens, and D. Demolin, “Mid-sagittal cut to area function tranformations: Direct measurements of mid-sagittal distance and area with MRI,” Speech Communication, vol. 36, no. 3-4, pp. 169–180, March 2002.
[20] C. Abry and M. Lallouache, “Audibility and stability of artic-ulatory movements: deciphering two experiments on anticipa-tory rounding in french,” in Proceedings ICPhS, vol. 1, Aix-en-Provence, August 1991, pp. 220–225.