Reference Point Effects in Antisocial Preferences
14
0
0
Texte intégral
(2) CIRANO Le CIRANO est un organisme sans but lucratif constitué en vertu de la Loi des compagnies du Québec. Le financement de son infrastructure et de ses activités de recherche provient des cotisations de ses organisations-membres, d’une subvention d’infrastructure du Ministère du Développement économique et régional et de la Recherche, de même que des subventions et mandats obtenus par ses équipes de recherche. CIRANO is a private non-profit organization incorporated under the Québec Companies Act. Its infrastructure and research activities are funded through fees paid by member organizations, an infrastructure grant from the Ministère du Développement économique et régional et de la Recherche, and grants and research mandates obtained by its research teams. Les partenaires du CIRANO Partenaire majeur Ministère du Développement économique, de l’Innovation et de l’Exportation Partenaires corporatifs Banque de développement du Canada Banque du Canada Banque Laurentienne du Canada Banque Nationale du Canada Banque Royale du Canada Banque Scotia Bell Canada BMO Groupe financier Caisse de dépôt et placement du Québec Fédération des caisses Desjardins du Québec Financière Sun Life, Québec Gaz Métro Hydro-Québec Industrie Canada Investissements PSP Ministère des Finances du Québec Power Corporation du Canada Raymond Chabot Grant Thornton Rio Tinto State Street Global Advisors Transat A.T. Ville de Montréal Partenaires universitaires École Polytechnique de Montréal HEC Montréal McGill University Université Concordia Université de Montréal Université de Sherbrooke Université du Québec Université du Québec à Montréal Université Laval Le CIRANO collabore avec de nombreux centres et chaires de recherche universitaires dont on peut consulter la liste sur son site web. Les cahiers de la série scientifique (CS) visent à rendre accessibles des résultats de recherche effectuée au CIRANO afin de susciter échanges et commentaires. Ces cahiers sont écrits dans le style des publications scientifiques. Les idées et les opinions émises sont sous l’unique responsabilité des auteurs et ne représentent pas nécessairement les positions du CIRANO ou de ses partenaires. This paper presents research carried out at CIRANO and aims at encouraging discussion and comment. The observations and viewpoints expressed are the sole responsibility of the authors. They do not necessarily represent positions of CIRANO or its partners.. ISSN 1198-8177. Partenaire financier.
(3) Reference Point Effects in Antisocial Preferences * Klaus Abbink†, David Masclet‡, Matthijs van Veelen §. Résumé / Abstract Nous étudions les préférences antisociales à l’aide d’un jeu simple de “money burning”. Dans ce jeu, un agent doit choisir s’il souhaite ou pas réduire, moyennant un cout, le gain d’un autre agent. Nous avons fait varier les gains des deux agents. Nos résultats indiquent que les agents n’hésitent pas à « bruler » l’argent des autres, y compris lorsque les écarts de gains sont à l’avantage du décideur, ce qui réfute clairement l’hypothèse d’aversion à l’inégalité. Les cas où les gains du décideur et de la victime sont identiques sont particulièrement sujets à destruction. Nous observons également que les décisions de destructions sont particulièrement sensibles aux effets de framing. Mots clés : expérience, jeu de « money burning », effets de framing, préférences anti-sociales. We study antisocial preferences in simple money-burning tasks. A decision maker can choose whether or not to reduce another person’s payoff at an own cost. We vary across tasks the initial endowment of the decider and the victim. We find that most conventional expectations are refuted: Subjects burn more when inequality is advantageous than when it is disadvantageous. Equitable distributions are particularly prone to destruction. These effects are reversed, however, when the equivalent tasks are framed as creation instead of destruction. Keywords: experiment, money burning, framing effects, preferences antisociales.. *. We wish to thank Elven Priour for programming the experiment. Financial support from the Agence Nationale de Recherche (ANR-08-JCJC-0105-01) through the project “CONFLICT” is gratefully acknowledged. † CREED, Faculty of Economics and Business, University of Amsterdam, Roeterstraat 11, 1018 WB Amsterdam, The Netherlands, [email protected]. ‡ CREM (CNRS – Université de Rennes 1), 7, place Hoche, 35065 Rennes, France, [email protected]. § CREED, Faculty of Economics and Business, University of Amsterdam, Roeterstraat 11, 1018 WB Amsterdam, The Netherlands, [email protected]. HU.
(4) 1. Introduction Reference point effects are well-documented in individuals’ preferences for risky prospects. Ever since Kahneman and Tversky (1979) it is well known that choices people make between pairs of lotteries are reversed when the equivalent pairs of lotteries are framed in the domain of losses instead of gains. When facing the choice between a safe and a risky gain, humans tend to be risk-averse and choose the safe one. When choosing between a safe loss and a risky loss, however, they tend to become risk-seeking – taking the risky bet in order to avoid the loss. Thus prospects are not evaluated according to their consequences on the decision maker’s total wealth (as orthodox expected utility theory would propose), but relative to some reference point, often the status quo at the time when the decision is made. Reference point effects for social preferences – individuals’ attitudes towards the well-being of others – are less extensively studied, but some evidence suggests that the framing of a decision task matters as well. Bardsley (2008) extends a dictator game such that it allows senders to take money from the recipients. This manipulation should not affect those individuals who would give money in conventional dictator games and thus the proportion of givers should not change. In the experiments, however, significantly fewer senders give money if keeping everything is no longer the most selfish thing to do. Framing effects have also been identified in social dilemma games. Andreoni (1995) and Willinger and Ziegelmeyer (1999) find average contribution to public goods in experiments to be higher when the equivalent game is framed positively (giving to the public) than negatively (taking from the public). In this paper we study framing effects in antisocial preferences, which we understand as pleasure derived from lowering somebody else’s well-being, even if this comes at an own cost and in absence of negative reciprocity (we also refer to this kind of attitude as nastiness). To our knowledge, no study dealing with framing in antisocial preferences exists. Part of the reason could be that experimental studies on antisocial behaviour are in general very rare. Otherregarding behaviour studied in the laboratory is overwhelmingly of the nice kind – people showing manners that are altruistic, fairness-minded and cooperative, with pure selfishness as the very worst case. Spiteful, malevolent or nasty behaviour has seldom been the focus of experimentalists’ attention. Notable exceptions are the seminal studies by Zizzo and Oswald (2001) and Zizzo (2004), who find that many subjects are willing to pay for reducing other people’s income, mainly to close a disadvantageous income gap. More recently, Abbink and Sadrieh (2008) and Abbink and Herrmann (2009) remove the inequality aversion motive from their joy-of-destruction game, and still find destruction frequencies of up to 40 per cent.1 The reason for the widespread neglect of the dark side of human behaviour among experimentalists in not so clear. Perhaps it is that at first glance we would not expect antisocial behaviour to be observable experimentally at all. Since tonnes of experimental evidence from standard games seem to prove that human beings are more altruistic, more fairness-minded, and more cooperative than the selfish homo oeconomicus, we may not expect much from the search for nastiness in the lab. However, such reasoning is premature. It is true, for example, that many subjects voluntarily share their endowment in dictator games, and this is the regu1. A related phenomenon is the case of antisocial punishment in public good games. Though the norm is for cooperators to punish free-riders, there are also many selfish individuals punishing contributors (Gächter et al. (2005), Cinyabuguma, Page and Putterman (2007), Herrmann et al. (2008)).. 1.
(5) larity that behavioural economists typically focus on. It is easy to overlook that a great number of subjects, often the majority, do keep everything for themselves. These subjects are readily classified as selfish own-income maximisers. But the dictator game does not tell us whether they are really just selfish or possibly even nasty, i.e. they feel a genuine pleasure leaving their partner empty-handed. Would they even pay for it if they had to? Keeping everything is as bad as one can do in the dictator game, and so nasty and selfish behaviours are indistinguishable.2 There is, generally, no contradiction between the antisocial behaviour observed in the above-mentioned studies and the vast body of evidence on kind behaviour. Detecting antisocial preferences just requires different elicitation methods. In addition, the dominance of prosocial behaviour in the lab might be triggered by the games that are typically used. Social as well as antisocial preferences may not be fixed, but dependent on the context. Subjects who would behave prosocially in one context might well become aggressive in another (like a man’s attitude towards someone he is about to meet is probably different before a boxing match from before a candlelight dinner). Though no readymade theories have been put forward on how context shapes antisocial attitudes, we know that already within the realm of prosociality small manipulations matter (see, e.g., Eckel and Grossman (1996) and Fahr and Irlenbusch (2000) on earned property rights, Bolton, Brandts, and Ockenfels (1998) and Brandts and Solà (2001) on intentions). To explore the influence of context, we start with a straightforward manipulation of reframing tasks, switching from the domain of gains to that of losses. This seems a good starting point because, first, it is a prominent factor known to be influential in other frameworks, and, second, it involves a pure presentation effect. No material differences, like effort put into earning endowment or a different history of play, can plausibly affect behaviour. In this study we confront subjects with a number of choices of the following kind. “You have x points and the other player has y points. You can reduce the other player’s payoff by 50 points. It costs you 10 points. Do you want to reduce the other player’s payoff?” In a second treatment subjects face the same tasks, but framed as generating income rather than destroying it:. 2. Iriberri and Rey-Biel (2008) conduct experiments in which dictators can choose to either give money to the recipient or destroy the recipient’s endowment, both at a cost. The authors find that a significant minority (about 10 per cent) destroy money.. 2.
(6) Set B. Disadvantageous inequality, negative framing. Set A. Advantageous inequality, negative framing. Task no.. Start distribution. Damage. Burning costs. End distribution. Task no.. Start distribution. Damage. Burning costs. End distribution. B1 B2 B3 B4 B5 B6 B7. (50,50) (50,100) (50,150) (50,200) (50,250) (50,300) (50,600). 50 50 50 50 50 50 50. 10 10 10 10 10 10 10. (40,0) (40,50) (40,100) (40,150) (40,200) (40,250) (40,550). A1 A2 A3 A4 A5 A6 A7. (70,50) (100,50) (150,50) (200,50) (250,50) (300,50) (600,50). 50 50 50 50 50 50 50. 10 10 10 10 10 10 10. (60,0) (90,0) (140,0) (190,0) (240,0) (290,0) (590,0). Set B’. Disadvantageous inequality, positive framing. Set A’. Advantageous inequality, positive framing. Task no.. Start distribution. Gain Other. Gain Self. End distribution. Task no.. Start distribution. Gain Other. Gain Self. End distribution. B1’ B2’ B3’ B4’ B5’ B6’ B7’. (40,0) (40,50) (40,100) (40,150) (40,200) (40,250) (40,550). 50 50 50 50 50 50 50. 10 10 10 10 10 10 10. (50,50) (50,100) (50,150) (50,200) (50,250) (50,300) (50,600). A1’ A2’ A3’ A4’ A5’ A6’ A7’. (60,0) (90,0) (140,0) (190,0) (240,0) (290,0) (590,0). 50 50 50 50 50 50 50. 10 10 10 10 10 10 10. (70,50) (100,50) (150,50) (200,50) (250,50) (300,50) (600,50). Table 1. The four sets of tasks used in the experiment. The tasks with equal start or end distribution (A1 and A1’) have been arbitrarily assigned to sets B and B’.. “You have z points and the other player has w points. You can increase the other player’s payoff by 50 points. It gains you 10 points. Do you want to increase the other player’s payoff?” Choosing z = x–10 and w = y–50 makes the two tasks perfectly equivalent in terms of payoffs. Start and end distribution are swapped, and the nasty option is now to not increase the other player’s payoff and realise a feasible own gain. But in terms of the two eventual allocations to choose from, both tasks are exactly the same. 2. Experimental procedures Our design consists of four sets of tasks. In the first two sets (sets B and B’, for “Behind”, the decider’s position) the decider faces inequality to his or her disadvantage in the original endowment. Burning costs are always 10, the amount burnt is always 50, and the own endowment is 50 in all tasks. The victim’s endowment is varied from 50 (the borderline case in which there is no disadvantageous inequality) to 600, a case of extreme inequality. Table 1 lists all seven tasks in this set. We use the following notation. The pair (x,y) stands for a distribution of payoffs between the decider and the victim, where x is the decider’s and y the victim’s payoff. For each task in set B there is an equivalent task in set B’. Start and end distribution are swapped, the task is now presented as generating a gain of 50 for the victim, while earning 10 oneself. Effectively, the decider chooses between the two distributions, and the distributions. 3.
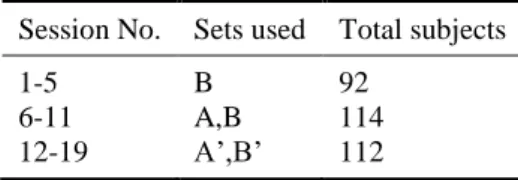
(7) to choose from are identical in the negative framing task and the corresponding task with positive presentation. Hence if subjects have a fixed hard-wired preference profile they should have the same preferences over the two distributions and any difference in choice behaviour would be a pure framing effect. In the second two sets of tasks the decider is Ahead (hence denoted sets A and A’) in the initial distribution. We start with a small advantage and gradually increase the decider’s endowment. Burning costs and damage are kept constant. Each task in set A is matched with an equivalent task in set A’, there framed as gains instead of damages and costs. The experiment was conducted in the Laboratoire d’Expérimentation en Sciences Sociales (LABEX) of the University of Rennes I, France. The experiment was computerised with software developed using the z-Tree programming package (Fischbacher (2007)). Subjects were recruited from a database of students who had previously registered at LABEX. They were mostly undergraduate students from a wide range of disciplines. Each subject was allowed to participate in only one session. Each subject decided on multiple tasks, for practical reasons. A pure one-shot design in which each subject performed only one task would have had its advantages, since crosscontamination of tasks could be ruled out. However, such a design would have stretched our resources beyond exhaustion. In such a design every single decision would have needed one subject and the across-subject design would have created additional noise and even increased the number of participants needed to account for it.3 Table 2. The experimental setup Session No.. Sets used. Total subjects. 1-5 6-11 12-19. B A,B A’,B’. 92 114 112. Subjects who took the role of the victims did not make decisions, but they were asked to state their expectations about the deciders’ behaviour. Their statements were not incentivised because this would have changed the payoff comparisons between the two individuals in a pair.. A session lasted for about 30 minutes (this includes the time spent to read the instructions). At the end of the experiment, one task was randomly selected for each pair of subjects. This task was paid anonymously, at a conversion rate of one euro for eight points plus a show up fee of 3 euros. On average, subjects earned approximately 17 euros. At the time of the experiment, the exchange rate to other major currencies was approximately US-$1.30, £0.90, ¥130, and RMB9 for one euro. We conducted 19 sessions in total, comprising of 318 participants in total, half of them deciders, half victims. In five sessions set B was used, together with 11 other tasks not reported in this study.4 The sessions with positive and negative framing were kept separate, i.e. no subject 3. We follow Andreoni and Miller (2002) in this respect. Note that all inference we draw in this study stems from pure within-subject analysis. So even if there were some contamination effects, they would be mere magnitude effects, affecting the overall destruction rates. The focus of this study, however, is on patterns we can detect across tasks, and these patterns are unlikely to be affected by such effects. 4. Our original research plan involved only equality and disadvantageous inequality. After the first five sessions we unexpectedly observed the highest destruction rates in the task with equal endowments. For the following sessions we then decided to extend the range of initial distributions to advantageous inequality, but to replicate the seven tasks of set B as well. No significant differences between the set A choices in sessions 1-5 and 6-11 could be detected.. 4.
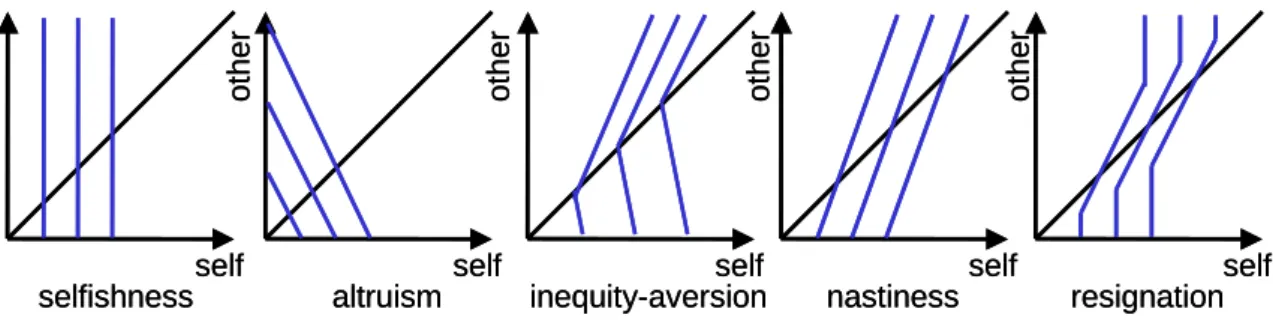
(8) took decisions with both framings. A session comprised of between 10 and 24 participants; the variation is due to varying sign-up and show-up rates. The participants were randomly assigned the role of decider or victim. Since there was no feedback between the decisions, each individual is a statistically independent observation. 3. Theoretical benchmarks. self selfishness. self altruism. self inequity-aversion. other. other. other. other. other. Figure 1 illustrates four prominent theoretical social preference profiles, represented by indifference curves (see Charness and Rabin (2002) for a discussion). We use them as benchmarks to generate predictions, not to suggest that people actually have completely ordered (anti)social preferences. Note that any systematic framing effect immediately refutes the assumption of consistent preferences that depend on the two relevant payoffs only.. self nastiness. self resignation. Figure 1. Graphical representation of theoretical preference profiles.. The first two benchmarks, selfishness and altruism, would both predict that there are no destructions in our data. Purely selfish decision makers are completely indifferent towards the other person’s well-being (hence their indifference curves are vertical lines) and would not incur own costs to improve or lower it. Altruists, whose indifference curves are downward sloping (not necessarily linear like in the graph) would be willing to give up own payoff to benefit others, but not to harm them. Hence no destructions. The third profile illustrates inequity averse preferences. This example with linear indifference curves is the classical variant from Fehr and Schmidt (1999, for a discussion see Engelmann and Strobel (2004, 2007)). The utility function they propose is a two-part piecewise linear function5 that is u = x – α(y–x) for allocations in which self is behind (x < y) and u = x – β(x – y) when self is ahead (x > y). The typical assumptions, as put forward by Fehr and Schmidt (1999), are that 0 < α < 1 and 0 < β < α. This means that, first, for a given own payoff the most preferred allocation is equity between the two individuals (hence both advantageous and disadvantageous inequality are undesirable); second, the own payoff has a greater weight than the other individual’s payoff; and third, being behind is more upsetting than being ahead by the same amount. In our setup, destructions when the decider is behind are consistent with inequity aversion (if α > ¼); destructions when the decider is ahead are not. The fourth panel in figure 1 shows a preference profile we may call competitive or nasty. For a given own payoff, the decider feels the better the less the other individual has. This holds not only for disadvantageous inequity (where it can be explained by envy), but across the en5. Linearity implies that most optimal allocations are corner solutions. See Ottone and Ponzano (2005) for an extension with non-linear utility functions.. 5.
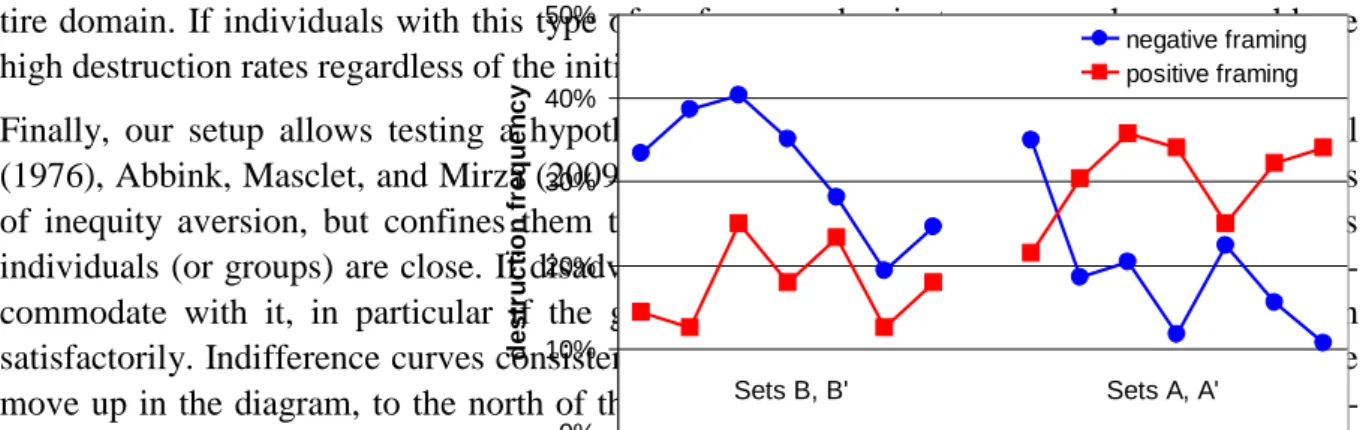
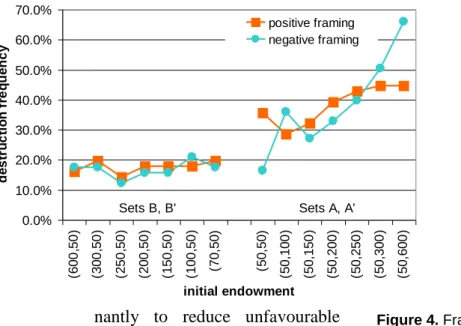
(9) destruction frequency. 50% of preferences dominate our sample, we would see tire domain. If individuals with this type negative framing high destruction rates regardless of the initial distribution. positive framing 40%. (5 0 (5 ,50 0, ) 1 (5 00 0, ) 1 (5 50 0, ) 2 (5 00 0, ) 2 (5 50 0, ) 3 (5 00 0, ) 60 0). (6 00 (3 ,50 00 ) (2 ,50 50 ) (2 ,50 00 ) (1 ,50 50 ) (1 ,50 00 ) ,5 (7 0) 0, 50 ). Finally, our setup allows testing a hypothesis put forward in the conflict literature (Nagel (1976), Abbink, Masclet, and Mirza (2009)). This theory of resignation is based on the ideas 30% of inequity aversion, but confines them to payoff distribution in which the payoffs across 20% individuals (or groups) are close. If disadvantageous inequality becomes extreme, people accommodate with it, in particular if the gap is so wide that it cannot be narrowed down 10% satisfactorily. Indifference curves consistent with this type of resignation bend inwards as we Sets B, B' Sets A, A' move up in the diagram, to the north of the 45 degree line. In the data we would expect de0% creasing destruction rates as disadvantageous inequity increases across the tasks of set A. The theory makes no specific prediction for advantageous inequality, but we might expect inequality here as well to become less relevant when it is already extreme. initial endowment. There is a variety of evolutionary models that could explain these different types of preferences. Selfish preferences need no explanation; any model where fitnesses depend positively on ones own payoff in the game, and where individuals meet at random in a well mixed population, would lead to selfish preferences surviving a process of mutation and selection. Linear altruistic or linear nasty preferences (as shown in Fig. 1b and 1d) could evolve in a kin- or standard group selection model, if the variables along the axes are fitnesses or translate to fitnesses in a linear way (see Van Veelen (2006)). Inequity averse preferences are harder to explain by these standard models, because they have one part where utility increases in how much the other gets and another part where utility is decreasing in the amount of the other, all in the same preference relation. The last, non-linear spiteful preferences could be expected to arise in situation where fitness is determined by ranking within the group, and not by the absolute value of money, food, or whatever it is that is represented along the axes. 4. Results Figure 2 shows the destruction rates in the 28 tasks of the experiment (with positive framing “destruction” means not increasing the victim’s payoff). The blue graph with round markers depicts the choice frequencies in the treatment with negative framing, the red graph with square markers the corresponding graph for positive framing. We can see clear differences between the two treatments, despite very similar overall destruction rates (with negative framing, we observe burning in 25.2% of all cases, with positive framing the rate is only slightly and insignificantly lower at 24.0%). 6 So neither framing induces more nastiness than the other, but the behavioural patterns we observe are radically different. The graph we observe for negative framing reveals two surprising phenomena. First, the subjects exhibit primarily equity aversion, rather than the inequity aversion as proposed in the literature. Looking at the choices for set A (equality and disadvantageous inequality) we can see that destruction rates are significantly higher in task (50,50) than in any of 6. The similarity of the destruction rates makes it also unlikely that destruction is explained by default effects or demand effects. The former would imply that subjects simply take the default option (in this case the given endowment) and are reluctant to change it (see Thaler and Benartzi (2004)). The latter proposes the opposite: Subjects come to the experiment and believe that they have to “do something”. The two framings reverse the default and the active action, yet our destruction rates are unaffected. Note that our experiment involves binary choices, and the subjects had to tick one box in any case, so default or demand effects are not very plausible anyway.. 6.
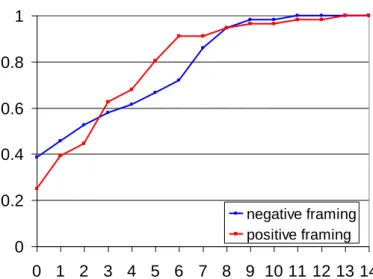
(10) the other tasks!7 This is clearly inconsistent with existing theories of inequality aversion (like Fehr and Schmidt (1999)). Second, destruction rates are higher when decision makers are ahead in the initial endowment, than when they are behind.8 Thus, the main driver of nasty behaviour in this treatment is not envy – the desire to close an unfavourable income gap –, but aggressive competitiveness, i.e. the wish to enhance an already advantageous position. Destruction rates even tend to rise as the gap between the own payoff and the victim’s payoff widens. Highly advantageous positions spurn the highest destruction rates of one third or more. The picture becomes very different with positive framing. The peak at equality vanishes. The relation between advantageous and disadvantageous inequality is even reversed. Burning rates are significantly higher when the decision maker is behind in the income distribution. While we can see clear and strong effects at the aggregate level, individual behaviour is rather heterogeneous. Figure 3 shows the cumulative distribution of the total number of destruction choices in the 14 tasks, based on the data from sessions 6-19 (sessions 1-5 did not comprise both sets A and B). A fracFigure 2. Destruction rates with negative framing (round markers) tion of subjects never burn and positive framing (square markers). (38.6% with negative, 25.0% with positive fram1 ing), while quite a few subjects destroy money at most of the occasions (though no-one 0.8 always burns). Strong differences in the distribution of burning 0.6 frequency are not detectable. 0.4 0.2. negative framing positive framing. 0. 0 1 2 3 4 5 6 7 8 9 10 11 12 13 14. Figure 3. Cumulative distribution of the total number of burns per subject (max: 14) Table 3. Pair-wise comparison of individual burning frequencies across tasks (set A). 50 100 150 200 250 300 *** * *** 600 29/4 14/6 13/3 9/8 13/1 8/3 300 26/7** 14/11 13/9 9/13 13/6 250 21/9* 9/13 6/9 4/15** 200 27/3*** 12/6 14/5* 7 See table ** 3 for statistical validation. 150 22/7 8/10 8 For statistical validation, we compute overall burning rates in all advantaged and all disadvantaged tasks for each and B were used. We find that 26 deciders exhibit greater 100 individual 20/3*** in sessions 6-11, in which both sets n=A 103 destruction rates with advantageous inequality, and only 12 in which the reverse holds. This difference is signifisignificance cant One-sided at p = 0.017 (one-sided,levels: binomial test). p<0.05 (*), p<0.01 (**), p<0.001 (***) 7 First row/column entry describes the task, identified through the victim’s initial endowment. We count the number of subjects who burned in the.
(11) Visual examination of figure 2 does not suggest strong support for the resignation hypothesis posed in section 3. Destruction rates are indeed low for extreme levels of disadvantageous inequity, but a clear decreasing trend is not visible. Nevertheless, there is statistical support for it in the treatment with negative framing. We compute Pearson correlation coefficients between the victim’s endowment (from 100 to 600) and a decider’s burning decision (which is 0 or 1) for each individual. We then use these coefficients as a test statistic for a nonparametric test. In fact, the binomial test detects a weakly significant (p = 0.0821) predominance of negative over positive correlation coefficients.9 The more powerful Wilcoxon rank sum test (which takes into account the ranks of the absolute values, not only the sign) yields strong significance at p < 0.001. With positive framing no such tendency can be detected. Figure 4 shows the expectations we elicited from the subjects who were in the role of the victims. Interestingly, the framing effect is not anticipated; expectations are similar in both framing conditions, both reflect the pattern we observe with positive framing. Victims expect deciders to be envious but not very nasty.10 5. Discussion We have conducted a simple money-burning experiment in which we varied the initial endowments of the decision maker and the victim. Our results suggest that revealed preferences depend on the framing. Equivalent tasks generate different behavioural patterns depending on whether the task is presented as an income generating or an income destroying task. With destruction framing decision makers become equality averse and aggressively positive framing competitive. They harm the victim mainly negative framing when they are already equal or ahead in the distribution. Traditional notions of inequality aversion are refuted.. 60.0% 50.0% 40.0% 30.0%. When the same tasks are presented as choices of whether or not to generate income, the picture changes dramatically and we observe a behavioural pattern more in line with traditional notions of inequality aversion. People then use their option to burn (here: to refuse mutually profitable income generation) predomi-. 20.0% 10.0% Sets B, B'. Sets A, A' (50,600). (50,300). (50,250). (50,200). (50,150). (50,100). (50,50). (70,50). (100,50). (150,50). (200,50). (250,50). (300,50). 0.0% (600,50). destruction frequency. 70.0%. initial endowment. nantly to reduce unfavourable inequality, and become less spite-. Figure 4. Fraction of subjects who expected destruction for a given task.. 9. Note that it is irrelevant for this test whether the individual correlation coefficients are statistically significant (typically they are not – and since an individual’s decisions are not independent from one another such a significance would be meaningless anyway). The concept is that if deciders’ decision behaviour did not follow any downward pattern, then positive and negative coefficients would be randomly positive or negative, with equal probability. If we observe a predominance of either positive or negative coefficients then we can reject the null hypothesis of no pattern in favour of the alternative hypothesis of a systematic upward or downward trend. 10. The victims had to make predictions about the deciders’ behaviour without receiving any feedback during the experiment. They were thus in a similar situation as we, the authors, were before we conducted the experiment. For the negative framing treatment they had similar guesses as we had – and were equally wrong.. 8.
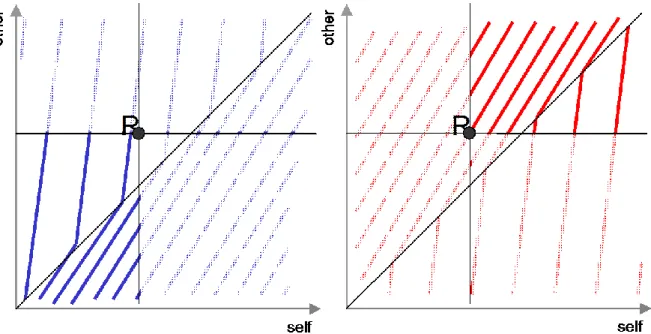
(12) ful when they are ahead. It appears that the option to reduce the other person’s payoff triggers a competitive mental mode, in which winning becomes important. With positive framing, when the task is about realising a mutually beneficial gain, subjects get into a more cooperative mode, and equity and fairness considerations become more prominent. The stark framing effect suggests that, analogous to what is known about risky choice behaviour, subjects’ evaluation of income distributions is reference point dependent. Figure 5 shows a preference profile consistent with the behavioural patterns we observe. When the choice is about destruction, thus moving southwest from the reference point (the initial distribution), the relevant indifference curves are convex and increasing. Spite (represented by a positive slope of the indifference curve) is more pronounced below the 45 degree line, where the own income is greater than the victim’s. An income generating task, i.e. a northeast move from the reference point, corresponds to concave indifference curves. Spite becomes the more intense as we move north, i.e. the farther the victim gets ahead of the own income. Two remarks seem reasonable. First, it may not be a coincidence that our results pretty well reflect the core ideas of inequality aversion with positive framing, while they are in stark contrast to them when we use the language of destruction. Note that these theories are inspired by results from a certain family of lab games, mainly dictator, ultimatum, trust or dilemma games. These games involve either a redistribution or an efficiency-enhancing creation of income; destructive acts are confined to punishment (i.e. negative reciprocity). Thus these games are naturally framed in positive terms. This does not imply that in our tasks positive framing is the more natural way to present the choices as well. On the contrary, the possibility of doing great harm to others at relatively minor own costs is ubiquitous (it takes a minute and a match to burn down a house, but a year and many resources to rebuild it). Hence, opportunities to destroy are omnipresent, while situations in which an opportunity of income generation spontaneously arises are relatively rare.11. 11. The effectiveness of altruistic punishment (see Fehr and Gächter (2000) for public good, or Abbink et al (2008) for conflict settings) relies on this feature. Punishment can only be so effective because everybody can punish everybody else at negligible costs. It is necessary only because creation of mutual benefits is tedious and involves strong free-rider incentives.. 9.
(13) Figure 5. Indifference curves consistent with observed behavioural patterns. The reference point R is the original endowment. Choices framed as losses are located to the southwest of R, as indicated in the left panel. Choices framed as gains lie northeast of R, illustrated in the right panel.. Of course our study has its limitations. This being the first experiment to elicit antisocial preferences and framing, it cannot be more than a first glimpse into human behaviour in this framework. First, we get strong effects at the aggregate level, but the data set is too coarse to allow much analysis of individual choice patterns. As a starting point for this more exploratory study we decided to cover a wide range of payoff distributions. The price we pay is that we can say little about regularities arising in finer variations. Second, the link between antisocial behaviour observed in our experiment and the vast body of data on prosociality needs to be established. This is far beyond the scope of this paper, but it opens up a promising research agenda for the future. References 1B. Abbink, K, J Brandts, B Herrmann, and H Orzen (2008): Inter-Group Conflict and Intra-Group Punishment in Experimental Contest Games. American Economic Review, forthcoming. Abbink, K, and B Herrmann (2009): The Moral Costs of Nastiness. Working paper, University of Amsterdam. Abbink, K, D Masclet, and D Mirza (2009): Inequality and Riots – Experimental Evidence. Working paper, University of Amsterdam and University of Rennes I. Abbink, K, and A Sadrieh (2008): The Pleasure of Being Nasty. Economics Letters, forthcoming. Andreoni, J (1995): Warm-glow versus cold-prickle: the effects of positive and negative framing on cooperation in experiments. Quarterly Journal of Economics, 60, 1–14. Andreoni, J, and J Miller (2002): Giving According to GARP: An Experimental Test of the Consistency of Preferences for Altruism. Econometrica, 70, 737-753. Bardsley, N (2008): Dictator game giving: altruism or artefact? Experimental Economics, 11, 122-133. Bolton, GE, J Brandts, and A Ockenfels (1998): Measuring Motivations for the Reciprocal Responses Observed in a Simple Dilemma Game. Experimental Economics, 1, 207-219. Brandts, J, and C Solà (2001). Reference points and negative reciprocity in simple sequential games. Games and Economic Behavior, 36, 138–157. Charness, G, and M Rabin (2002): Understanding Social Preferences With Simple Tests. Quarterly Journal of Economics, 117, 817-869. Cinyabuguma, M, T Page and L Putterman (2006): Can Second-Order Punishment Deter Perverse Punishment? Experimental Economics, 9, 265-279.. 10.
(14) Eckel, C, and PJ Grossman (1996): Altruism in anonymous dictator games. Games and Economic Behavior, 16, 181–191. Engelmann, D, and M Strobel (2004): Inequality Aversion, Efficiency, and Maximin Preferences in Simple Distribution Experiments. American Economic Review, 94, 857-869. Engelmann, D, and M Strobel (2007): Preferences over Income Distributions: Experimental Evidence. Public Finance Review, 35, 285-310. Fahr, R, and B Irlenbusch (2000): Fairness as a constraint on trust in reciprocity: earned property rights in a reciprocal exchange experiment. Economics Letters, 66, 275-282. Fehr, E, and S Gächter (2000), “Cooperation and Punishment in Public Goods Experiments,” American Economic Review, 90, 980-994. Fehr, E, and KM Schmidt (1999): A theory of fairness, competition and cooperation. Quarterly Journal of Economics, 114, 817-868. Fischbacher, U (2007): z-Tree: Zurich Toolbox for Ready-made Economic Experiments. Experimental Economics, 10, 171-178. Gächter, S, B Herrmann, and C Thöni (2005): Cross-cultural differences in norm enforcement, Behavioral and Brain Sciences, 28, 822-823. Herrmann, B, C Thöni, and S Gächter (2008): Antisocial Punishment Across Societies. Science 319, 1362-1367. Iriberri, N, and P Rey-Biel (2008): Elicited Beliefs and Social Information in Modified Dictator Games: What Do Dictators Believe Other Dictators Do? Working paper, Universitat Pompeu Fabra Kahneman, D, and A Tversky (1979): Prospect Theory: An Analysis of Decision under Risk. Econometrica, 47, 263-291. Nagel, JH (1976): Erratum. World Politics 28. Ottone, S, and F Ponzano (2005): An Extention of the Model of Inequity Aversion by Fehr and Schmidt. Working paper, Universita’ del Piemonte Orientale Alessandria. Thaler, RH,and S Benartzi (2004): Save More Tomorrow: Using Behavioral Economics to Increase Employe Saving. Journal of Political Economy, 112, 164-187. van Veelen, M (2006) Why kin and group selection models may not be enough to explain human other-regarding behaviour. Journal of Theoretical Biology, 242, 790-797. Willinger, M, and A Ziegelmeyer (1999): Framing and cooperation in public good games: an experiment with an interior solution. Economics Letters, 65, 323-328. Zizzo, D, and AJ Oswald, (2001): Are People Willing to Pay to Reduce Others’ Incomes? Annales d’Economie et de Statistique 63-64, 39-62.. 11.
(15)
Figure
+3
Documents relatifs
Partitive articles (du, de la, del') are used to introduce mass nouns, that is nouns that are conceived of as a mass of indeterminate quantity.. They are usually translated as
The steps performed during analysis were: (1) Open coding, where each sentence were coded with its messasge(message) and type of message (category) as shown in the example in Table
The last column of the table reports the test statistics based on the null hypothesis that there are three decision- makers in the household and that the distribution factors
This activity transforms the desired UX business impact and the understanding of users’ and system’s world into concrete, measurable UX design targets.. Further, it is useful
Moreover, astronger degree of inequality aversion above the median revealed by the initial proposals is associated with a slower aggregation process.Finally, anonymity in the
Original extrahilar approach for hepatic portal revascularization and relief of extrahepatic portal hypertension related to late portal vein thrombosis after
This survey of 210 insect species from six major orders revealed that within Orthopterans levels of genetic diversity were ~20% higher and microsatellite repeat arrays were
Firstly, the high He will allow to confirm the « heterozygosity instability hypothesis » for large differences between the heterozygous allele and its homologue (i.e. up to a
