HAL Id: hal-01010941
https://hal.archives-ouvertes.fr/hal-01010941
Submitted on 11 Oct 2017
HAL is a multi-disciplinary open access
archive for the deposit and dissemination of
sci-entific research documents, whether they are
pub-lished or not. The documents may come from
teaching and research institutions in France or
abroad, or from public or private research centers.
L’archive ouverte pluridisciplinaire HAL, est
destinée au dépôt et à la diffusion de documents
scientifiques de niveau recherche, publiés ou non,
émanant des établissements d’enseignement et de
recherche français ou étrangers, des laboratoires
publics ou privés.
Mechanism of fatigue crack growth in carbon black filled
natural rubber
Jean-Benoit Le Cam, Bertrand Huneau, Erwan Verron, Laurent Gornet
To cite this version:
Jean-Benoit Le Cam, Bertrand Huneau, Erwan Verron, Laurent Gornet. Mechanism of fatigue crack
growth in carbon black filled natural rubber. Macromolecules, American Chemical Society, 2004, 37
(13), pp.5011-5017. �10.1021/ma0495386�. �hal-01010941�
Mechanism of Fatigue Crack Growth in Carbon Black Filled Natural
Rubber
J.-B. Le Cam, B. Huneau, E. Verron,* and L. Gornet
Institut de Recherche en Ge´nie Civil et Me´canique, UMR 6183, Ecole Centrale de Nantes, BP 92101, 44321 Nantes Cedex 3, France
Received March 8, 2004; Revised Manuscript Received April 23, 2004
ABSTRACT: The present paper deals with the fatigue crack growth in a carbon black filled cis-1,4-polyisoprene rubber under relaxing loading conditions. The study focuses on the determination of the scenario of crack growth. For this purpose, an original “microcutting” method is employed to observe microscopic phenomena involved in the growth of the crack with a SEM. It reveals that the cavitation induced by the decohesion between zinc oxides and rubber matrix is the major fatigue damage and that the crack tip is composed of stretched elliptical areas surrounded by highly stretched and crystallized ligaments. Finally, the observations are considered to establish the fatigue crack growth mechanism.
1. Introduction
Most of the studies that focus on crack propagation in elastomers are based on purely mechanical theories. They are often inspired by metallic materials results through the definition of the tearing energy as the large strain counterpart of the elastic energy release rate.1,2
These phenomenological approaches provide interesting results but do not satisfactorily predict crack propaga-tion paths in rubber parts.3Because of the complexity
of rubber mechanical properties, i.e., large strain, nonlinear hyperelasticity, Mullins and Payne effects, and influence of fillers, the determination of the physical mechanisms that drive the fatigue damage is an es-sential prerequisite to improve phenomenological theo-ries. In glassy polymers, the crack propagation was widely investigated, and several cracking micromecha-nisms are already available.4-8To our knowledge, such
explanations do not exist for rubber cracking.
Mechanisms involved in fatigue crack propagation are classically established using fractographic analyses of fracture surfaces thanks to scanning electron micros-copy (SEM). Such analyses provide important data on local deformation, loading conditions, crack initiation, and propagation path leading to fracture. Published works on crack propagation in elastomers tend to explain fracture surfaces, but they do not propose scenarios for crack growth.9-11
The aim of the present paper is to propose such a fatigue crack growth mechanism. For this purpose, an original SEM in-situ observation method of the crack tip microstructure is carried out to determine the physical mechanism of crack propagation in filled rub-ber. In the next section, the experimental procedure is described: the sample and fatigue loading conditions are recalled, and the in-situ microcutting method is detailed. The results are given in section 3. First the crack tip and its surroundings are briefly described, then the chronology of crack growth induced by mi-crocutting is thoroughly examined. These observations are next used to establish the fatigue crack growth mechanism. Finally, concluding remarks close the pa-per.
2. Experimental Section
2.1. Material and Sample. The material considered here is a 34 phr carbon black filled natural rubber. Table 1 summarizes its chemical composition and some mechanical characteristics. The compound was cured for 7 min, and the mold temperature was set to 160 °C. To overcome aging problems, samples were frozen at -18 °C 48 h after their molding. They are thawed out 24 h before testing.
The sample geometry is similar to the one proposed by Beatty;12it is presented in Figure 1. The sample is
axisym-metric and is usually called the “diabolo” sample. Its significant radius of curvature leads to a higher local deformation state in its middle than the enforced nominal deformation. Conse-quently, the predominant fatigue crack is initiated in the lowest diameter section, i.e., at the center of the sample.
2.2. Fatigue Loading Conditions. To generate micro-structural fatigue damage in the crack tip vicinity, the sample is beforehand stretched under uniaxial cyclic enforced dis-placement conditions. The stretch ratio varies between 1 and 1.33. The strain rate was set to limit the rise in temperature of the surface under 20 °C, to not superimpose an additional thermal damage to the mechanical damage. In practice, it corresponds to loading frequencies below 5 Hz. These tests are carried out at 23 °C regulated temperature until a self-initiated fatigue crack reaches a length of 5 mm at the surface of the undeformed sample. Figure 2 shows the fatigue crack in the undeformed (Figure 2a) and deformed (Figure 2b) configura-tions. It takes place at the middle of the sample beside the mold halves joint. For more details, the reader can refer to ref 13.
2.3. Scanning Electron Microscopy. Photomicrographs were performed with a Hitachi S-3200 N model SEM using secondary electrons. To determine the chemical elements of observed surfaces, an energy dispersive spectrometer of X-rays (EDSX) coupled with the SEM is used. Before observation, elastomer surfaces should be cleaned: here, the specimens are
* Corresponding author: e-mail Erwan.verron@ec-nantes.fr.
Table 1. Material Formulation and Mechanical Properties
material
formulation (phr) mechanical properties natural rubber 100 density 1.13 zinc oxide 9.85 shore A hardness 58 oil 3 stress at break (MPa) 22.9 carbon black 34 elongation at break (%) 635
sulfur 3
stearic acid 3 antioxidant 2 accelerators 4
submitted to ultrasounds in a neutral solution. Moreover, the considered material not being sufficiently conductive, charge-up occurs when it is irradiated with the electron beam. Thus, samples are coated with a 90 nm thick gold layer by vapor deposition at a stretched ratio equal to 1.33 to ensure electronic conduction.
2.4. Observation Method. The sample is fixed in a rudimentary static tensile apparatus (see Figure 2a), and it is statically stretched to the same ratio than the one enforced during the fatigue test (1.33) in order to open the crack (see Figure 2b). Then, this apparatus is placed in the SEM to observe the crack growth. As mentioned previously, the fatigue test led to initiation and propagation of a crack in the sample, and it involved a fatigue damage in the crack tip vicinity. Thus, the crack tip should be notched to reveal the fatigue damaged zones and to determine their origin. During SEM observations, it is obviously irrelevant to use a laboratory cutting tool to notch the crack. Nevertheless, it is possible to “microcut” the crack tip by imparting in situ a sufficient amount of energy to break cross-links between macromolecules. Two energy sources are used simultaneously: the first one is mechanical and consists of statically stretching the sample to a ratio equal to 1.67, i.e., higher than the level set during the cyclic loading, and the second one consists of locally concentrating the electron beam in the observation zone. In fact, the amount of energy needed to break cross-links cannot easily be determined since the number and nature of cross-links as well as the number of macromolecules in the irradiated zone are not well-known. However, the acquired experience enables us to correctly set the power of the electron beam and to recur experiments. The most favorable zones to perform
microcut-tings being the most stretched ones, they should be identified in situ. As the gold layer deposited on the surface cannot be deformed as much as the elastomer, spacing between gold particules is proportional to the stretch of the elastomer. Consequently, charge-up occurs at the most stretched areas which appear very bright in photomicrographs.
As a summary, the stretch ratio during gold layer deposition is equal to 1.33. Next, the sample is stretched to 1.67, and the electron beam is used to highlight the most stretched zones of the crack. Then, a sufficient amount of energy is imparted to initiate and propagate a microcrack that will reveal the fatigue damaged zone behind the crack tip.
3. Results
In this section, the crack and its surroundings are first described. Most of these results being easily observable; this description is brief. Then, the consequences of our microcutting method are examined. The crack growth is observed in real time, and finally, in regard to these results, a mechanism of fatigue crack growth is pro-posed.
3.1. Crack Description. Figure 3 presents a
sche-matic view of the crack and its surroundings. Six different areas are observed in the deformed configu-ration, i.e., as the sample is stretched to 1.67. Before the occurrence of the crack, there were only two zones: the central zone of the sample, denoted A in the figure, that is the most stretched part of the specimen, and the area situated on both sides of it and denoted B. When the crack occurs, four new zones appear: area C, which corresponds to the parts of area A relaxed during crack opening, and areas D, E, and F that stand for the crack itself. The photomicrographs of the three zones D, E, and F are shown in Figure 4. Area F stands for the crack tip, area D represents the material surfaces that were broken during the previous growth of the crack, and area E is the frontier between the former ones (see Figure 4a). The major difference between surfaces D and F is their stretching level. As shown in Figure 4b, area D is overlayed with wrenchings which are a typical feature of fracture surfaces observed under fatigue loading conditions.14,15 Here, the term “wrenchings”
refers to highly stretched ligaments which break and shrink. Area F is composed of highly stretched liga-ments which delimit elliptical smooth surfaces, and area E contains both wrenchings and ligaments. With regard to these observations, the number and size of ligaments in a zone seem closely related to its stretching level.
After this brief description of the crack, the crack tip F, in which our microcutting method will be applied, has to be more precisely examined. Figure 5 shows it for different magnifications. The crack tip is composed of a few hundred micrometers long ligaments which are highly stretched and surround smooth elliptical surfaces (see Figure 5a). Figure 5b-d presents the morphology
Figure 1. Geometry of the “diabolo” sample.
Figure 2. Sample and fatigue crack in the (a) undeformed and (b) deformed configurations.
Figure 3. Schematic view of the crack (D-F) and its sur-roundings (A-C).
of these elliptical surfaces and their surroundings. First, microcracks take place in their middle part; their orientation is perpendicular to the stretch axis (see Figure 5b). The presence of these microcracks shows that the smooth areas are propitious to the propagation of the crack. This property will be used in the following to apply our microcutting method. Moreover, these smooth areas are delimited by ligaments whose extremi-ties are located at their top and bottom. As an example, the photomicrograph in Figure 5c shows the top of any surface. It contains both stretched ligaments and a rough surface that corresponds with broken ligaments which shrank. Finally, using a larger magnification, Figure 5d shows that some zinc oxides are embedded in the relief of smooth elliptical areas. Oxides can be
considered as spherical-like particules, and their size is randomly distributed and varies between a few hundred nanometers and 5 µm.
3.2. Crack Tip Microcutting. The observation of the
crack tip has revealed major differences of stretch level between the various zones resulting from fatigue crack growth. To understand the mechanism that drives the fatigue crack growth, it is first necessary to determine the microstructural damage in the neighborhood of the crack tip. In this way, the SEM beam microcutting technique presented in section 2.4 is employed.
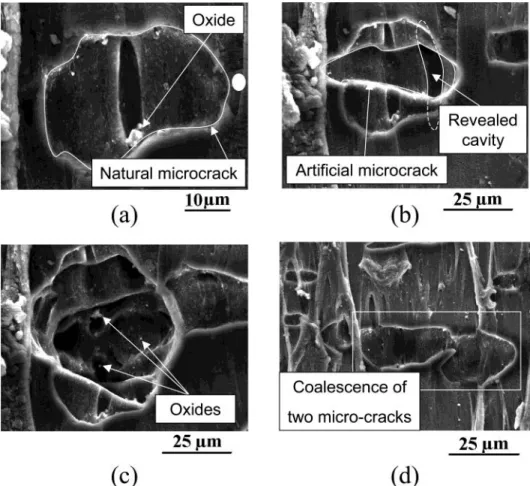
Some microcracks are generated by microcutting in one of the smooth areas of the crack tip. In fact, these microcracks can be seen as artificial counterparts of the natural microcracks previously described (see Figure
Figure 4. Details of areas D-F for two magnifications.
5b). Figure 6 presents the chronology of the real-time observation. The observation zone is shown in Figure 6a. It contains a natural microcrack near a ligament. In the middle of this microcrack, a stretched cavity containing an oxide takes place. Then, the electron beam is focused a few seconds beside the microcrack (see the white circle in Figure 6a). It leads to an artificial microcrack which initiates at the beam concentration point, slowly propagates to the other side of the natural microcrack, and stops at the ligament, as shown in Figure 6b. During its propagation, this artificial micro-crack revealed a cavity similar to the one observed in the natural microcrack. By continuing to focus the electron beam, new microcracks are propagating in the sample depth and are revealing cavities. Most of these cavities contain oxides (see Figure 6c). Moreover, note that this microcutting can also be used to induce the coalescence of existing microcracks by concentrating the electron beam between them (see Figure 6d). Finally, it should be mentioned that, as the electron beam is focused on ligaments (the SEM power settings being unchanged), they do not break even if they are exposed for a long time. It seems to indicate that the microstruc-tures of ligaments and elliptical areas between them are different. More precisely, this difference might be mainly due to the distribution of the crystallization ratio: the highly stretched ligaments represent the most crystallized zones of the crack tip. These results ob-tained under fatigue loading conditions are quiet similar to those recently established under static conditions by Trabelsi et al.,16who demonstrate that a crystallized
zone appears at crack tip of initial cut lengths 0.5 and 1 mm for stretch ratios greater than λ ) 1.3.
This experiment highlights that cavities take place in the vicinity of the crack tip due to decohesion between oxides and rubber matrix. Similarly, Layouni et al.17
associate the volume change of elastomers under me-chanical loading with the decohesion between zinc oxides and matrix. Cavitation in rubber is a well-known phenomenon that was thoroughly studied in the past for static loading conditions.18,19 Recently, it has been
shown that the number of preexisting microvoids per unit volume strongly correlates with the mechanical performance of elastomers.20For fatigue loading, only
internal crack growth under high hydrostatic pressure has been studied.21 Nevertheless, in the present case
of relaxing tensile fatigue, the origin of cavitation is not established: is it only a consequence of the stress state at the crack tip, or is it also due to fatigue loading conditions? To answer these questions, a second experi-ment is carried out. It consists of generating a self-initiated fatigue crack and observing the cavities dis-tribution in the sample.
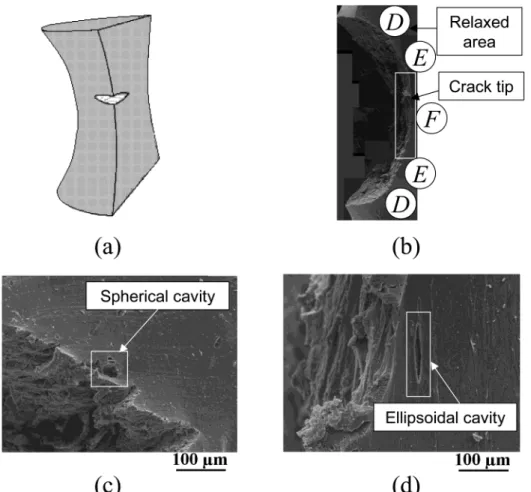
Figure 7 summarizes this second experiment. To observe cavities in the sample, it is cut in its undeformed configuration, as shown in Figure 7a. Afterward, it is stretched using the tensile apparatus presented above and introduced in the SEM. Figure 7b shows the opened crack tip and its surroundings. One can again distin-guished relaxed zones with numerous wrenchings at the top and the bottom of the crack, and the most stretched area, i.e., the crack tip, in the middle. Large cavities are observed in both areas near the crack faces, and their shapes highly differ: they are spherical in the relaxed zones (see Figure 7c) and ellipsoidal (due to the stretching level) behind the crack tip (see Figure 7d).
Moreover, it is important to notice that the size of the large spherical cavity in Figure 7c (as compared with the size of an oxide) demonstrates that this cavity grew under cyclic loading. Examining the cut surface of the sample, a large number of cavities are revealed; most of them contain oxide, and their size rapidly decreases with their distance from the crack. From a sufficiently long distance, no more cavities are observed.
As a conclusion, our experiments lead to two main results: (i) In the deformed configuration, the crack tip is composed of crystallized ligaments which delimit weaker elliptical smooth areas. (ii) Cavities induced by the decohesion between oxides and rubber matrix occur
just behind the crack tip under fatigue loading. They are revealed by the failure of elliptical areas.
3.3. Crack Growth Mechanism. Using the previous
observations, the scenario of fatigue crack growth is proposed in this section. It will be described thanks to two chronological sketches which correspond to two views of the phenomenon. Figures 8 and 9 present respectively the side and front views of crack growth. These two views will be used to accurately describe the three-dimensional nature of the phenomenon. It is to note that the chronology of the two figures are different; i.e., the stage of Figure 8a does not correspond to the one of Figure 9a.
Figure 7. Second experiment: (a) cut sample, (b) global view of the crack, (c) details of relaxed areas, (d) details of the crack tip.
The crack growth phenomenon can be seen as the succession of elementary sequences from initiation to final failure. Before examining this elementary se-quence, let us recall that both fatigue loading and the stress state in the neighborhood of the crack tip gener-ate cavitation due to the decohesion between oxides and rubber matrix as shown in Figure 8a. The elementary sequence is composed of three steps:
(i) As the crack tip is stretched, elliptical areas take place with ligaments on both sides and wrenchings at the top and bottom. Cavities are situated behind these areas, and their shape is ellipsoidal (see Figure 9a). As shown in Figure 8b, the wall that separates the crack tip and cavities is thin, such that it can be considered as a membrane.
(ii) This membrane tears and reveals most of the cavities situated behind it (see Figure 8c). The corre-sponding microcracks propagate perpendicularly to the crack growth direction (see Figure 9b).
(iii) Then, microcracks grow and eventually coalesce until the destruction of the elliptical areas. Moreover, ligaments break and relax to form the wrenchings which lie at the top and bottom of these elliptical zones (see Figure 9c). This fracture may be due to the fatigue of ligaments or/and to the new stress state in ligaments generated by their neighborhood. Schematically, the crack tip breaks, the crack grows, and the processus restarts at (i) (see Figure 8d). It should be noted that the coalescence of microcracks can be limited with the result that the elliptical zones are not completely destroyed and that ligaments occur between microc-racks, the consequence being the formation of several new elliptical areas (see Figure 9d).
4. Concluding Remarks
As a summary, an original technique of in-situ mi-crocutting and the observation of the material micro-structure behind the crack tip have led to propose a fatigue crack growth mechanism in filled natural rub-ber. It is now established that the fatigue damage is mostly due to cavitation induced by the decohesion between zinc oxides and rubber matrix.
The present work leaves some issues of importance unanswered. One of these is the relationship between our qualitative mechanism and some mechanical quan-tities such as the stress distribution, and more precisely the hydrostatic pressure, in the crack vicinity. Moreover, as the influence of the strain-induced crystallization of ligaments on the mechanism was highlighted, it would be interesting to perform a similar study with an uncrystallizable filled rubber such as SBR.
Acknowledgment. We thank the Allevard Rejna
Autosuspensions Co. for its collaboration.
References and Notes
(1) Rivlin, R. S.; Thomas, A. G. J. Polym. Sci. 1953, 10, 291-318.
(2) Gent, A. N. In Engineering with Rubber; Gent, A. N., Ed.; Hanser Publishers: Munich, 1992; p 96.
(3) Charrier, P.; Ostoja Kuczynski, E.; Verron, E.; Marckmann, G.; Gornet, L.; Chagnon, G. In Constitutive Models for Rubber, 3rd ed.; Busfield, J., Muhr, A., Eds.; A.A. Balkema Publishers: Lisse, 2003; p 3.
(4) Argon, A. S.; Salama, M. M. Philos. Mag. 1977, 36, 1217-1234.
(5) Hui, C. Y.; Ruina, A.; Creton, C.; Kramer, E. J. Macromol-ecules 1992, 25, 3948-3955.
(6) Sha, Y.; Hui, C. Y.; Ruina, A.; Kramer, E. J. Acta Mater. 1997, 45, 3555-3563.
(7) Tijssens, M. G. A.; Van Der Giessen, E. Polymer 2002, 43, 831-838.
(8) Adriaensens, P.; Storme, L.; Carleer, R.; Vanderzande, D.; Gelan, J.; Litvinov, V. M.; Marissen, R. Macromolecules 2000, 33, 4836-4841.
(9) Choudhury, N. R.; Bhowmick, A. K. J. Mater. Sci. 1990, 25, 2985-2989.
(10) Fukahori, Y. In Fractography of Rubber Materials; Bhowmick, A. K., De, S. K., Eds.; Elsevier Applied Science: London, 1991; p 71.
(11) Bhowmick, A. K. Rubber Chem. Technol. 1995, 68, 132-135. (12) Beatty, J. R. Rubber Chem. Technol. 1964, 37, 1341-1364. (13) Ostoja-Kuczynski, E.; Charrier, P.; Verron, E.; Marckmann, G.; Gornet, L.; Chagnon, G. In Constitutive Models for Rubber, 3rd ed.; Busfield, J., Muhr, A., Eds.; A.A. Balkema Publishers: Lisse, 2003; p 41.
(14) Le Cam, J.-B.; Ostoja-Kuczynski, E.; Brianc¸on, C.; Charrier, P.; Verron, E.; Perocheau, F. 38e`me Colloque annuel de
Rhe´ologie, Physique-Chimie des produits formule´s, Brest, France, 2003.
(15) Wang, B.; Lu, H.; Kim, G. Mech. Mater. 2002, 34, 475-483. (16) Trabelsi, S.; Albouy, P.-A.; Rault, J. Macromolecules 2002,
35, 10054-10061.
(17) Layouni, K.; Laiarinandrasana, L.; Piques, R. In Constitutive Models for Rubber, 3rd ed.; Busfield, J., Muhr, A., Eds.; A.A. Balkema Publishers: Lisse, 2003; p 273.
(18) Gent, A. N. Rubber Chem. Technol. 1990, 63, G49-G53. (19) Polignone, D. A.; Horgan, C. O. J. Elast. 1993, 33, 27-65. (20) Adriaensens, P.; Pollaris, A.; Vanderzande, D.; Gelan, J.;
White, J. L.; Kelchtermans, M. Macromolecules 2000, 33, 7116-7121.