HAL Id: hal-00776868
https://hal.archives-ouvertes.fr/hal-00776868
Submitted on 16 Jan 2013
HAL is a multi-disciplinary open access
archive for the deposit and dissemination of sci-entific research documents, whether they are pub-lished or not. The documents may come from teaching and research institutions in France or abroad, or from public or private research centers.
L’archive ouverte pluridisciplinaire HAL, est destinée au dépôt et à la diffusion de documents scientifiques de niveau recherche, publiés ou non, émanant des établissements d’enseignement et de recherche français ou étrangers, des laboratoires publics ou privés.
A Realistic Experiment of a Wireless Sensor Network on
Board a Vessel
Hussein Kdouh, Christian Brousseau, Gheorghe Zaharia, Guy Grunfelder,
Ghaïs El Zein
To cite this version:
Hussein Kdouh, Christian Brousseau, Gheorghe Zaharia, Guy Grunfelder, Ghaïs El Zein. A Real-istic Experiment of a Wireless Sensor Network on Board a Vessel. 9th International Conference on Communications, COMM 2012, Jun 2012, Bucarest, Romania. pp.189 - 192. �hal-00776868�
A Realistic Experiment of a Wireless Sensor Network
on Board a Vessel
H. Kdouh1,*, C. Brousseau2 , G. Zaharia1, G. Grunfeleder1 and G. El Zein1
IETR - Institut d’Electronique et de Télécommunications de Rennes
1INSA de Rennes, 2Université de Rennes 1
UMR CNRS 6164, Rennes, France
* E-mail : [email protected]
Abstract—Wireless Sensor Networks (WSN) may be a very
useful technology for monitoring systems in hostile environments. Few works have treated the use of this technology in the particular metallic shipboard environment. This paper reports on the deployment of a WSN on board a ferry-type boat during realistic conditions. The network was tested during sailings and stopovers for several days. The results of our previous papers reporting on the radio wave propagation on board ships are recalled. The network performance and a comparison of its evolution with respect to previous results are presented. In spite of the metallic structure of ferries and the dynamic movement of crew and passengers on board, the results have shown a very good network reliability and connectivity. The previous conclusions have been also confirmed by the topology evolution of the network and the analysis of RSSI levels of links between sensor nodes.
Keywords-Wireless sensor network; ships; watertight doors;
I. INTRODUCTION
Standardized monitoring systems have been designed to ensure safe public use of structures such as bridges, aircrafts, ships and pipelines. Ships are one of the most used structures for commercial and military purposes. Existing shipboard monitoring system uses extensive lengths of cables to connect sensors and actuators to central control units. The reduction of the huge amount of cables using a wireless communication between sensors and central units would greatly reduce the cost, weight and architecture complexity of vessels [1]. However, wireless communication on board ships is limited by several factors such as metallic bulkheads, watertight doors and multipath effects. A feasibility study of wireless communication on board vessels must be conducted to verify the possibility of replacing the current monitoring system by a Wireless Sensor Network (WSN). Few papers have studied the wireless communication on board ships. In [2], the authors have conducted ZigBee measurements on the passenger deck of a ship and a small WSN has been deployed between the main engine room and the control room. In [3], a WSN has also been tested successfully in the main engine room of a ship. In [4], we have tested a WSN on board a ferry moored to the harbor. All these measurements have been carried out when the ships were moored to the port. To date, experiments during ship operation have not been carried out. Since the main engine or other equipment and the passengers’ movements can affect the quality of wireless communication, it is necessary to conduct
measurements with a ship in operation. This paper investigates the feasibility of WSN on board vessels during realistic conditions. Based on the results of our previous studies, we have deployed a WSN in the three lower decks of a ferry called “Armorique”. The network has been tested for several days during sailings and stopovers between Roscoff (France) and Plymouth (United Kingdom). All realistic conditions (crew's and passengers' movements), fixed and mobile vehicles (“mobile” only during stopovers) in the parking, turned on motors and generators in engine rooms, etc…) have been considered. Sensing data (temperature, humidity, pressure, ambient light and acceleration), as well as data packets (sent and dropped packets, received signal strength indicator (RSSI), battery voltage) have been gathered and sent by sensor nodes to a base station placed in the control room.
The remainder of this paper is organized as follows: Section II describes the considered environments. Section III recalls the results obtained from our previous measurements on board “Armorique” vessel. The network setup, deployment procedure and results of the WSN test are shown in Section IV. Finally, conclusions are drawn in Section V.
II. MEASUREMENTS SITES
The test has been carried out on board “Armorique” vessel, which is a modern ferry from the Brittany Ferries company. This 29500-tons vessel is characterized by a length of 168.3 m, a beam of 26.8 m and a capacity of 1500 passengers [5]. The deckhouse of “Armorique” consists of the followings: the bottom deck which contains all engine rooms, the second deck which houses the control room, the third, the fourth and the fifth decks which are vehicles parking, the sixth and the seventh decks which contain restaurants, shopping and entertainment areas, the eighth and the ninth decks which house the passengers' cabins, and the bridge deck which contains the wheel house and the crew's cabins.
The tested network has mainly covered a part of the three lower decks including the parking (deck 3), the control room, the tank room, the rudder gear room, the changing room and the workshops room (deck 2), and the main and auxiliary engine rooms AER (decks 1 and 2). These configurations have been chosen for several reasons. Firstly, the considered environments are the most hostile for the wireless propagation on board the vessel (totally metallic bulkheads and watertight doors).
Secondly, most of the sensors (and the most critical ones) of the monitoring system are located in these areas. Finally, a WSN deployed in these areas can simulate all communication scenarios on board the vessel (communication between compartments or between decks, door opened or closed...). The engine rooms of “Armorique” ferry are constituted of equipment such as engines, generators, valves and pumps. All equipment and walls in this environment are made of metals, mainly steel. The parking (deck 3) is a big hall with metallic walls. A stairway, with two metallic watertight doors on its two sides, connects the control room and the parking. During 105 hours test, the ferry has made 10 cruises between Roscoff and Plymouth. After each sailing, the ferry makes a stopover for discharge, charge and maintenance. During this period, vehicles enter to or exit from the parking. Crew members were in continuous movement between rooms and decks containing sensor nodes, which leads to a frequent doors opening and closing. This frequent motion on board the ferry changes the characteristics of the propagation channel and modifies frequently the quality of the link between nodes.
III. PREVIOUS RESULTS
Point-to-point measurements have been previously conducted on board “Armorique” in the ISM 2.4 GHz band [6, 7]. Different configurations and measurement scenarios have been analyzed. A communication was considered as possible if the power of the received signal was higher than the sensitivity of an IEEE 802.15.4 compliant receiver (-90 dBm) that will be used in the network test (the transmission power was 0 dBm). The most important drawn conclusions are the followings:
1) The link between two nodes placed in the same room is often possible with a good quality, whatever the configuration of communication between the transmitter and the receiver (of-Sight or No Line-of-Sight).
2) The communication is not possible between two nodes located inside two adjacent rooms which do not have a common door. Some exceptions may be found when a huge amount of cables is installed between adjacent rooms.
3) The communication is possible between two nodes placed in adjacent rooms that have a common door (even if the door was closed).
4) The excess path loss due to the closure of a watertight door is about 25 dB (~17 dB) if the door is near to (far from) the direct path between the transmitter and the receiver.
5) The communication is not possible between two nodes separated by two closed watertight doors.
6) The doors and the cables installed between adjacent rooms are probably the only sources of radio leakage for signal propagation between adjacent rooms.
7) The communication between two nodes located in two adjacent decks is possible only when they are placed near to a stairway relating the two decks. Stairways are
probably the only radio leakage between adjacent decks.
IV. WIRELESS SENSOR NETWORK TEST
This section describes the network setup including the test equipment and the deployment procedure, presents and analyses the collected results.
A. Network Setup
The shipboard WSN test was carried out using Crossbow’s MICAz wireless sensor nodes (motes). Each node has a maximum data rate of 250 kbps and is equipped by a sensor board supporting temperature, humidity, barometric pressure, ambient light and acceleration sensors. Rather than inventing a new routing protocol, we have decided to apply Crossbow’s XMesh routing protocol to evaluate its efficiency in such a rough environment. XMesh is a link-quality based dynamic routing protocol that uses periodic Route Update (RU) messages from each node for link quality estimation. Each node listens to the radio traffic in the neighborhood and selects the parent that would be the least costly in terms of transmissions number to reach the base station [8]. Hence, XMesh may be suitable for the particular dynamic and hostile shipboard environments where the link quality between nodes is the most unstable parameter. XMesh may be configured in one of three power modes: High Power (HP), Low Power (LP) and Extended Low Power (ELP). As we are dealing with the problem of network connectivity, we have used the HP mode with motes always powered. This mode allows fixing a minimum value of 0.3 seconds to the period of data transmission by sensor nodes. A huge number of packets are sent by each sensor node during the network test, which simulates an emergency case where a large number of sensors send data frequently and simultaneously to the base station. Moreover, this mode gives a reliable statistical estimation on the links quality and the behavior of nodes with respect to the hostile and dynamic environment.
The deployed WSN is constituted of 25 sensor nodes placed in decks 1, 2 and 3. As stated before, the placement of nodes is based on conclusions drawn from point-to-point measurement campaigns. As hatches are the main radio leakage between rooms (conclusion 6 in section III), we have placed nodes near the doors in each room. Moreover, stairways are the main radio leakage between adjacent decks. Hence, we have placed nodes in the stairway between the control room and the parking. Several nodes have been placed at locations containing real sensors in the tank room, the auxiliary and main engine room and the parking. These nodes will be called peripheral nodes in the reminder of this paper. The gateway node was fixed in the control room in deck 2 and was connected to a laptop via a USB connection. The laptop was running MoteView which is a graphical user interface developed by Crossbow Technology to visualize the real-time sensing data and the network topology evolution.
B. Sensing Data
As mentioned before, Micaz motes are equipped with sensor boards supporting temperature, humidity, barometric pressure, ambient light and acceleration sensors. We present
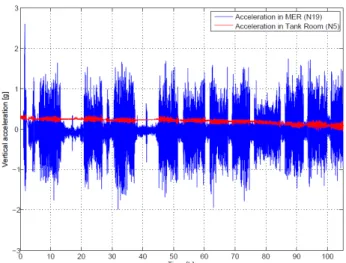
here a data sample obtained from two sensor nodes placed in two different rooms. Fig. 1 shows the evolution of vertical acceleration sensed by node N5 in the tank room and node N19 in the main engine room during the test.
Figure 1. Vertical acceleration in the main engine room (MER) and the tank room
Blue and red curves represent respectively the data measured by node N19 and node N5. Vertical acceleration in the tank room is almost constant during the test. This value presents some small oscillations during sailings corresponding to vertical motion of the ship in the sea. However, the difference between sailings and stopovers is clearer in the main engine room where other sources of oscillations exist. The oscillations of engines (which are turned on only during sailings) lead to the big difference between values of vertical acceleration in the main engine room.
C. Routing Performance
The results of packets statistics have shown that more than 97% of data packets have arrived successfully to the base station. These results reflect a very good reliability of the network and significant routing performance. The results also indicate that the percentages of forwarded packets were high for hatches and stairways nodes. This result was expected as these nodes were placed near to watertight doors and in the stairways, in order to route sensing data coming from rooms. Among these routers, the nodes located in the radio range of the gateway node (critical nodes) have the maximum values of forwarded packets. This is explained by the fact that all sensor nodes must select one of these nodes to forward its data to the base station.
In spite of the significant reliability of XMesh with respect to the transmission ratio, the power consumption does not show the same performance. We expected that power consumption of critical nodes will be clearly greater than that of peripheral nodes. However, the measurements indicate a small difference between power consumptions. These nodes have similar number of originated packets, but critical nodes have forwarded a number of packets 65 times greater than that forwarded by peripheral nodes. Since the transmission and reception are the two main factors that increase the power consumption of a sensor node, critical nodes must have a greater consumption and they will stop working before the peripheral nodes.
Nevertheless, the results indicate slightly larger power consumption and shorter lifetime for critical nodes. This similarity may be explained by the overhearing problem, by which nodes waste energy in receiving all packets that are transmitted in their neighborhood, even if they are intended for others. Another factor may be the small route updates interval time where sensor nodes consume energy in collecting health data about their neighbors. A power control mechanism must be developed in order to enlarge the shipboard WSN lifetime. As sensor nodes send their sensing data mainly via hatches nodes or stairway nodes (critical nodes) and the links established have shown good stability and quality, it will be useful to reduce the route updates frequency to save energy. Moreover, critical nodes supporting a very high traffic may be powered by the mains supply.
D. Selection of Parent Nodes
In a multi-hop routing protocol, a parent node is defined as the node selected by a sensor for the next hop in order to send its data packets to the base station. As previously stated, sensor nodes are preprogrammed by the XMesh routing protocol. Therefore, a sensor node selects the next hop which minimizes the transmissions needed to send a packet to the base station. Hence, the selection of parent nodes is based on the link quality between a sensor node and its neighbor nodes, and the duration of this parent-child connection is based on the link quality. We have compared the parent list of sensor nodes with the conclusions of Section III. Preliminary analysis of the results shows a good agreement between the established parent-child links and the previous conclusions. Hatches and stairway nodes have been often selected as parent nodes for peripheral nodes.
However, “strange links” between some nodes separated by two watertight doors have been detected. The fifth conclusion says that the communication becomes impossible when two watertight doors between the two communicating nodes are closed. Therefore, we have studied the evolution of RSSI of these “strange links” to determine if the two watertight doors were really closed when the links have been established. Fig. 2 shows an example of this case. Node N3 has selected the gateway node N0 as its parent node for 76 % of packets and nodes N1 and N12 for the remaining packets. The establishment of links N3-N1 and N3-N12 is coherent since the two nodes of each link are separated by only one watertight door (which is consistent with the third conclusion given in Section III). However, following the fifth conclusion in Section III, the connection between N3 and N0 is not possible if both the watertight door of the tank room and the door of the control room are closed.
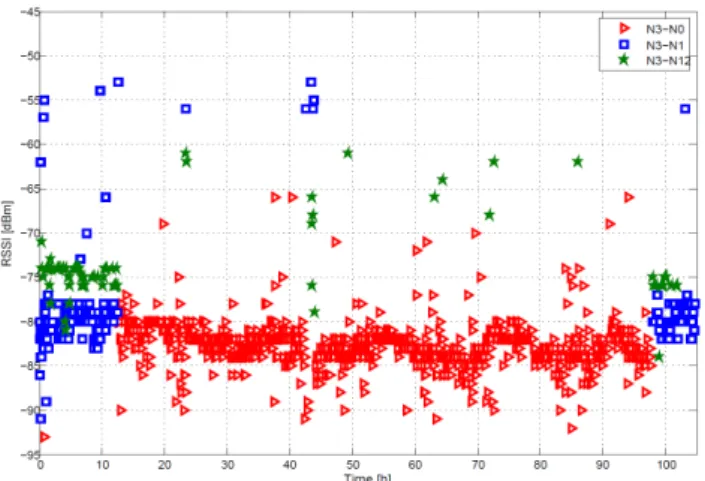
Fig. 3 shows the evolution of RSSI levels between N3 and its parent nodes during the test. It can be seen that N3 has selected N0 as parent node only between instants t = 12 and t = 99 and N1 or N12 for the remaining time. Most of RSSI values of link N3-N1 are grouped around a mean value of -80 dBm. Some values increase to -55 dBm after t = 12. N1 and N3 are separated by one door located in the direct path between them. The gap of 25 dB between the two RSSI levels of link N3-N1 represents the excess path loss due to the closure of this door. Therefore, the RSSI level of N3-N1 can be used as an indicator of the door state (open/closed). Hence, we can simply notice that N3 has switched to N0 when the tank room door was open.
Figure 2. N3 and its parent nodes
The link N3-N0 remains established until t = 100 when the door becomes closed. Therefore, when N0 was the parent node of N3, only one door (control room door) was closed and N3 has switched to N1 or N12 when the second door has been closed. Thus, this result is consistent with the conclusion 5 of Section III. It is also worth mentioning that most of RSSI values of link N3-N0 are grouped around a mean value of -83 dBm and some values increase to -65 dBm. This gap of 18 dB is due to the opening of the control room door which is placed far from the direct path between N3 and N0 (this result is also consistent with the fourth conclusion of Section III). We have followed the same procedure to verify that all links between two nodes separated by two doors were established if at least one door was open.
Figure 3. RSSI vs Time of links between N3 and its parent nodes
E. Link Quality and Link Stability
The analysis of data packets sent by each sensor node also concerns the “retries”, determining the number of times a node had to retransmit a packet due to lack of link-level acknowledgment. This number helps us to estimate the link quality between a sensor node and its parent node, as a percentage of successful transmissions with respect to the number of all transmissions. We have studied the link quality of each sensor node with all its parent nodes. All motes have a mean value of link quality greater than 70%. Critical nodes have a mean value higher than 90%, in spite of the huge traffic that they have supported and the dynamic environment around the control room. Moreover, we have estimated the link stability (LS) of a node as the percentage of parent changes with respect to the total number of node packets. The standard
deviations of RSSI levels of parent-child links were high, which is simply explained by the dynamic behavior of the environment. However, LS is less than 7% for most of nodes, which reflects significant link stability. The reflective walls leading to multiple paths between nodes may explain the stability of links even dynamic link quality fluctuations.
V. CONCLUSION
In this paper, we have investigated the performance of a WSN on board a ferry-type ship. The objectives were to study the effect of realistic circumstances on the network performance and to compare the network behavior with our previous results obtained from propagation studies. The deployed network has been tested under realistic circumstances during five days. The results have shown a significant network reliability and robustness in spite of the dynamic and hostile covered environments. Moreover, the parent nodes selection was consistent with the previous conclusions and the same watertight door attenuation has been found from the values of RSSI. This test has also shown that link-based routing protocols may be a reliable solution for future shipboard WSN. However, some enhancements must be carried out on the power consumption mechanism. The results have indicated good links quality and stability, which allows reducing the frequency of routes updates messages communication. Briefly, we proved in this paper the possibility to reduce the amount of wires of the shipboard monitoring system by using the WSN technology.
ACKNOWLEDGMENT
The authors would like to thank Brittany Ferries and Marinelec Technologies companies for the opportunity of conducting the measurements on board the “Armorique”, and the “Pôle Mer Bretagne” and the Council of Brittany (“Région Bretagne”) for their financial support.
REFERENCES
[1] J. P. Lynch and K. J. Loh, “A summary review of wireless sensors and sensor networks for structural health monitoring”, The Shock and Vibration Digest, 38 (2), pp.91-128, 2006.
[2] P. Bu-Geun, C. Seong-Rak, P. Beom-Jin, L. Dongkon, Y. Jong-Hwui, and B. Byung-Dueg, “Employment of wireless sensor networks for fullscale ship application”, In Proc. Int. Conf. Embedded and Ubiquitous Computing (EUC 2007), pp.113-122, 2007.
[3] T. Pilsak, T. Schröder, J. Eichmann and J. L. ter Haseborg, “Field test of a wireless sensor network inside the engine room of a vessel”, Hamburg University of Technology Institute of Measurement Technology, 2009. [4] H. Kdouh, C. Brousseau, G. Zaharia, G. Grunfelder and G. El Zein,
“Applying of ubiquitous wireless technologies for shipboard monitoring systems”, 14th international symposium on wireless personal multimedia
communication, Brest, France, Oct. 2011 [5] http://www.brittany-feeries.co.uk
[6] H. Kdouh, G. Zaharia, C. Brousseau, G. Grunfelder, G. El Zein, “ZigBee-based sensor network for shipboard environments”, ISSCS Romania, July 2011.
[7] H. Kdouh, C. Brousseau, G. Zaharia, G. Grunfelder and G. El Zein, “Measurements and path loss models for shipboard environments at 2.4 GHz”, European Microwave Conference EuMC 2011, Manchester, UK, 2011.
[8] Memsic Technology, “Xmesh user’s manual”, http://www.memsic.com/support/documentation/w
sensor-networks/category/6-user-manuals
ireless-.html