HAL Id: hal-00951337
https://hal.archives-ouvertes.fr/hal-00951337
Submitted on 24 Feb 2014
HAL is a multi-disciplinary open access
archive for the deposit and dissemination of
sci-entific research documents, whether they are
pub-lished or not. The documents may come from
teaching and research institutions in France or
abroad, or from public or private research centers.
L’archive ouverte pluridisciplinaire HAL, est
destinée au dépôt et à la diffusion de documents
scientifiques de niveau recherche, publiés ou non,
émanant des établissements d’enseignement et de
recherche français ou étrangers, des laboratoires
publics ou privés.
On Improving the Pooling in HDR-VDP-2 towards
Better HDR Perceptual Quality Assessment
Manish Narwaria, Matthieu Perreira da Silva, Patrick Le Callet, Romuald
Pépion
To cite this version:
Manish Narwaria, Matthieu Perreira da Silva, Patrick Le Callet, Romuald Pépion. On Improving
the Pooling in HDR-VDP-2 towards Better HDR Perceptual Quality Assessment. Human Vision and
Electronic Imaging 2014, Feb 2014, San Francisco, United States. pp.1-6. �hal-00951337�
On Improving the Pooling in HDR-VDP-2 towards Better HDR
Perceptual Quality Assessment
Manish Narwaria, Matthieu Perreira Da Silva, Patrick Le Callet, Romuald Pepion
LUNAM University - IRCCyN CNRS UMR 6597, 44306, Nantes, France
ABSTRACT
High Dynamic Range (HDR) signals capture much higher contrasts as compared to the traditional 8-bit low dynamic range (LDR) signals. This is achieved by representing the visual signal via values that are related to the real-world luminance, instead of gamma encoded pixel values which is the case with LDR. Therefore, HDR signals cover a larger luminance range and tend to have more visual appeal. However, due to the higher luminance conditions, the existing methods cannot be directly employed for objective quality assessment of HDR signals. For that reason, the HDR Visual Difference Predictor (HDR-VDP-2) has been proposed. HDR-VDP-2 is primarily a visibility prediction metric i.e. whether the signal distortion is visible to the eye and to what extent. Nevertheless, it also employs a pooling function to compute an overall quality score. This paper focuses on the pooling aspect in HDR-VDP-2 and employs a comprehensive database of HDR images (with their corresponding subjective ratings) to improve the prediction accuracy of HDR-VDP-2. We also discuss and evaluate the existing objective methods and provide a perspective towards better HDR quality assessment.
Keywords: High Dynamic Range (HDR), perceptual quality, HDR-VDP-2
1. INTRODUCTION
High Dynamic Range (HDR) has been gaining popularity in academia and industry in recent times1. The reason is that with HDR we can represent the real physical luminance of a natural scene. As opposed to this, traditional low dynamic range (LDR) content allows limited range due to the limitations of capture and display devices. Therefore, LDR usually defines a white point or the maximum reachable luminance. For example, typical 8-bit representation assumes 255 as the maximum level. This has the consequence of shrinking the actual scene intensities within the defined limits obviously leading to loss of visual details and in turn the perceptual quality. On the other hand, HDR values are related to the scene intensities. Thus, there is a unique white point for each scene and HDR content is often described as scene-referred. Such scene-referred visual signals tend to be visually more appealing as they can represent the dynamic range of the visual stimuli present in the real world. Not surprisingly, the emergence of HDR is seen as an important step towards improving the visual quality of experience (QoE) of the end users.
While HDR imaging offers obvious advantages over the traditional LDR contents in terms of better visual quality of experience (QoE), it comes with the price of much larger storage space requirements as compared to an LDR file. For instance, an HDR image may occupy 4 times the space needed by an LDR version of the same image1. So there is need for research into effective HDR compression schemes and this therefore has been an important research area. A crucial and related issue is that the existing coding architectures have become widely adopted standards supported by almost all software and hardware equipment dealing with digital imaging. As a result, it will be of great interest to design HDR compression schemes that are compatible with existing coding architectures. Not surprisingly, substantial research effort has been put into designing HDR compression systems that are backward compatible2, 3, 4 with the standard image (e.g. JPEG and JPEG 2000) and video coders (e.g. H.264/AVC).
Due to the requirement of backwards-compatibility, HDR compression typically introduces artifacts due to three reasons. First, tone mapping is often exploited to reduce the dynamic range of HDR in a typical backward-compatible HDR compression pipeline. This causes loss of visual details. Second, the compression algorithm (eg. JPEG, MPEG) itself leads to loss of visual quality (eg. JPEG can introduce blockiness). Lastly, the inverse tone mapping is employed to rescale the dynamic range of the compressed bit-stream data. Again, inverse tone mapping being a lossy process can damage the perceptual quality. Thus, the decompressed HDR signal undergoes several processes all of which potentially decrease visual quality. This gives rise to the need of proper validation of perceptual quality in order to provide the end-users with minimum acceptable quality HDR content.
2. BACKROUND
Even though subjective assessment of visual quality remains the 'gold' standard, its deployment is difficult in some situations (eg. real-time HDR compression). Thus, there is obviously a strong need to develop objective computational models that can predict the perceptual quality of HDR signals in an objective manner. Such models will be extremely useful in an HDR processing pipeline for predicting the visual quality of processed HDR images/videos. Unfortunately, the conventional objective visual quality prediction methods do not take into account the luminance range and typically assume that the input pixel values are perceptually uniform. As a result, these cannot be used in case of higher luminance conditions as is usually the case with HDR visual signals. Recently, the HDR-VDP-2 algorithm5 has been proposed. It is an extension of the Visible Differences Predictor (VDP) algorithm. The HDR-VDP-2 uses an approximate model of the human visual system (HVS) derived from new contrast sensitivity measurements. Specifically, a customized contrast sensitivity function (CSF) was employed to cover large luminance range as compared to the conventional CSFs. HDR-VDP-2 is essentially a visibility prediction metric. That is, it provides a 2D map with probabilities of detection at each pixel point and this is obviously related to the perceived quality because a higher detection probability implies a
higher distortion level at the specific point. Nevertheless, in many cases, it is crucial to know an overall quality score
(rather than just the local distortion visibility probability). Pooling is a crucial aspect in converting local error distribution into a single score that denotes the perceptual quality and the human visual system (HVS) can very easily do that accurately. But it is much more difficult to realize that in an objective quality prediction model given the underlying complexities and lack of knowledge of the HVS's pooling mechanisms. It is believed that multiple features jointly affect
the HVS’s perception of visual quality, and their relationship with the overall quality is possibly nonlinear and difficult
to be determined apriori. Therefore, the approach that HDR-VDP- takes is that finding the pooling parameters via
optimization of correlation with subjective scores.
In its original implementation, the authors of HDR-VDP-2 tried over 20 different combinations of aggregating (or pooling) functions. These included maximum value, percentiles (50, 75, 95) and a range of power means (normalized Minkowski summation) with the exponent ranging from 0.5 to 16. The aim was to maximize the value of Spearman's correlation coefficient in order to find the best pooling function and its parameters. While HDR-VDP-2 is fairly comprehensive method for HDR quality assessment, there is an issue with regards to pooling in HDR-VDP-2. This is related to parameter optimization. That is, the parameters of the pooling function in HDR-VDP-2 were found by maximizing (optimizing) correlation using existing LDR image databases. Therefore, its effectiveness in predicting the visual quality of HDR images is questionable given the different characteristics LDR and HDR images especially in terms of distortion visibility and overall visual appeal. To address that, we propose to compute the pooling parameters via optimization using HDR content. In the following, we first describe the development of a comprehensive HDR database and use it for parameter optimization.
3. SUBJECTIVE DATABASE FOR HDR VISUAL QUALITY
In this section, we will give a brief description of how we developed the HDR quality database. This will be used important for parameter optimization in HDR-VDP-2 as explained in the next section. Further, the HDR database will be the test bed for evaluating and comparing the performances of objective quality prediction methods. For developing the HDR database, we considered a total of 10 reference HDR scenes and two types of distortions: JPEG and JPEG 2000 compression artifacts. To our knowledge, our efforts are amongst the first ones to introduce a comprehensive HDR image database with subjective scores. This will be of immense value to the research community given the lack of publicly available databases for HDR content quality evaluation.
3.1 Test Material Preparation
First, we generated the HDR stimuli with JPEG distortions. For that we chose 10 reference (i.e. undistorted) HDR scenes, 7 compression bit rates so that the resulting visual quality covers the entire range i.e. from excellent (rating 5) to bad (rating 1). Since HDR compression involves tone mapping operator (TMO), we employed the image color appearance model iCAM06 algorithm8. Also, two optimization criteria were used. As a result, we obtained a total of 140 compressed HDR images (10 reference images × 1 TMO × 2 optimization criterion × 7 bit rates). With the inclusion of 10 reference scenes, we have a total of 150 images, i.e. 150 conditions = 10 reference images × 15 conditions per reference image, to be evaluated by subjects. The keen reader is also referred to our previous work18 for further details.
For JPEG 2000 distorted content, we chose 6 reference HDR scenes. In this case, we selected 5 TMOs: 3 local and 2 global ones. The local TMOs include the ones proposed by Ashikmin9, Reinhard10 and Durand11. For global TMOs, we chose the logarithmic TMO and the global version of the TMO proposed by Reinhard. Seven bit rates were chosen such that the resulting visual quality covers the entire range i.e. from excellent (rating 5) to bad (rating 1). As a result, we obtained a total of 210 decompressed HDR images (6 reference scenes × 5 TMOs × 7 bit rates). With the inclusion of the 6 reference scenes, we obtained a total of 216 still HDR images, i.e. 216 conditions = 6 reference scenes × 36 conditions per reference image, to be evaluated by subjects.
3.2 Subjective Testing
Observers were seated in a standardized room conforming to the International Telecommunication Union
Recommendation (ITU-R) BT500-13 recommendations12. For displaying the HDR images, SIM2 HDR47E S 4K
display13 was used. The HDR47E S 4K is a 47-inch, 1080p LCD TV with maximum displayable luminance of 4000
cd/m². The viewing distance was set to three times the height of the screen (active part), that is approximately 178 cm
and the room illumination was set to 130cd/m².
For rating the decompressed HDR images, we adopted the absolute category rating with hidden reference (ACR-HR) which is one of the rating methods recommended by the International Telecommunication Union (ITU) in Rec. ITU-T P.91014. For rating overall quality, a five-level scale is used: 5 (Excellent), 4 (Good), 3 (Fair), 2 (Poor) and 1 (Bad). A total of 27 observers (16 males and 11 females) were employed for JPEG while 29 observers (14 males and 15 females) subjectively evaluated the visual quality for the case of JPEG 2000. All observers naive (not expert in image or video processing) for the purpose of the study. We also employed post-experiment screening of the subjects in order to reject any outliers in accordance with the Video Quality Experts Group (VQEG) multimedia test plan15. Analysis per processed image and per source (i.e. reference) image was performed and in our case, none of the observers was rejected. The mean opinion score (MOS) for each stimuli was obtained by averaging the scores for that stimuli from all the observers. The keen reader is also referred to our previous works18, 19 for further details on the test material preparation and the subjective experiments.
4. IMPROVING QUALITY PREDICTION WITH HDR-VDP-2
In this section, we first give brief and relevant details of HDR-VDP-2. Then, we will outline the method to improve prediction performance based on optimization with HDR content.
4.1 Brief review of HDR-VDP-2
The HDR Visual Difference Predictor (HDR-VDP-2) algorithm is primarily designed for predicting the visibility of distortions in HDR images. To that end, HDR-VDP-2 provides a 2D map with probabilities of detection at each point and this is obviously related to the perceived quality because a higher detection probability suggests a higher distortion level at the specific point. Nevertheless, as an extension to provide an overall quality score, HDR-VDP-2 also employs pooling strategy so that the detected features can be pooled (fused) into a single number that denotes the overall quality scores for the image. Towards that end, the authors of HDR-VDP-2 tried over 20 different combinations of aggregating (or pooling) functions5. These included maximum value, percentiles (50, 75, 95) and a range of power means (normalized Minkowski summation) with the exponent ranging from 0.5 to 16. The aim was to maximize the value of the Spearman's correlation coefficient in order to find the best pooling function and its parameters. The resulting expression to predict quality score Q was defined as:
F f O o I i f D f o i I w O F Q 1 1 1 2 ) ]( , [ 1 log . 1
(1) where i is the pixel index, = 10-5 is a constant to avoid singularities when D is close to 0, and f, o are respectively thespatial frequency band and orientation indices of the steerable pyramid. I is the total number of pixels and the per-band weighting
w
f was found by maximizing the correlation with an LDR image quality database.4.2 Improved Optimization of Pooling in HDR-VDP-2
As mentioned, the per-band weighing wfwas obtained by optimizing with an LDR database. This is problematic because the characteristics of LDR content are different from those of HDR especially with regards to perceptual quality. More specifically, the influence of spatial frequencies on the perceptual quality can be different in HDR and LDR.
Consequently, it is necessary to find the per-band weighting using HDR content. To that end, we employed JPEG compressed HDR images and their corresponding ratings. Because the subjective ratings and the HDR-VDP-2 predictions are not in the same range, a logistic mapping function of the following form was employed before computing the RMSE: 4 3 2 1 )) ( exp( 1 1 2 1 Q Ql (2)
where Q denotes the objective score and Qlrepresents the logistically transformed value and 14 are the parameters of the logistic curve.
Let k l
Q, and k
S denote the logistically transformed HDR-VDP-2 score and the subjective score for the kth image and assume there are N images. The function to be minimized can be obtained as
N k k k l wf 1 Q S 2 , min (3)To solve for wf by minimizing the above function, we employed the Nelder-Mead simplex algorithm6 which is widely used for minimizing real-valued functions. The Nelder-Mead method attempts to minimize a scalar-valued nonlinear function of n real variables using only function values, without any derivative information (explicit or implicit). It maintains at each step a nondegenerate simplex, a geometric figure in n dimensions of nonzero volume that is the convex hull of n + 1 vertices. Each iteration of a simplex-based direct search method begins with a simplex, specified by its n + 1 vertices and the associated function values6. One or more test points are computed, along with their function values, and the iteration terminates with bounded level sets. The optimized weights wfobtained were then used to predict the quality scores for JPEG 2000 compressed images. Therefore, the content employed for optimization is different from the testing set. Note that there are a total of 216 HDR images for this condition. Another reason for using these sets of images for performance evaluation is related to their processing. Recall that the database for JPEG 2000 compressed HDR images the perceptual quality is not only affected by the compression rate but also depends on five tone mapping operators.
5. PERFORMANCE EVALUATION ON HDR DATABASE
Even though HDR-VDP-2 employs the pooling function in (1) to predict quality, to our knowledge, it has not been evaluated on a comprehensive set of distorted HDR images with MOSs since the original HDR-VDP-2 paper was more focused on visibility predictions rather than overall quality assessment. In fact, the quality prediction performance was tested only on a set of LDR images (from TID2008 database7). Hence, it will be interesting to assess the performance of HDR-VDP-2 for quality prediction of HDR images and examine its effectiveness for the task of prediction (which is not entirely the same as detection). As mentioned, currently there is no publicly available HDR database with subjective quality ratings. Thus, the performance of HDR-VDP-2 and even conventional LDR metrics has not been evaluated with
HDR content except our previous study18 in which we evaluated the performance for JPEG compressed HDR images. In
this paper, we further validate the performance of objective methods on HDR images affected by JPEG 2000 compression errors as well as distortions due to tone mapping.
5.1 Qualitative analysis
The experimental results are reported in terms of four criteria commonly used for performance comparison, namely: the Pearson linear correlation coefficient CP (for prediction accuracy), the Spearman rank order correlation coefficient CS
(for monotonicity), the Kendall rank correlation coefficient CK and the Root Mean Squared Error (RMSE) between the
MOS and the objective predictions. For a perfect match between the objective and subjective scores, CP = CS = CK = 1
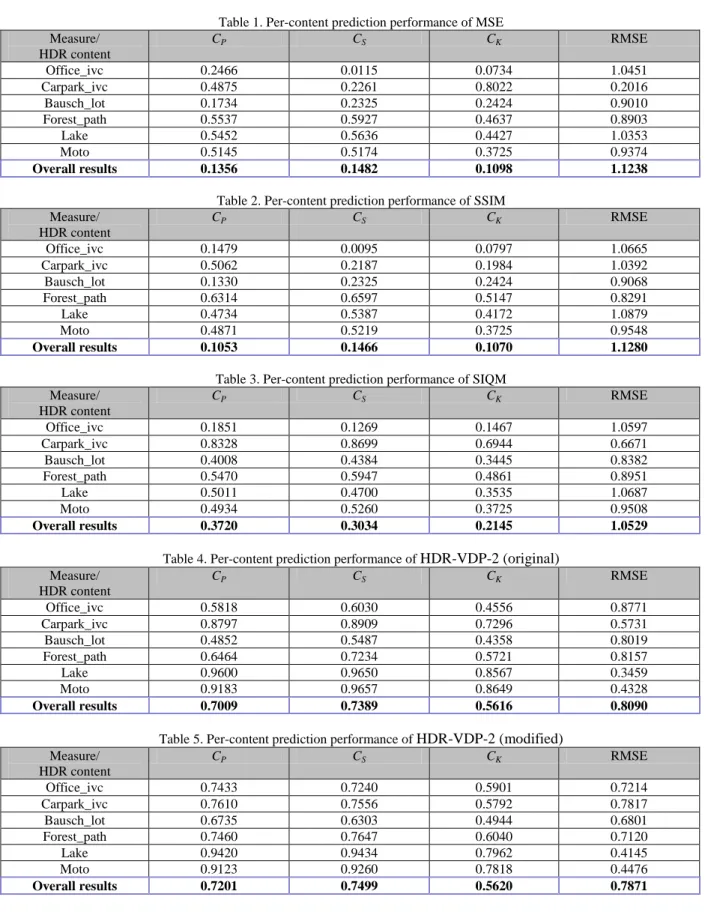
and RMSE=0.We not only evaluate the overall prediction accuracies but also report the results for two cases: (a) per-content prediction accuracy, (b) accuracy based on tone mapping operator (TMO). The former provides more information on how different objective methods perform for different content while the latter gives insights into method performance for predicting quality affected by TMO. In this paper, we considered 3 LDR objective methods namely Mean Squared Error (MSE), Structural Similarity Index Measure (SSIM) 16 and the scalable image quality measure (SIQM) 17.
Table 1. Per-content prediction performance of MSE Measure/ HDR content CP CS CK RMSE Office_ivc 0.2466 0.0115 0.0734 1.0451 Carpark_ivc 0.4875 0.2261 0.8022 0.2016 Bausch_lot 0.1734 0.2325 0.2424 0.9010 Forest_path 0.5537 0.5927 0.4637 0.8903 Lake 0.5452 0.5636 0.4427 1.0353 Moto 0.5145 0.5174 0.3725 0.9374 Overall results 0.1356 0.1482 0.1098 1.1238
Table 2. Per-content prediction performance of SSIM
Measure/ HDR content CP CS CK RMSE Office_ivc 0.1479 0.0095 0.0797 1.0665 Carpark_ivc 0.5062 0.2187 0.1984 1.0392 Bausch_lot 0.1330 0.2325 0.2424 0.9068 Forest_path 0.6314 0.6597 0.5147 0.8291 Lake 0.4734 0.5387 0.4172 1.0879 Moto 0.4871 0.5219 0.3725 0.9548 Overall results 0.1053 0.1466 0.1070 1.1280
Table 3. Per-content prediction performance of SIQM Measure/ HDR content CP CS CK RMSE Office_ivc 0.1851 0.1269 0.1467 1.0597 Carpark_ivc 0.8328 0.8699 0.6944 0.6671 Bausch_lot 0.4008 0.4384 0.3445 0.8382 Forest_path 0.5470 0.5947 0.4861 0.8951 Lake 0.5011 0.4700 0.3535 1.0687 Moto 0.4934 0.5260 0.3725 0.9508 Overall results 0.3720 0.3034 0.2145 1.0529
Table 4. Per-content prediction performance of HDR-VDP-2 (original)
Measure/ HDR content CP CS CK RMSE Office_ivc 0.5818 0.6030 0.4556 0.8771 Carpark_ivc 0.8797 0.8909 0.7296 0.5731 Bausch_lot 0.4852 0.5487 0.4358 0.8019 Forest_path 0.6464 0.7234 0.5721 0.8157 Lake 0.9600 0.9650 0.8567 0.3459 Moto 0.9183 0.9657 0.8649 0.4328 Overall results 0.7009 0.7389 0.5616 0.8090
Table 5. Per-content prediction performance of HDR-VDP-2 (modified)
Measure/ HDR content CP CS CK RMSE Office_ivc 0.7433 0.7240 0.5901 0.7214 Carpark_ivc 0.7610 0.7556 0.5792 0.7817 Bausch_lot 0.6735 0.6303 0.4944 0.6801 Forest_path 0.7460 0.7647 0.6040 0.7120 Lake 0.9420 0.9434 0.7962 0.4145 Moto 0.9123 0.9260 0.7818 0.4476 Overall results 0.7201 0.7499 0.5620 0.7871
Table 6. Prediction performance of MSE for each TMO Measure/ TMO CP CS CK RMSE Ashikmin 0.3297 0.5701 0.4450 1.0990 Durand 0.2531 0.3261 0.2509 0.9215 Log 0.1451 0.0811 0.0900 0.9459 Reinhard_global 0.3918 0.1878 0.0550 1.0566 Reinhard_local 0.4502 0.2530 0.2144 0.7443
Table 7. Prediction performance of SSIM for each TMO Measure/ TMO CP CS CK RMSE Ashikmin 0.3050 0.5962 0.4776 1.1087 Durand 0.3532 0.3678 0.2836 0.8911 Log 0.1952 0.1171 0.1110 0.9378 Reinhard_global 0.4103 0.1916 0.0713 1.0474 Reinhard_local 0.0383 0.2177 0.1888 0.8330
Table 8. Prediction performance of SIQM for each TMO Measure/ TMO CP CS CK RMSE Ashikmin 0.7311 0.7140 0.5545 0.7942 Durand 0.6864 0.5548 0.4773 0.6926 Log 0.4757 0.4500 0.3540 0.8409 Reinhard_global 0.3134 0.0507 0.0971 1.0906 Reinhard_local 0.3228 0.1730 0.1344 0.7890
Table 9. Prediction performance of HDR-VDP-2 (original) for each TMO Measure/ TMO CP CS CK RMSE Ashikmin 0.7677 0.7777 0.6104 0.7460 Durand 0.6192 0.7025 0.5519 0.7479 Log 0.7624 0.7919 0.6157 0.6187 Reinhard_global 0.8112 0.8197 0.6655 0.6716 Reinhard_local 0.7635 0.7835 0.6240 0.5384
Table 10. Prediction performance of HDR-VDP-2 (modified) for each TMO Measure/ TMO CP CS CK RMSE Ashikmin 0.8029 0.7832 0.6174 0.6940 Durand 0.5805 0.6414 0.4726 0.7755 Log 0.8390 0.8543 0.6717 0.5202 Reinhard_global 0.7905 0.8105 0.6515 0.7034 Reinhard_local 0.6665 0.6339 0.4704 0.6215
For HDR methods, we evaluated the HDR-VDP-2 with original parameter values and the modified values based on optimization with HDR content via (3). These cases are respectively denoted as 2 (original) and HDR-VDP-2 (modified). The results for the per-content evaluation are given in Tables 1-5 from which we can make the following observations:
1. The overall prediction performance of the three LDR methods is very poor as compared to the two version of HDR-VDP-2 with SIQM performing the best. Such poor performance of LDR methods is however not entirely unexpected. This is because these methods typically assume perceptually scaled pixel value representation of the image signal. But with HDR, the pixels values are represented in terms of physical luminance values. Another possible reason for such poor performance is related to the high luminance conditions with HDR. Consequently, more distortions might be visible on an HDR display as compared to conventional LDR
displays. This in effect can reduce the effectiveness of contrast sensitivity models that LDR methods in general might directly or indirectly employ (of course MSE does not use such models).
2. While the LDR methods perform quite poorly, their best performance occurs for ‘Forest_path’ content. As explained in our previous work19, the subjective ratings for this scene processed by the five TMOs were quite close. That is, despite the scene being processed by different TMOs, the resultant HDR qualities were judged
by subjects as being quite close. We attributed this to the fact that the scene ‘Forest_path’ has mainly bright
regions and so the TMOs yield very similar visual qualities. This can also be used to explain why LDR methods perform the best for this scene. Because of the absence of very dark regions, the overall luminance is spread in a more uniform manner. Therefore, this is more similar to an LDR content but with brighter luminance leading to better quality prediction by LDR methods.
3. The two versions of HDR-VDP-2 perform much better than all the three LDR methods. The proposed optimization indeed improves the overall performance of HDR-VDP-2. However, the improvement is not statistically significant as verified in the next section. We suspect that the performance can be further improved by calibration of other HDR-VDP-2 parameters (other than pooling ones like the peak sensitivity parameter5).
Further evaluation results for each TMO are reported in Tables 5-10. One can notice improvement in the prediction performance for each TMO. The biggest improvement is for SIQM which in some cases performs closer to VDP-2. On the other hand, the performance of VDP-2 (both versions) is similar to the per-content case. However, HDR-VDP-2 (modified) is still overall better although the performance is degraded for Reinhard_local TMO. The marked improvement in case of LDR methods indicates that within the same distortion (we can assume that each TMO is a source of distortion), LDR methods can predict quality more reliably. But with a more complex scenario (images processed by different TMOs), the performance of LDR methods starts to degrade rapidly. Overall, HDR-VDP-2 and its modified version clearly outperform the LDR methods.
5.2 Statistical analysis
In this section, we evaluate the statistical significance of the overall prediction performance of different objective methods. To that end, an F-test20 was performed on the prediction residuals between the objective predictions (after applying the logistic mapping) and the subjective scores. The test is based on an assumption of Gaussianity of the residual differences. Therefore, we first need to check if the residuals can be assumed to be Gaussian or not. For that, we used the Kolmogorov-Smirnov (KS) test21,22 and Table 11 lists the results and the corresponding test statistics. The critical value which is computed based on the number of residuals (in this case 216) was 0.0916. For determining normality, the KS test compares the test statistic with the critical value and a smaller test statistic value (as compared to the critical value ) implies normality. In Table 11, 0 for the KS test implies that the null hypothesis cannot be rejected at 5% significance level and therefore implies normality. One finds the residuals SIQM and the two HDR-VDP-2 versions are normally distributed. However, the test statistic of the remaining residuals is also not too large as compared to the critical value. This means that those residuals (from MSE and SSIM) can be taken to be approximately Gaussian. This was further confirmed by the skewness and kurtosis values which are also reported in Table 11. Since the Gaussian distribution has K value of 3, commonly, K values between 2 – 4 can be deemed Gaussian approximately. Further given that S = 0 for normal distribution, we could assume approximate normality if S values are close to 0. We therefore find that the assumption of Gaussianity of residuals of all the five objective methods holds (or nearly holds). Assuming that 2 MSE , 2 SSIM
, 2 SIQM , 2 ) ( 2 orginal VDPP HDR ,and 2 ) ( 2 modified VDPP HDR denote the variances of the residuals from the respective
objective quality assessment algorithms, a measure known as the F-value can be defined as 2 1 2 2 Method Method F
where Method2 1 and 2
2
Method
denote the variances of the residuals from the two objective methods which need to be compared. The F valueis then compared with a critical value denoted as critical
F to establish statistical difference between the two methods. Fcritical is computed based on the number of residuals and the desired confidence level. Table 12 summarizes the implications of different ranges of F values.
Table 11. Test of normality for the residuals (difference between logistically transformed objective predictions and MOSs) from the 5 methods namely MSE, SSIM, SIQM, HDR-VDP-2 (original) and HDR-VDP-2 (modified). '0' implies that the null hypothesis cannot
be rejected at 5% significance level and implies normality while '1' denotes the opposite case.
MSE SSIM SIQM HDR-VDP-2
(original) HDR-VDP-2 (modified) KS test (0/1) 1 1 0 0 0 Test statistic 0.1226 0.1301 0.0881 0.0893 0.0811 Skewness -0.4676 -0.4783 -0.5728 -0.4811 -0.3090 Kurtosis 2.0666 2.0585 2.3360 2.9551 2.8186
Table 12. Interpretation of F-values
2 1 2 2 Method Method F
for the F-test to ascertain statistical significance
critical F
F 1FFcritical 1 F1
Fcritical Fcritical
F 1
Method2 has significantly larger residuals than Method1, so Method1 is
statistically better than Method1.
Since F > 1 Method1 performs better than Method2 but both
are statistically indistinguishable because
critical F
F .
Since F < 1 Method2 performs better than Method1 but both
are statistically indistinguishable because
critical
F F 1 .
Method2 has significantly smaller residuals than Method1, so Method1 is
statistically worse than Method2.
Table 13. F-test result for the four objective methods. The F values
2 1 2 2 Method Method F
are computed such that the method in each row is 'Method1' while the method in each column denotes 'Method2'. The boldface values imply statistically significant difference
between the two objective methods.
MSE SSIM SIQM HDR-VDP-2
(original) HDR-VDP-2 (modified) MSE
1.0074 0.8778 0.5183 0.4905 SSIM 0.9926
0.8713 0.5144 0.4869 SIQM 1.1392 1.1477
0.5904 0.5588 HDR-VDP-2 (original) 1.9295 1.9439 1.6937
0.9465 HDR-VDP-2 (modified) 2.0386 2.0538 1.7895 1.0565
In Table 13, we present the F-values when comparing two objective methods. In this table, the
2 1 2 2 Method Method F values are
computed such that the method indicated in each row is Method1 while the one in the column is Method2. With 216 residuals and 95% confidence level we have
critical
F = 1.25 and
critical F
1 = 0.8000. Keeping in mind the implications of the F values as compared to
critical
F (refer to Table 12), we can see from Table 13 that HDR-VDP-2 (original) and HDR-VDP-2
(modified) are statistically better than the LDR methods. Moreover, the three LDR methods lead to statistically indistinguishable performances. This once again confirms with statistical evidence that LDR methods cannot be used for HDR visual quality measurement. The statistical results also reveal that the wo HDR-VDP-2 versions are statically indistinguishable but HDR-VDP-2 (modified) performs better overall (F > 1). This has been highlighted in Table VII by bold-face F values for the corresponding cases. On the other hand, all the LDR based methods SIQM, SSIM and MSE are statistically indistinguishable from each other.
6. CONCLUSIONS
This paper has dealt with HDR visual quality assessment evaluation both from subjective and objective viewpoints. To that end, we first introduced an HDR database with JPEG and JPEG 2000 compression distortion as well as TMO induced distortions. We then used the HDR database for improving the prediction performance of HDR-VDP-2 by finding better pooling parameters. This was done by minimizing the error between the logistically transformed predicted
values and the subjective ratings. The performance of three LDR methods namely MSE, SSIM and SIQM and the two versions of HDR-VDP-2 was evaluated on a set of 216 HDR images. The use of HDR images for parameter optimization lead to an overall better performance. We also expect that calibration of several other parameters in HDR-VDP-2 (eg. parameters controlling the peak sensitivity, visual contrast masking) with the HDR database will improve the prediction accuracy of HDR-VDP-2 further.
ACKNOWLEDGMENT
This work has been supported by NEVEx project FUI11 which is an FUI (Fond Unique Interministériel) financed project recognized by the Images & réseaux cluster.
REFERENCES
[1] Banterle F, Artusi A, Debattista K, Chalmers A. Advanced High Dynamic Range Imaging: Theory and Practice. ISBN: 978-156881-719-4, AK Peters (CRC Press), Natrick, MA, USA.
[2] Ward G. and Simmons M. JPEG-HDR: A Backwards-Compatible High Dynamic Range Extension to JPEG, In: ACM SIGGRAPH 2006 Courses, Article no. 3, 2006.
[3] Sugiyama N., Kaida H., Xue X., Jinno T., Adami N. and Okuda M. HDR Compression Using Optimized Tone Mapping Model. In: Proceedings of International Conference on Acoustics, Speech and Signal Processing (ICASSP), 2009.
[4] Mantiuk R., Efremov A., Myszkowski K. and Seidel H. Backward Compatible High Dynamic Range MPEG Video Compression. In: ACM Transactions on Graphics 25 (3), 2006.
[5] Mantiuk R., Jim K., Rempel A. and Heidrich W. HDR-VDP-2: A Calibrated Visual Metric for Visibility and Quality Predictions in All Luminance Conditions. In: ACM Transactions on Graphics 30 (4), 2011.
[6] J Lagarias, J. Reeds, M. Wright and P. Wright. Convergence Properties of the Nelder-Mead Simplex Method in Low Dimensions. In: SIAM J. Opt., 9(1), 1998.
[7] Ponomarenko N., Lukin V., Zelensky A., Egiazarian K., Carli M., Battisti F. TID2008 - A Database for Evaluation of Full-Reference Visual Quality Assessment Metrics. In: Advances of Modern Radioelectronics, Vol. 10, pp. 30-45, 2009.
[8] Kuang, J., Johnson, G.M., Fairchild M.D. iCAM06: A refined image appearance model for HDR image rendering. J. Visual Communication and Image Representation 18(5): 406-414 (2007).
[9] Ashikhmin M. A tone mapping algorithm for high contrast images. In: 13th eurographics workshop on rendering. Eurographics Association; 2002. p. 145–56.
[10] Reinhard E, Stark M, Shirley P, Ferwerda J. Photographic tone reproduction for digital images. In: Proceedings of the 29th annual conference on computer graphics and interactive techniques. ACM Press; 2002. p. 267–76.
[11] Durand F, Dorsey J. Fast bilateral filtering for the display of high-dynamic range images. In: Proceedings of the 29th annual conference on computer graphics and interactive techniques. New York, NY, USA: ACM Press; 2002. p. 257–66.
[12] Recommendation ITU-R BT.500-13. Methodology for the subjective assessment of the quality of television pictures. 2012. [13] http://www.sim2.com/HDR/
[14] ITU-T Recommendation P.910. Subjective video quality assessment methods for multimedia applications. 2008. [15] Hands D. and Brunnstrom K. Video Quality Experts Group (VQEG) Multimedia Group Test Plan, Version 1.21, 2008.
[16] Wang Z., Bovik A., Sheikh H., and Simoncelli E. Image quality assessment: From error visibility to structural similarity. In: IEEE Trans. Image Process., 13(4) 2004.
[17] Narwaria M., Lin W., McLoughlin I., Emmanuel S. and C. Tien. Fourier Transform Based Scalable Image Quality Measure. In: IEEE Transactions on Image Processing, 21(8), 2012.
[18] Narwaria M., Silva M., Callet P. and Pepion R. Tone mapping Based High Dynamic Range Image Compression: Study of Optimization Criterion and Perceptual Quality. In: Optical Engineering 52(10), 2013.
[19] Narwaria M., Silva M., Callet P. and Pepion R. Impact of Tone Mapping in High Dynamic Range Image Compression: In: Proc. of Eighth International Workshop on Video Processing and Quality Metrics, 2014.
[20] Montgomery D. and Runger G. Applied Statistics and Probability for Engineers. New York: Wiley-Interscience, 1999.
[21] F. Massey. The Kolmogorov-Smirnov Test for Goodness of Fit. In: Journal of the American Statistical Association. 46(253), pp. 68–78, 1951.
[22] Marsaglia, G., W. Tsang, and J. Wang. Evaluating Kolmogorov's Distribution. In: Journal of Statistical Software. 8(18), 2003.