HAL Id: inserm-00669624
https://www.hal.inserm.fr/inserm-00669624v2
Submitted on 24 Sep 2018
HAL is a multi-disciplinary open access
archive for the deposit and dissemination of
sci-entific research documents, whether they are
pub-lished or not. The documents may come from
teaching and research institutions in France or
abroad, or from public or private research centers.
L’archive ouverte pluridisciplinaire HAL, est
destinée au dépôt et à la diffusion de documents
scientifiques de niveau recherche, publiés ou non,
émanant des établissements d’enseignement et de
recherche français ou étrangers, des laboratoires
publics ou privés.
Classification of surgical processes using dynamic time
warping
Germain Forestier, Florent Lalys, Laurent Riffaud, Brivael Trelhu, Pierre
Jannin
To cite this version:
Germain Forestier, Florent Lalys, Laurent Riffaud, Brivael Trelhu, Pierre Jannin. Classification of
surgical processes using dynamic time warping. Journal of Biomedical Informatics, Elsevier, 2012, 45
(2), pp.255-264. �10.1016/j.jbi.2011.11.002�. �inserm-00669624v2�
Classification of surgical processes using dynamic time warping
Germain Forestier, Florent Lalys, Laurent Riffaud, Brivael Trelhu, Pierre JanninINSERM / INRIA / CNRS / Univ. Rennes 1, VISAGES U746, Rennes, France
Abstract
In the creation of new computer-assisted intervention systems, Surgical Process Models (SPMs) are an emerging concept used for analyzing and assessing surgical interventions. SPMs represent Surgical Processes (SPs) which are formalized as symbolic structured descriptions of surgical interventions using a pre-defined level of granularity and a dedicated terminology. In this context, one major challenge is the creation of new metrics for the comparison and the evaluation of SPs. Thus, correlations between these metrics and pre-operative data are used to classify surgeries and highlight specific information on the surgery itself and on the surgeon, such as his/her level of expertise. In this paper, we explore the automatic classification of a set of SPs based on the Dynamic Time Warping (DTW) algorithm. DTW is used to compute a similarity measure between two SPs that focuses on the different types of activities performed during surgery and their sequencing, by minimizing time differences. Indeed, it turns out to be a complementary approach to the classical methods that only focus on differences in the time and the number of activities. Experiments were carried out on 24 lumbar disc herniation surgeries to discriminate the surgeons level of expertise according to a prior classification of SPs. Supervised and unsupervised classification experiments have shown that this approach was able to automatically identify groups of surgeons according to their level of expertise (senior and junior), and opens many perspectives for the creation of new metrics for comparing and evaluating surgeries.
Keywords:
surgical process models, classification, clustering, dynamic time warping, surgery evaluation
This is the author’s version of an article published in the Journal of Biomedical Informatics. The final authenticated version is available online at: http://dx.doi.org/10.1016/j.jbi.2011.11.002.
1. Introduction
The analysis and modeling of surgical procedures has recently emerged in the medical engineering field. Surgical procedures can be broken down into four main levels of granularity, from high to low [1]: phases, steps, tasks and motions. A surgical intervention can be described using a formal and structured language to create a Surgical Process (SP) at a fixed granularity level. Thus, Surgical Process Models (SPMs) are used to study, evaluate and analyze surgical activities in the Operating Room (OR). In this field, a recent and important challenge has been the design of new methods to compare and group similar SPs in order to identify relevant patterns that can be correlated with other pre-operative data in order to highlight specific infor-mation on the surgery. The main issue in such analysis is the definition of similarity metrics between SPs that reveal objective and quantitative differences at every granularity level of the surgical procedure. Indeed, SPs from the same intervention type can have high variability, which can be caused by many parameters such as the different operating techniques, the intrinsic difficulty of the surgical procedure or the surgeons expertise. Consequently, similarity mea-sures have to be designed to accurately assess the similarity
between SPs according to their content (i.e. the different activities performed by the surgeon) and their sequencing (i.e. the order in which the activities are performed).
In a recent work, Riffaud et al. [2] computed similarity metrics and performed statistical analysis for comparing groups of senior and junior surgeons (i.e. experienced and inexperienced surgeons). The metrics used were (i) General parameters of the procedure: the operating time for the whole procedure and for each step, (ii) General parameters of the surgeons activity: the number of activities performed with either the right or the left hand and the number of changes in microscope position, (iii) Specific parameters of the surgeons activity: all the gestures performed by the surgeon, the instruments used and the anatomical structure treated. Some of these metrics were found to be statistically different in a significant way when comparing the junior and senior groups. These metrics are of interest but provide no clues as to differences in terms of sequentiality. If the exact same activities were performed in a random order, the evaluation would have been the same. Consequently, in this paper we have introduced a new approach by exploring the use of the Dynamic Time Warping (DTW) [3] algorithm to evaluate similarities between SPs. DTW is used to measure the similarity between two sequences which may vary in time or speed. As SPs have been acquired in different environments, they can easily vary in time, which makes
DTW particularly suitable for comparing SPs. Using DTW to compare SPs allows us to focus on the sequencing of the activities comprising the SPs. Indeed, DTW makes it possible to reduce the importance of time variations in the comparison and to focus on the number of activities and their organization in the timeline of the surgery.
Using this similarity metric, we addressed the problem of the automatic classification of SPs in supervised and unsupervised ways. We focused our evaluation on the correlation between automatic classification and the sur-geons level of expertise. We present experiments using 24 SPs in lumbar disc herniation surgery, half of which were performed by senior surgeons and half by junior surgeons. Evaluation studies shown that our approach was able to automatically identify these two clusters of surgeons based on the comparison of the SPs using DTW. Furthermore, our approach was also able to go further by identifying sub-clusters of surgeons.
This kind of application is of great importance to iden-tify and understand surgical behaviors. Indeed, one of the important challenges is to understand the parameters that influence the way surgery is performed. The goal is to better understand the practice of surgery and to pro-vide significant feedbacks to surgeons before, during and after the intervention. The work presented in this paper highlights a significant application in surgical behaviors identification, and open many perspectives in this field.
The paper is organized as follows: in Section 2, we present work related to SP processing and surgery similarity metrics. In Section3, we present the proposed approach and formalize the classification of SPs. In Section 4, we present several experiments which highlight the relevance of the proposed method. Lastly, in Section5we present a discussion and Section 6concludes the paper.
2. Related work
Given the advent of the latest technologies in the Oper-ating Room (OR), an important need has emerged for tools to assess and evaluate the impact of these new technolo-gies. Within this field, the development of new methods for objective surgical skill evaluation is an important issue [4,5]. Surgical skills can be assessed based on five factors: knowledge, decision making, technical skills, communica-tion skills and leadership skills. From these five factors, many studies have been conducted for developing objective methods of technical skill evaluation. A comprehensive review can be found in [6].
One approach to surgical skills evaluation [7] is to con-sider the patient’s outcome in assessing surgeons. Unfortu-nately, this metric is highly variable and dependent upon the patients specific characteristics. Additionally, patient outcome is usually a multi-factor criterion requiring long term follow-up. Even if outcome-based metrics are straight-forward to use, they are not objective enough and they do not study the differences in the surgical procedure in detail. Another approach uses human grading techniques. The
underlying idea is to ask to a senior surgeon to provide an evaluation rating scale using dedicated check-lists during the observation of an intervention. Several scores have been proposed: Objective Structured Assessment of Technical Skills (OSATS) [8], Objective Structured Clinical Exam-inations (OSCE) [9], and the Global Rating Scale (GRS) [10] have shown good results. However, this method has proven to be very time-consuming and also very observer-dependant. Motion has also been investigated to analyze dexterity by tracking the surgeon’s hand [11], arm [12], and instruments [13], using various and complementary tracking systems [14] or in the context of robotic assistance [15]. This work has focused on motion pattern analysis, for instance using time series analysis of the different motions. The main drawback of such approaches is their low level of granularity, which does not give insight into the surgical scenario followed.
Lastly, on-line and off-line recordings of surgeries have been of growing interest for analyzing procedures and as-sessing surgeons. Recordings can be performed using sensor devices or directly by an observer. This data extraction process can be supported by two level of knowledge: activ-ity recording can be performed either according to common standards of surgical procedures, including standard surgi-cal terms [16,17], or according to fixed protocol created by local experts. In this second case, the first step consists in building up one’s own vocabulary. New terminology is employed and provides knowledge representation that is proper to the surgeons own experience and to the specific surgical environment. In this context, SP recordings can be driven by specific Surgical Process Models (SPMs), in-cluding complex dedicated ontologies. The need for model-based systems to assist and monitor Computer-Assisted Surgery (CAS) has been discussed by Jannin et al. [18], who also mentioned the importance of foresight within a surgical procedure by modeling the surgery into a sequence of major steps. A model was proposed in the context of neurosurgical interventions, based on a UML class diagram and a textual description for breaking down the proce-dure. SPMs have also been introduced as an added-value for the description of surgeries during an SP recording by the group in Leipzig. Burgert et al. [19] proposed an explicit and formal description in an ontology based on General Ontological Language (GOL) for representing surgical interventions. Another study [20] focused on the description of concepts and technologies for the acquisition of surgical workflows by monitoring surgical interventions. They introduced a universal adaptable recording scheme describing the subdivision of the surgical interventions into detailed records of manual work steps. New software was implemented (i.e. a surgical workflow editor: the ICCAS editor system) to record processes during the intervention. They also introduced methods for computing generic SPMs that could serve to generate and compare surgical proce-dures [21, 22]. Recently, Bouarfa et al. [23] presented a mechanism for dataset pre-processing before HMM training. Their objective was to infer high-level tasks (i.e. defined
as surgical steps) from a set of observable low-level tasks (e.g. picking up instruments or putting down instruments). They stressed that the information extracted from the OR must be discriminant, invariant to task distortion, compact in size and easy to monitor.
Lastly, Combi et al. [24] studied clinical activities in terms of clinical workflows. They studied clinical processes which are comprised of clinical activities to be done by given actors in a given order satisfying given temporal constraints. They modeled workflows as a set of activities and proposed a similarity function taking into account the order and duration of the activities. On a more general level, Vankipuram et al. [25] studied workflows composed of recordings of the motion and location of clinical teams. These data are then used to model activities in critical care environments. These recent studies highlight the serious need and the emerging trend of tools able to take into account the sequentiality of activities.
The study of processes is also related to the field of process mining [26], which traditionally has been used to extract models from event logs and to check or extend existing models. One of the goals of process mining is to create a model which ideally represents a set of processes. Then, a single process can be checked against the model to identify problems. The field of process mining [27] is com-posed of different tasks, as the discovery of the models, the check of the conformance of one process against a model or the extension of a model. Even though the process mining approach introduces interesting and important concepts, it does not generally tackle the definition of metrics to com-pare processes. Furthermore, the concepts introduced are generic and an adaptation to a specific domain is always necessary. The work presented in this paper is related to this field in the way that the general concepts are similar. However, we introduce in this paper a methodology which is specific to surgical processes.
3. Methods
3.1. A Surgical Process (SP) as a sequence of activities A Surgical Process (SP) can be seen in the real world as a sequence of flow objects [28]. According to the Workflow Management Coalition (WFMC) terminology [29], we name flow objects representing surgical work steps as activities aci and a set of activities as AC with aci ∈ AC (aci
being the ith activity). Each activity in a SP corresponds to a surgical work step which contains several kinds of information. Thus, an activity aci is defined as a triple:
aci=< a; s; i > a ∈ A, s ∈ S, i ∈ Imi (1)
where A is the set of possible actions (e.g. {cut, remove, . . . }), S the set of possible anatomical structures (e.g. {skin, dura matter, . . . }), I the set of possible instruments (e.g. {scalpel, scissors, . . . }) and mi the number of instruments
used in the activity aci. A full example of one activity could
be: <cut, skin, scalpel>. Thus, the domain of definition of
an activity is given by: A × S × Imi. These sets of possible
values are generally specific to the type of surgery studied. An ontology can be used to describe the vocabulary for a specific type of surgery [30].
Along with the information on the action (a), the anatomical structure (s) and the instrument(s) used (i), each activity has a starting point (start(aci)) and a
stop-ping point (stop(aci)) which respectively correspond to the
time point when the activity started and the time point when the activity stopped (start(.) → R, stop(.) → R) on the timeline of the surgeries. Note that start(aci) <
stop(aci), induces a partial order among the activities. The
last information on the activity is the hand used to perform the activity (hand(aci)) which can either be right or left.
A Surgical Process can be seen as a sequence of activities (spk) performed during surgery. Each activity of this sequence belongs to the set of all the different activities performed during the surgery (ACk):
spk=< ac(k)1 , ac(k)2 , . . . , ac(k)n
k > | ac (k)
i ∈ ACk (2)
3.2. Comparing SPs using Dynamic Time Warping (DTW) When dealing with SPs, a major challenge is the design of metrics to evaluate the similarity of SPs. Indeed, defining a similarity measure is often the first step in identifying patterns among a set of objects. As an SP can be seen as a sequence of activities, we propose using the Dynamic Time Warping (DTW) algorithm [3] to compare them. DTW is based on the Levenshtein distance (or edit distance), and was originally used for applications in speech recognition. It finds the optimal alignment between two sequences and captures flexible similarities by aligning the two sequences. In order to use DTW to compare two sequences, a distance has to be defined to evaluate the similarity between the different elements comprising the sequence. In our case, it means defining a distance between two activities. Thus, we defined this distance as a binary function which is 0 if all three components (Eq. 1) of the two activities are equals and 1 otherwise:
d(aci, acj) = 0 if aci(a) ∗ = acj(a) and aci(s) ∗ = acj(s) and aci(i) ∗ = acj(i) 1 else (3)
where = a Boolean operator performing the compari-∗ son between the action, the anatomical structure or the instrument(s) used (e.g. d( <cut, skin, scalpel>,<cut, skin, scalpel>)=0).
To compare two SPs using DTW, the sequence of ac-tivities is first stretched by considering the starting and stopping of each activity. This step is needed to have the two SPs on the same timeline and to be able to compare the activities performed in each SP at a given time point t in the timeline. The activity performed at time point t
will be aci(t) iff t ∈ [start(aci); stop(aci)]. Note that it is
not necessary for the two SPs to last the same amount of time, the only assumption we make is that for both SPs, the first activity started at the same moment (t = 0).
Considering two SPs, spk =< ac(k)1 , ac(k)2 , . . . , ac(k)nk >
and spl=< ac(l)1 , ac(l)2 , . . . , ac(l)nl > the cost of the optimal
alignment can be recursively computed with:
d(spk(t), spl(t)) = (4) d(ac(k)i (t), ac(l)j (t)) + min d(spk(t − 1), spl(t − 1)) d(spk(t), spl(t − 1)) d(spk(t − 1), spl(t))
where spk(t) is the subsequence < ac(k)1 , . . . , ac(k)i (t) >. Direct implementation of this recursive definition has an exponential cost. Fortunately, by decomposing it into subproblems, complexity can be narrowed down to Nk×Nl,
N being the number of time points in a SP, which is equivalent to the stopping value of the last activity of the SP. Note that the cost of the aligment can be seen as a dissimilarity measure but is not a distance as DTW is a semi-pseudometrics. The term distance is used here as an abuse of langage.
3.3. Breakdown of SPs and component weighting
To better analyze SPs and accurately render the way activities are performed during surgery, we decided to split an SP into three parts according to whether the activities are performed with the right hand, the left hand or under the microscope. This breakdown allows us to better represent the way the activities are chained by the surgeon during the surgery. Indeed, by using this breakdown, surgeries can be compared with a finer grain by taking into account the surgeons different actions.
The set of activities performed with the right hand (AC(r)k ) and the sequence of activities performed with the right hand (sp(r)k ) are defined as:
AC(r)k = {ac(k)i } | (ac(k)i ∈ ACk∧ hand(ac (k) i ) = right ∧ ac(k)i (i) 6= {microscope}) (5) sp(r)k =< ac1, ac2, . . . , acnr k > | aci∈ AC (r) k
The set of activities peformed with the left hand (AC(l)k ) and the sequence of activities performed with the left hand (sp(l)k ) are defined as:
AC(l)k = {aci} | (aci∈ ACk∧ hand(aci) = left
∧ aci(i) 6= {microscope}) (6) sp(l)k =< ac1, ac2, . . . , acnl k > | aci∈ AC (l) k
The set of activities involving the use of the microscope (AC(m)k ) and the sequence of activities performed using the
microscope (sp(m)k ) are defined as:
AC(m)k = {aci} | (aci ∈ ACk∧ aci(i) = {microscope}) (7)
sp(m)k =< ac1, ac2, . . . , acnm k > | aci∈ AC (m) k By definition, we have ACk = AC (r) k ∪ AC (l) k ∪ AC (m) k and spk = sp(r)k ∪ sp(l)k ∪ sp(m)k and nk = nrk+ nlk+ nmk.
Following this breakdown, we composed the similarity used in DTW to compare two activities of two SPs at a given time point to take into account these three differ-ent compondiffer-ents (right hand, left hand and miscroscope use). The similarity taking into account the three pieces of information is defined as:
d(spk(t), spl(t)) = α × d(sp(r)k (t), sp(r)l (t)) + (8) β × d(sp(l)k (t), sp(l)l (t)) + (9) γ × d(sp(m)k (t), sp(m)l (t)) (10) where α, β and γ are the weights respectively given to the right hand, the left hand and the microscope (α + β + γ = 1). In this paper we have used α = 0.7, β = 0.2 and γ = 0.1 as the right hand is the most important component followed by the left hand and, lastly, microscope use. These weights were chosen according to surgeons experience on the most important actions performed by a surgeon during the surgery. According to their knowledge, the most important actions are performed with the right hand. We tried different values for the weights, and kept the one giving the most interesting results. However, the difference in the results were limited, especially with a weight for the right hand superior to 0.5.
3.4. Visualizing SPs using an index plot
It is generally useful to have a visual representation of the data to easily explore them and to illustrate re-sults. However, complex data structures sometimes pre-vent straightforward visualization. In the case of SPs, we propose the use of index plots [31] which have already been used for sequence visualization [32]. The idea of an index plot is to display the sequence by representing an activity as a rectangle of a specific color for each activity, and a width proportional to its duration (i.e. stop(aci) − star(aci)).
By this mean, SPs can easily be visualized and a quick visual comparison can be performed. The following gives an example of one SP (sp1=< ac(1)1 , ac
(1) 2 , ac
(1)
3 >) with
three different activities:
sp1: ac(1)1 z }| { ac(1)2 z }| { ac(1)3 z }| { timeline 0 N1
Using this representation, a set of SPs can be displayed for visual assessment. In the example bellow, three SPs are presented:
sp1:
sp2:
sp3:
Legend:
<cut, skin, scalpel> <coagulate, skin, bipolar> <swab, muscle, cottonoids>
According to DTW, sp1 and sp2 will have an
align-ment cost of zero and the highest possible similarity (i.e. 0). Indeed, even if the different activities do not last the same amount the time, the sequencing and the number of activities are identical. Alternatively, sp3 will be slightly
dissimilar from sp1 and sp2 as the two first activities are
repeated (in practice, this can be explained by the sur-geon’s lower degree of experience, requiring him to redo some actions).
The alignment of two SPs using DTW can also be visualized using an index plot by highlighting the path of the minimum cost. The figure below displays the minimum cost path for the alignment of sp1 and sp2 and sp1and
sp3:
sp1
sp
2 minimal cost path
sp1
sp
3
This visualization can be useful in understanding and analyzing complex differences between surgeries. Further-more, it helps to visually identify patterns in order to understand the similarity or dissimilarity of a pair of SPs. 3.5. Mining patterns within Surgical Processes (SPs)
The similarity measure defined using DTW allows us to easily compare SPs. This measure can be used with data
mining methods in order to identify patterns among a set of SPs. If a classification of the SPs is known, the measure can be used to assign a class to a new, unknown SP. For ex-ample, if we possess two sets of SPs representing recordings of two different kinds of surgery, it is possible to classify an unknown SP by evaluating which of the two groups of SPs this surgery is the most similar to. In [33], Padoy et al. had a similar approach and used Hidden Markov Models to analyze and process a set of SPs. Alternatively, unsuper-vised classification (i.e. clustering) can also be carried out in order to identify relevant groups of SPs in a set of SPs. This kind of approach is especially useful for identifying patterns in a set of surgeries. Furthermore, it can then be used to correlate pre-operative information (e.g. age of the patient, surgeons expertise) with the identified clusters. This can be used to identify the criteria which best explain the similarities and dissimilarities between surgeries. In the work presented in this paper, we used both of these approaches: a supervised approach with a K-Nearest Neigh-bors (KNN) classifier and an unsupervised approach with Ascendant Hierarchical Clustering (AHC). The goal is to highlight the relevance of the proposed similarity measure in order to identify patterns among SPs. The following describes both approaches.
K-Nearest Neighbors (KNN). In pattern recognition, the k-nearest neighbor algorithm is a method for classifying objects based on closest training examples in the feature space. In our case, it consists in identifying for a given SP, the most similar SP(s) in a set of SPs. Once the most similar SP is identified, the class assigned to this SP is assigned to the unclassified SP. It is possible to change the parameter k and to carry out a vote among the classes of the k most similar in the SPs. We used the KNN with k = 3 after having tested k = 1 and k = 5, the results being similar. The nearest neighbor of one SP in a set of SPs (SP) is defined as:
N N (spk) = spl| spl∈ SP ∧ ∀ spi∈ SP ∧ spi6= spl
∧ d(spk, spl) < d(spk, spi) (11) Ascendant Hierarchical Clustering (AHC). Clustering [34,
35] is the automatic assignment of a set of objects into subsets (called clusters) so that objects in the same cluster are similar in some sense. This similarity between objects is often difficult to design, especially for complex objects like sequences. DTW has already been successfully used as a similarity measure for clustering, for example in [36] where the authors used DTW to perform KMeans clus-tering on sequential data to identify patterns in remote sensing images. Thus, we propose using the similarity mea-sure defined using DTW to automatically identify clusters of similar surgeries. Hierarchical clustering is a method of cluster analysis which seeks at building a hierarchy of clusters. Starting with the objects, the clusters are cre-ated iteratively by merging the two most similar clusters.
Different criteria exist to choose the clusters to merge, we used the average-link approach [37], which consists in evaluating the similarity of two clusters according to the average distance between all the couple of objects in the two clusters. Thus, the distance between two clusters Ci
and Cj composed of SPs, is defined as:
d(Ci, Cj) = 1 |Ci||Cj| |Ci| X k=1 |Cj| X l=1 d(spk, spl) (12)
where |C| is the cardinality of the cluster (i.e. the number of SPs in the cluster). Hierarchical clustering approaches are known to be computationally expensive. However, as the number of data we manipulate is limited, using this kind of approach is tractable (e.g. less than 10 seconds of computation time for one clustering of the data, a few minutes to compute the distance matrix). The average-link approach was selected for its low sensibility to noise and outliers.
3.6. Data presentation
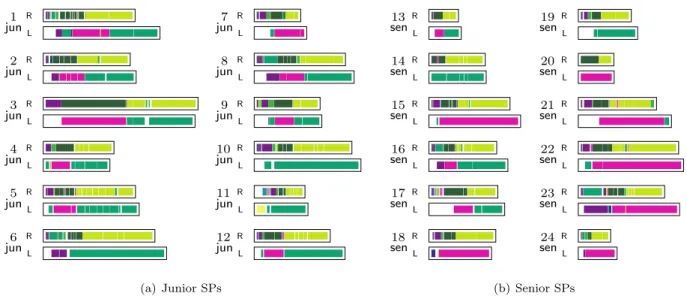
Twenty-four procedures (10 men, 14 women, median age of 52 years) of lumbar disc herniation surgery were recorded at the Neurosurgery Department of the Leipzig University Hospital, Germany. The procedure can be di-vided into three major steps: the approach of the herniated disc via a posterior intermyolamar route, discectomy in-cluding the dissection and removal of the disc, and the closure step. Additionally, a hemostasis step might be necessary before the closure. Five senior surgeons and five junior surgeons participated to the study. The senior surgeons had already performed more than 100 removals of lumbar disc herniation, whereas the junior surgeons had performed more than 2 years of their residency program. Among the 24 recorded procedures, 12 were performed by one senior surgeon with the aid of one junior surgeon, and in the 12 remaining cases, surgery was performed by one junior surgeon with the aid of one senior surgeon. During all junior recordings, the only step that was performed by junior surgeons without the help of senior surgeons was the closure step. Thus, in this paper, we focused on the analysis of this last step for a better discrimination of junior and senior performances. Figure1 presents an illustration of this step using index plot visualization (section 3.4) for the right hand (R) and the left hand (L) of the 24 SPs considered. The legend, which matches the colors with activity performed, is presented in Figure 2 (a) for the right hand, and Figure 2 (b) for the left hand. Table 1
presents information about the content of the surgeries (e.g. number of activities, total duration, etc.) for the junior and senior according to the activities performed by the right and left hands.
The data were acquired using the Surgical Workflow Editor [38]. SPs were recorded on-line by an observer, a senior neurosurgeon, with the help of a touch-screen laptop to facilitate the recording task. Figure 3presents a
picture acquired in the OR during the acquisition of the data. Moreover, before starting the study, the observer performed a training session comprising different recordings of neurosurgical procedures in two different hospitals, in order to reduce the intra-observer recording variability. 3.7. Introducing noise into the data to evaluate the metric’s
behavior
In order to evaluate the relevance of our approach consisting in using DTW to compare surgeries, we intro-duced noise into the data presented in the previous section. By this means, we wanted to highlight the fact that our measure was able to accurately grasp similarity and dis-similarity between SPs. The introduction of noise was expected to perturb the results obtained with the noise-free data.
Acquiring SPs off-line from recorded video, or on-line using an operator present in the operating room, is prone to errors. Consequently, some noise can be present in the data, mostly materialized as errors in the components of the trio describing the activities (Eq. 1). To evaluate the reliability of our method with noise, and to highlight its ability to accurately measure SP similarity, we artificially added noise to the SPs presented in section 3.6. This added noise consisted in switching one of the components in several activities of the SPs.
We derived 10 datasets from the original dataset con-taining the 24 surgeries with a level of noise ranging from 10% to 100%. These percentages correspond to the number of permutations applied to the dataset according to the number of activities in the SP. For example, for a SP con-taining 14 activities (each one comprising 3 components: action, anatomical structure and instrument(s) used), with a 10% level of noise, 4 permutations (abs(14 × 3 × 0.10)) will be performed. A permutation consists, for example, in switching the action in an activity (e.g. sew) to another randomly selected action (e.g. cut). As the permutation step contains randomness, we carried out this process ten times for each level of noise. Consequently, 101 datasets (the original one plus 10 × 10 noisy ones) were used for the experiments, totalizing 2424 single surgeries (24 per dataset).
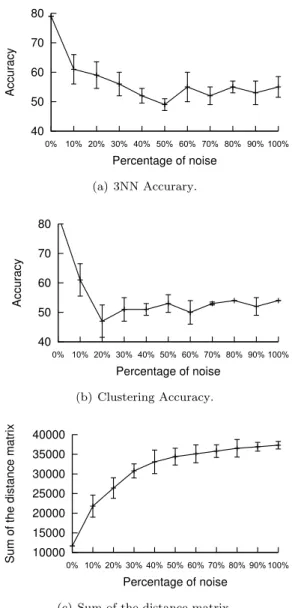
To evaluate the behavior of our method according to the noise level, we used three evaluation criteria: the accuracy of the classification using a 3NN classifier, the accuracy of the clustering result using an AHC and, lastly, the sum of the distance matrix. 3NN classifier accuracy is computed by carrying out a cross validation on the different noisy datasets. Clustering accuracy is computed by applying the AHC and by cutting the dendrogram in order to obtain two clusters. These two clusters were then compared to the known classification (i.e. junior and senior). Lastly, the sum of the distance matrix consists in computing the sum of the distances between each couple of SPs in the
h! R 1 junL R 2 junL R 3 junL R 4 junL R 5 junL R 6 junL R 7 junL R 8 junL R 9 junL R 10 junL R 11 junL R 12 junL (a) Junior SPs R 13 senL R 14 senL R 15 senL R 16 senL R 17 senL R 18 senL R 19 senL R 20 senL R 21 senL R 22 senL R 23 senL R 24 senL (b) Senior SPs
Figure 1: Index-plots representing the activities of the right (R) and left (L) hand for a population of 24 surgeries performed by junior (a) and senior (b) surgeons.
(sew) (skin) (needle-holders) (sew) (fascia) (needle-holders) (install) (muscle) (drainage) (hold) (skin) (classic—forceps) (sew) (skin) (drainage—needle-holders) (remove) (muscle) (retractors) (coagulate) (muscle) (bipolar—forceps) (hold) (muscle) (suction-tube) (coagulate) (skin) (bipolar—forceps) (install) (skin) (retractors)
(swab) (fascia) (classic—cottonoids—forceps) (hold) (fascia) (suction-tube)
(coagulate) (fascia) (bipolar—forceps) (irrigate) (dura-mater) (saline-solution) (irrigate) (muscle) (saline-solution) (remove) (skin) (retractors) (swab) (muscle) (cottonoids) (hold) (muscle) (retractors)
(swab) (muscle) (classic—cottonoids—forceps) (install) (muscle) (suction-tube)
(install) (muscle) (retractors)
(a) Legend right hand
(hold) (skin) (classic—forceps) (hold) (fascia) (classic—forceps) (install) (muscle) (drainage) (hold) (dura-mater) (suction-tube) (hold) (ligament) (suction-tube) (hold) (muscle) (retractors) (install) (skin) (retractors) (remove) (skin) (retractors)
(b) Legend left hand Figure 2: Legend of the activities performed during the last step of the considered SPs.
dataset: Dsum= N X i=0 N X j=i+1 d(spi, spj) (13)
where N is the number of SPs. The sum of the matrix highlights the overall distance between the SPs of the dataset.
4. Results
The results presented below are composed of two steps. In the first step (section4.1) we carried out experiments
on the data presented in section3.6to highlight the ability of our method to identify relevant patterns. In a second step (section 4.2), we present results on the noise added to the data to study the robustness of the metric to noise data.
4.1. Results of data clustering
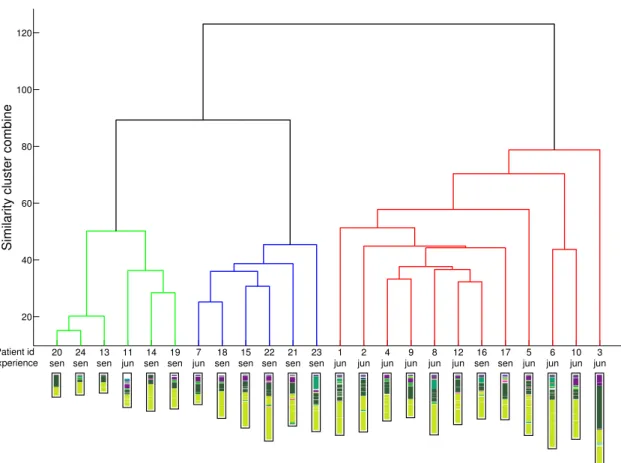
Figure4presents the dendrogram of the AHC for the closure step, which is the only step performed by junior and senior surgeons alone. Along with the clustering, index plots of the right-hand activities of each surgery are shown
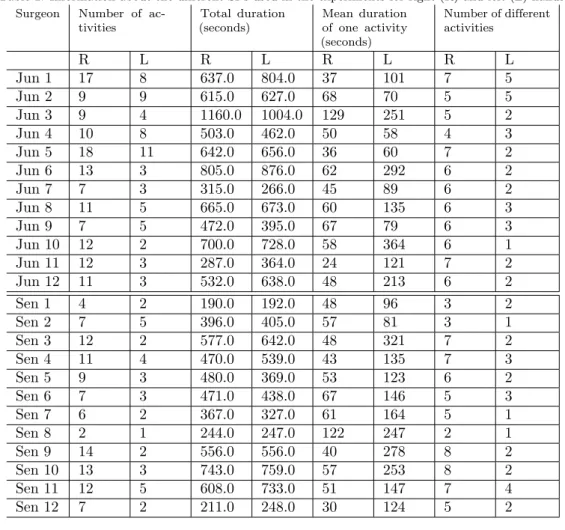
Table 1: Information about the different SPs used in the experiments for right (R) and left (L) hands. Surgeon Number of
ac-tivities Total duration (seconds) Mean duration of one activity (seconds) Number of different activities R L R L R L R L Jun 1 17 8 637.0 804.0 37 101 7 5 Jun 2 9 9 615.0 627.0 68 70 5 5 Jun 3 9 4 1160.0 1004.0 129 251 5 2 Jun 4 10 8 503.0 462.0 50 58 4 3 Jun 5 18 11 642.0 656.0 36 60 7 2 Jun 6 13 3 805.0 876.0 62 292 6 2 Jun 7 7 3 315.0 266.0 45 89 6 2 Jun 8 11 5 665.0 673.0 60 135 6 3 Jun 9 7 5 472.0 395.0 67 79 6 3 Jun 10 12 2 700.0 728.0 58 364 6 1 Jun 11 12 3 287.0 364.0 24 121 7 2 Jun 12 11 3 532.0 638.0 48 213 6 2 Sen 1 4 2 190.0 192.0 48 96 3 2 Sen 2 7 5 396.0 405.0 57 81 3 1 Sen 3 12 2 577.0 642.0 48 321 7 2 Sen 4 11 4 470.0 539.0 43 135 7 3 Sen 5 9 3 480.0 369.0 53 123 6 2 Sen 6 7 3 471.0 438.0 67 146 5 3 Sen 7 6 2 367.0 327.0 61 164 5 1 Sen 8 2 1 244.0 247.0 122 247 2 1 Sen 9 14 2 556.0 556.0 40 278 8 2 Sen 10 13 3 743.0 759.0 57 253 8 2 Sen 11 12 5 608.0 733.0 51 147 7 4 Sen 12 7 2 211.0 248.0 30 124 5 2
Figure 3: Acquisition of the data in the OR (a demonstration video is available on the online version of the article).
below. Three clusters visually emerged from the analysis. When cutting the dendrogram to create 2 clusters, 12 surgeries can be extracted from each cluster. The first cluster (left part, in green and blue) contains 10 surgeries performed by seniors and 2 by juniors. For the second cluster (right part, in red), there are 10 surgeries performed by juniors and 2 by seniors. Additionally, within the first
cluster, a sub-classification can be found (between red and blue parts), where each sub-cluster contains five surgeries performed by seniors and 1 by a junior. By keeping the two main clusters, an accuracy of 83.33% is found, considering that 20 surgeries out of 24 are classified in the right cluster. 4.2. Results according to noise
Figure5illustrates the evolution of the three criteria (i.e. 3NN accuracy, clustering accuracy and sum of the distance matrix) on the noisy datasets (section3.7) accord-ing to the noise level. Figures 5(a) and (b) respectively show the evolution of the accuracy of the 3NN classifier and the clustering accuracy. The accuracies decrease with the increase of noise in the dataset. This trend highlights the fact that the similarity measure using DTW accurately evaluates similarity between SPs. Indeed, the noise in-crease disrupts the performance of SP similarity. Figure5
(c) shows the evolution of the sum of the distance matrix (Eq. 13). This sum increases with the level of noise, which means that adding noise tends to decrease the similarity between the SPs. This result also shows that this similarity measure is relevant as it reveals that if the content of two SPs is different, they will be dissimilar according to our measure. However, one can also note that these results highlight that the method is sensitive to noise. Indeed,
20 40 60 80 100 120
Similarity cluster combine
1 jun 2 jun 3 jun 4 jun 5 jun 6 jun 7 jun 8 jun 9 jun 10 jun 11 jun 12 jun 13 sen 14 sen 15 sen 16 sen 17 sen 18 sen 19 sen 20 sen 21 sen 22 sen 23 sen 24 sen Patient id Experience
Figure 4: Dendrogram of the clustering of the 24 SPs
with more than 10% of noise the accuracy begins to be low. The strong influence of the noise is mostly due to the use of a binary distance between the activity (see Eq. 3). Indeed, if only one component of an activity is different, the two activities will be evaluated as different. To reduce the influence of noise, other distances between activities could be used, as for example a fuzzy distance weighting each component of the activities. Figure 7 presents the similarity matrices between the 24 SPMs without noise (a), with 10% of noise (b) and with 60% noise (c). The first 12 rows/columns of the matrices correspond to juniors and the remaining 12 rows/columns correspond to the seniors. The histogram of the distance was stretched and normalized in order to compute gray levels. In these matrices, the darker the cell, the more dissimilar the SPs.
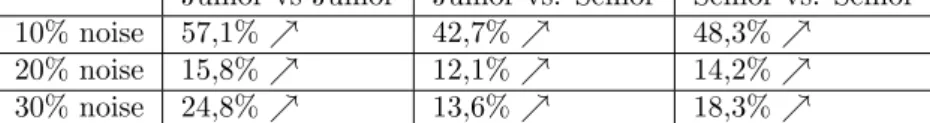
Table2 presents the evolution of the average distance in percentage between the junior and the senior groups according to three levels of noise. Figure 6 shows the evolution of the percentages for all the levels of noise. Given two levels of noise, the percentage is computed by studying the difference between the distance matrices of the two levels and by computing the geometric mean of the percentage of increase of the distance. These values show that the distances within each group (junior and senior) tend to increase faster than the distance between the junior
and the senior groups when the noise increase. This can be explained by the fact that the SPs belonging to the same group are more similar, and a change in an activity resulting from the introduction of noise is likely to affect the alignment provided by DTW. On the contrary, when measuring the distance between SPs from two different groups, the introduction of noise is less likely to affect the similarity as a change in one component of two activities already containing one difference will have no effect.
5. Discussion
5.1. Classification of the surgeon’s experience
According to Figure 4, two main clusters are clearly identifiable. It turns out that these two clusters are strongly correlated with surgeons experience, which is not surpris-ing. Indeed, an actual tendency shows that senior surgeons perform fewer gestures than juniors. Experienced surgeons are more economical with their movements than the inexpe-rienced ones, notably during a mechanical step (the closure step), which explains why the DTW similarity is able to capture the differences between the two groups. Moreover, the two junior surgeries classified as being senior ones were actually both operated by the same junior surgeon. During
Table 2: Means augmentation of the distance between SPs in percentage. Junior vs Junior Junior vs. Senior Senior vs. Senior
10% noise 57,1% % 42,7% % 48,3% %
20% noise 15,8% % 12,1% % 14,2% %
30% noise 24,8% % 13,6% % 18,3% %
the preliminary step of experience classification, our refer-ence neurosurgeon wondered whether this surgeon had to be considered as being junior or senior regarding his inter-mediate experience (i.e. seventh year of resident training), which could explain this classification error. On the other hand, the two senior surgeries classified as being juniors were not particularly complicated surgeries, as the total time of both surgeries was quite low. This classification error could be explained by a lower gesture economy by the corresponding senior surgeons, or even by lower manual dexterity.
According to Figure4, two sub-clusters of senior sur-geons can be extracted. Similarly to the correlation with the surgeons experience, explanations with other pre-operative data (e.g. patient age, patient outcome, difficulty of the surgery, etc.) were explored, without success. However, both sub-clusters contain surgeries performed by same se-nior surgeons. This reveals that sese-niors can have different operating techniques and preferably sequences of activities that differ from one senior to another and can explain this distinct separation.
Figure5illustrates the evolution of the results accord-ing to the noise added to the data. The results obtained reveal that the addition of noise quickly perturbs the results. Even with only 10% noise, the accuracy of the supervised classification dropped from around 80% to almost 60%. This sharp difference highlights the fact that DTW is able to accurately evaluate the similarity of very similar surg-eries but also to discriminate between different surgsurg-eries. Our method turned out to have good sensitivity to noise evolution.
5.2. A new metric for surgery comparisons
The DTW approach for surgery comparisons enables us to focus on the sequentiality of surgeries alone by disre-garding time differences. Indeed, the DTW algorithm was first used to synchronize two time series, for instance in the context of speech recognition. Using this method for syn-chronizing surgeries makes it possible to take into account differences in activity sequences, without time constraints. Assuming that time is not a major parameter for skill evaluations, the number of activities associated with their sequentiality is more relevant and surgery dissimilarities can be objectively quantified using the DTW distance. This metric is therefore an interesting and innovative way of comparing surgeries and has proven to be a complementary approach to standard approaches comparing time/number of occurrences [2].
We focused in this paper on the supervised and unsu-pervised classification of SPs according to surgeons level of expertise. Using the proposed similarity metric, we can imagine correlations with other data in order to highlight other types of information. Using pre-operative data, cor-relations could be found using the age of patients or the specific type of syndrome, as performed in [39]. Using post-operative data, the patient outcomes could be introduced into the analysis. Likewise, the analysis could be carried on specific parameters of the intervention, as already presented by [40] for evaluating the effects of low dose protocols in the context of neurointerventional procedures.
5.3. Specific applications: training and assessment Training and assessment of surgeons are now considered as crucial issues for patient safety. Training of junior sur-geons is a very time-consuming, interactive and subjective task. As all juniors currently learn with the teaching help of seniors, there has been a new demand for simulation devices. Moreover, some surgeons are clearly superior to others in performing tasks, resulting in a growing pressure to demonstrate their skills. These two challenges have motivated the creation of automatic systems for the ob-jective assessment of surgical skills. With the automatic techniques recently proposed using sensor devices, systems are able to precisely recognize activities through different levels of granularity, from the simple gesture to the global steps of the surgery, which is a powerful tool for automating surgical assessment and surgical training without human bias. For assessment, surgical activities can be scored for precision, dexterity or overall performance. For training, it would allow surgeons to benefit from constructive feed-back and to learn from their mistakes. Similar methods can also be employed for other types of surgery, or even other members of the surgical team. For the introduction of our system into the clinical routine, the extraction of activities should be done automatically. At the moment, an operator has to be present in the OR to record the intervention. While this task has been performed manually until now, there are advantages of automating this process. One can imagine the automatic extraction of information using different kinds of sensor devices, such as tracking systems [41, 42], sensors on instruments [43], OR global view videos [44] or surgical scene videos [45]. As a long term objective, the combination of all these sensors will create complete recognition systems that would be able to recognize surgical tasks from all levels of granularity(i.e. from the simple subtask to the global step) and automate the creation of SPs. Then, SP analysis (e.g. clustering and
40 50 60 70 80 0% 10% 20% 30% 40% 50% 60% 70% 80% 90% 100% Accuracy Percentage of noise (a) 3NN Accurary. 40 50 60 70 80 0% 10% 20% 30% 40% 50% 60% 70% 80% 90% 100% Accuracy Percentage of noise (b) Clustering Accuracy. 10000 15000 20000 25000 30000 35000 40000 0% 10% 20% 30% 40% 50% 60% 70% 80% 90% 100%
Sum of the distance matrix
Percentage of noise
(c) Sum of the distance matrix.
Figure 5: Evolution of the means over ten experiments of the three evaluation criteria according to the different noise levels. The bars correspond to the standard deviations over the ten experiments.
classification) could also be automated to identify relevant patterns in order to carry out comparisons and evaluations.
6. Conclusion
The creation of new metrics for the comparison and the evaluation of SPs is a major challenge. In this paper, we have proposed a new surgery metric based on the DTW algorithm that enables us to focus the analysis on the different types of activity performed during the surgery and their sequencing, rather than on the time differences. Supervised and unsupervised classification experiments have allowed us to establish that DTW similarity metrics were capable of discriminating groups of SPs, and that correlations between these groups and pre-operative data then enable us to highlight specific information. Results on the classification of surgeons level of expertise were
0 0.1 0.2 0.3 0.4 0.5 0.6 10% 20% 30% 40% 50% 60% 70% 80% 90% 100%
Mean evolution of the distance
Percentage of noise Jun vs. Jun Sen vs. Sen Jun vs. Sen
Figure 6: Mean evolution of the distance within the groups Ju-nior/Junior Junior/Senior and Senior/Senior.
(a) Without noise. (b) 10% of noise (c) 60% of noise
Similar Dissimilar
Figure 7: Similarity matrices of the 24 SPs using DTW according to three levels of noise.
shown. One possibility for improving the analysis would be to introduce semantics into the surgery similarity metrics. In this research, at each time step, a binary comparison of two surgical activities is performed. The idea would be to introduce a semantic matrix in order to link each activity using different distance values in a predefined similarity scale for a more complex analysis of SPs.
Acknowledgment
The authors would like to thank Fran¸cois Petitjean for his useful insights on Dynamic Time Warping.
References
[1] Mackenzie, C., Ibbotson, J., Cao, C., Lomax, A.. Hierarchical decomposition of laparoscopic surgery: a human factors approach to investigating the operating room environment. Minimally Invasive Therapy and Allied Technologies 2001;10(3):121--127. [2] Riffaud, L., Neumuth, T., Morandi, X., Trantakis, C., Meixensberger, J., Burgert, O., et al. Recording of surgical processes: a study comparing senior and junior neurosurgeons during lumbar disc herniation surgery. Neurosurgery 2010;67:325--332.
[3] Hiroaki, S., Chiba, S.. Dynamic programming algorithm optimization for spoken word recognition. IEEE Transactions on Acoustics, Speech, and Signal Processing 1978;26:43--49. [4] ACGME, . Toolbox of assessment methods. 2000.
[5] Joyce, B.. Introduction to competency-based residency educa-tion. 2006.
[6] Reiley, C., Lin, H., Yuh, D., Hager, G.. Review of methods for objective surgical skill evaluation. Surgical Endoscopy 2011;:1--11.
[7] Bridgewater, B., Grayson, A., Jackson, M., Brooks, N., Grotte, G., Keenan, D., et al. Surgeon specific mortality in adult cardiac surgery: comparison between crude and risk stratified data. British Medical Journal 2003;327(7405):13. [8] Reznick, R., Regehr, G., MacRae, H., Martin, J., McCulloch,
W.. Testing technical skill via an innovative ”bench station” examination. The American Journal of Surgery 1997;173(3):226--230.
[9] Moorthy, K., Munz, Y., Sarker, S., Darzi, A.. Objective assessment of technical skills in surgery. British Medical Journal 2003;327(7422):1032.
[10] Doyle, J., Webber, E., Sidhu, R.. A universal global rating scale for the evaluation of technical skills in the operating room. The American Journal of Surgery 2007;193(5):551--555. [11] Datta, V., Mackay, S., Mandalia, M., Darzi, A.. The use of
electromagnetic motion tracking analysis to objectively measure open surgical skill in the laboratory-based model. Journal of the American College of Surgeons 2001;193(5):479--485.
[12] Francis, N., Hanna, G., Cuschieri, A.. The performance of master surgeons on the Advanced Dundee Endoscopic Psy-chomotor Tester: contrast validity study. Archives of Surgery 2002;137(7):841.
[13] Rosen, J., Hannaford, B., Richards, C., Sinanan, M.. Markov modeling of minimally invasive surgery based on tool/tissue inter-action and force/torque signatures for evaluating surgical skills. IEEE Transactions on Biomedical Engineering 2001;48(5):579--591.
[14] Chmarra, M., Grimbergen, C., Dankelman, J.. Systems for tracking minimally invasive surgical instruments. Minimally Invasive Therapy & Allied Technologies 2007;16(6):328--340. [15] Guthart, G., Salisbury Jr, J.. The IntuitiveTM telesurgery
system: overview and application. In: IEEE International Conference on Robotics and Automation; vol. 1. 2000, p. 618--621.
[16] Den Boer, K., de Wit, L., Davids, P., Dankelman, J., Gouma, D.. Analysis of the quality and efficiency in learning laparoscopic skills. Surgical Endoscopy 2001;15(5):497--503.
[17] Malik, R., White, P., Macewen, C.. Using human reliability analysis to detect surgical error in endoscopic DCR surgery. Clinical Otolaryngology & Allied Sciences 2003;28(5):456--460. [18] Jannin, P., Raimbault, M., Morandi, X., Riffaud, L., Gibaud, B.. Model of surgical procedures for multimodal image-guided neurosurgery. Computer Aided Surgery 2003;8(2):98--106. [19] Burgert, O., Neumuth, T., Lempp, F., Mudunuri, R.,
Meix-ensberger, J., Strau, G., et al. Linking Top-level Ontologies and Surgical Workflows. In: International Journal of Computer Assisted Radiology and Surgery; vol. 1. 2007, p. 437--438. [20] Neumuth, T., Strauß, G., Meixensberger, J., Lemke, H.,
Burgert, O.. Acquisition of process descriptions from surgical interventions. In: Database and expert systems applications. 2006, p. 602--611.
[21] Neumuth, T., Jannin, P., Schlomberg, J., Meixensberger, J., Wiedemann, P., Burgert, O.. Analysis of surgical intervention populations using generic surgical process models. International Journal of Computer Assisted Radiology and Surgery 2010;6:59--71.
[22] Neumuth, T., Jannin, P., Strauss, G., Meixensberger, J., Burgert, O.. Validation of knowledge acquisition for surgical process models. J Am Med Inform Assoc 2009;16(1):72 -- 80. [23] Bouarfa, L., Jonker, P., Dankelman, J.. Discovery of high-level
tasks in the operating room. Journal of Biomedical Informatics 2011;44(3):455 -- 462.
[24] Combi, C., Gozzi, M., Oliboni, B., Juarez, J., Marin, R.. Temporal similarity measures for querying clinical workflows. Artificial intelligence in medicine 2009;46(1):37--54.
[25] Vankipuram, M., Kahol, K., Cohen, T., Patel, V.L.. Toward automated workflow analysis and visualization in clinical
envi-ronments. Journal of Biomedical Informatics 2011;44(3):432 --440.
[26] van der Aalst, W.M.P., Pesic, M., Song, M.. Beyond process mining: From the past to present and future. In: CAiSE. 2010, p. 38--52.
[27] Van Der Aalst, W.. Process Mining: Discovery, Conformance and Enhancement of Business Processes. Springer-Verlag New York Inc; 2011.
[28] White, S.. Introduction to BPMN. IBM Corporation 2004;31. [29] Zur Muehlen, M.. Organizational management in workflow applications--issues and perspectives. Information Technology and Management 2004;5(3):271--291.
[30] Neumuth, T., Kaschek, B., Neumuth, D., Ceschia, M., Meixensberger, J., Strauss, G., et al. An observation support system with an adaptive ontology-driven user interface for the modeling of complex behaviors during surgical interventions. Behavior research methods 2010;42(4):1049.
[31] Scherer, S.. Early career patterns: A comparison of Great Britain and West Germany. European Sociological Review 2001;17(2):119.
[32] Brzinsky-Fay, C., Kohler, U., Luniak, M.. Sequence analysis with Stata. Stata Journal 2006;6(4):435.
[33] Padoy, N., Blum, T., Ahmadi, A., Feussner, H., Berger, M., Navab, N.. Statistical modeling and recognition of surgical workflow. Medical Image Analysis 2010;.
[34] Jain, A.K.. Data clustering: 50 years beyond k-means. Pattern Recognition Letters 2010;31(8):651--666.
[35] Tari, L., Baral, C., Kim, S.. Fuzzy c-means clustering with prior biological knowledge. Journal of Biomedical Informatics 2009;42(1):74 -- 81.
[36] Petitjean, F., Ketterlin, A., Gan¸carski, P.. A global aver-aging method for dynamic time warping, with applications to clustering. Pattern Recognition 2011;44:678--693.
[37] Manning, C., Schutze, H., MITCogNet, . Foundations of statistical natural language processing; vol. 59. MIT Press; 1999.
[38] Neumuth, T., Durstewitz, N., Fischer, M., Strauß, G., Dietz, A., Meixensberger, J., et al. Structured recording of intraoperative surgical workflows. In: SPIE Medical Imaging; vol. 6145. 2006, p. 61450A.
[39] Jannin, P., Morandi, X.. Surgical models for computer-assisted neurosurgery. NeuroImage 2007;37(3):783--791.
[40] Gentric, J., Jannin, P., Trelhu, B., Riffaud, L., Gauvrit, J.. Effects of low dose protocols in neurointerventional procedures: A workflow analysis study. In: European Society of Radiology. 2011,.
[41] James, A., Vieira, D., Lo, B., Darzi, A., Yang, G.. Eye-gaze driven surgical workflow segmentation. International conference on Medical Image Computing and Computer-Assisted Interven-tion (MICCAI) 2007;:110--117.
[42] Nara, A., Izumi, K., Iseki, H., Suzuki, T., Nambu, K., Saku-rai, Y.. Surgical workflow analysis based on staff’s trajectory patterns. In: M2CAI workshop, International conference on Medical Image Computing and Computer-Assisted Intervention (MICCAI). 2009,.
[43] Padoy, N., Blum, T., Feussner, H., Berger, M., Navab, N.. On-line recognition of surgical activity for monitoring in the operating room. In: National Conference on Innovative Applications of Artificial Intelligence. 2008, p. 1718--1724. [44] Bhatia, B., Oates, T., Xiao, Y., Hu, P.. Real-time
identifica-tion of operating room state from video. In: Naidentifica-tional Conference on Artificial Intelligence; vol. 22. 2007, p. 1761.
[45] Blum, T., Feussner, H., Navab, N.. Modeling and seg-mentation of surgical workflow from laparoscopic video. In: International Conference on Medical Image Computing and Computer-Assisted Intervention (MICCAI). 2010, p. 400--407.