HAL Id: hal-01458127
https://hal.sorbonne-universite.fr/hal-01458127
Submitted on 6 Feb 2017HAL is a multi-disciplinary open access
archive for the deposit and dissemination of sci-entific research documents, whether they are pub-lished or not. The documents may come from teaching and research institutions in France or abroad, or from public or private research centers.
L’archive ouverte pluridisciplinaire HAL, est destinée au dépôt et à la diffusion de documents scientifiques de niveau recherche, publiés ou non, émanant des établissements d’enseignement et de recherche français ou étrangers, des laboratoires publics ou privés.
Synthesis, structure and electrochemical properties of
K-based sulfates K 2 M2 (SO 4 )3 with M = Fe and Cu
Laura Lander, Gwenaëlle Rousse, Dmitry Batuk, Claire Colin, Daniel Alves
Dalla Corte, Jean-marie Tarascon
To cite this version:
Laura Lander, Gwenaëlle Rousse, Dmitry Batuk, Claire Colin, Daniel Alves Dalla Corte, et al.. Synthesis, structure and electrochemical properties of K-based sulfates K 2 M2 (SO 4 )3 with M = Fe and Cu. Inorganic Chemistry, American Chemical Society, 2017, 56 (4), pp.2013-2021. �10.1021/acs.inorgchem.6b02526�. �hal-01458127�
1
Synthesis, structure and electrochemical properties of
K-based sulfates K
2M
2(SO
4)
3with M = Fe and Cu
Laura Landera,b,c, Gwenaëlle Roussea,b,c,d, Dmitry Batuka,e, Claire V. Colinf,g, Daniel Alves Dalla
Cortea and Jean-Marie Tarascona,b,c*
a UMR 8260 “Chimie du Solide et Energie”, Collège de France, 11 Place Marcelin Berthelot,
75231 Paris Cedex 05, France.
b Réseau sur le Stockage Electrochimique de l’Energie (RS2E), FR CNRS 3459, France. cSorbonne Universités - UPMC Univ Paris 06, 4 Place Jussieu, F-75005 Paris, France. d Institut Universitaire de France, 1 rue Descartes, 75231 Paris Cedex 05, France. e EMAT, University of Antwerp, Groenenborgerlaan 171, B-2020 Antwerp, Belgium. f Univ. Grenoble Alpes, Institut Néel CNRS, 38042 Grenoble, France.
g CNRS, Institut Néel, F-38000 Grenoble, France.
2 Abstract
Stabilizing new host structures through potassium extraction from K-based polyanionic materials has been proven to be an interesting approach to develop new Li+/Na+ insertion
materials. Pursuing the same trend, we here report the feasibility of preparing langbeinite “Fe2(SO4)3” via electrochemical and chemical oxidation of K2Fe2(SO4)3. Additionally, we
succeeded in stabilizing a new K2Cu2(SO4)3 phase via solid-state synthesis approach. This novel
compound crystallizes in a complex orthorhombic structure that differs from that of langbeinite as deduced from synchrotron X-ray and neutron powder diffraction. Electrochemically-wise the performance of this new phase is limited, which we explain in terms of sluggish diffusion kinetics. We further show that K2Cu2(SO4)3 transforms into
K2Cu3O(SO4)3 on heating and we report for the first time the synthesis of fedotovite
K2Cu3O(SO4)3. Lastly, the fundamental attractiveness of these S=1/2 systems for physicists is
examined by neutron magnetic diffraction, which reveals the absence of a long-range ordering of Cu2+ magnetic moments down to 1.5 K.
Keywords
Langbeinite K2Fe2(SO4)3, sulfates, Cu-based polyanionic compounds, diffusion properties,
3 Introduction
Over the last few years, sustainability has become an overriding factor in the search for new electrode materials. The discovery of the electrochemical activity of LiFePO4 vs. Li+/Li°
back in 1997 was an impetus to further explore polyanionic materials for battery applications.1,2 In this context, the finding of tavorite and triplite LiFeSO
4F with potentials of
3.6 V and 3.9 V vs. Li+/Li0 was an important step forward.3–5 Owing to the attractive
electrochemical performances of the LiFeSO4F polymorphs further research efforts were
undertaken to stabilize novel “FeSO4F” frameworks for Li+ and Na+ insertion. This led to the
discovery of orthorhombic and monoclinic KFeSO4F, which form new polymorphic “FeSO4F”
host structures upon K+ extraction.6–8 Among them, the orthorhombic “FeSO
4F” phase
displayed appealing cycling behavior towards Li and Na. This approach was further extended to phosphate-based phases such as KVPO4F.9
Bearing this in mind, we embarked on the search of new sulfate-based host structures, which could uptake alkali cations. We focused our attention on various A2Fe2(SO4)3 phases
with A=Li, Na, K that present polymorphic “Fe2(SO4)3” frameworks. Li2Fe2(SO4)3 crystallizes in
the Nasicon and anti-Nasicon structures, both displaying a potential of 3.6 V vs. Li+/Li0, while
Na2Fe2(SO4)3 presents the alluaudite-type structure with a potential of 3.8 V vs. Na+/Na0.10–13
Another “Fe2(SO4)3” framework is based on the family of the langbeinite phases having the
general composition A2M2(SO4)3, with A = K, NH4, Rb, Tl and M = Mg, Mn, Ni, Zn, Ca, Fe, Cd
and Co. The langbeinite compounds are derived from the mineral K2Mg2(SO4)3 and have been
vastly studied for their physical properties including antiferromagnetic spin-ordering, electro-optical effects as well as ferroelectric and ferroelastic features.14–21 However, to the best of
our knowledge, their electrochemical properties have not been reported so far. Hence our goal was to explore the feasibility of preparing a stable langbeinite “Fe2(SO4)3” framework
upon K+ extraction from K
2Fe2(SO4)3. Moreover, through the investigation of other langbeinite
A2M2(SO4)3 phases, we have isolated a new K2Cu2(SO4)3 member that presents a noticeably
different crystal structure as compared to cubic K2Fe2(SO4)3. This phase shows limited
electrochemical activity and transport properties. It is thermally unstable and decomposes to form the fedotovite oxysulfate K2Cu3O(SO4)3 above 320°C. Lastly, we examined the possibility
4 of long range magnetic ordering of Cu2+ in K
2Cu2(SO4)3 and K2Cu3O(SO4)3 via low-temperature
neutron diffraction experiments. Experimental part
Laboratory X-ray diffraction (XRD) patterns were recorded with a Bruker D8 Advance diffractometer equipped with a copper source (λCu-Kα1 = 1.54056 Å, λCu-Kα2 = 1.54439 Å) and a
LynxEye detector. For high temperature XRD experiments, the diffractometer was equipped with an Anton Paar HTK1200N furnace. Synchrotron X-ray diffraction patterns were measured in transmission mode (the powder was placed in a Ø=0.7 mm capillary sealed under argon), with a wavelength of =0.4141 Å at the 11BM beam line at Argonne National Lab. Neutron powder diffraction (NPD) experiments were performed on the D1B powder diffractometer at the Institut Laue Langevin, with a wavelength of 2.529 Å and with the powder placed in a Ø=6mm vanadium can. The recorded patterns were refined using the Rietveld22 method as
implemented in the FullProf23,24 program. Bragg peak indexation and structure determination
were performed with help of the Dicvol25,26 and Fox27,28 programs.
For transmission electron microscopy measurements, a FEI Tecnai G2 electron microscope operated at 200 kV was used. For the measurement, the sample was prepared in an Ar-filled glove box by grinding the powder in a mortar in anhydrous hexane and depositing drops of suspension onto holey carbon grids. The sample was transported to the microscope column completely excluding contact with air.
Electrochemical tests were conducted in Swagelok-type cells assembled in an argon-filled glovebox and cycled in a galvanostatic operating mode using a VMP system (Biologic S.A., Claix, France). Lithium metal was used as the negative electrode and the working electrode consisted of a composite of the active material and Carbon SP (Csp) (80:20 wt %), prepared by ball-milling for 15 min in a Spex 8000 miller. The negative and the positive electrode were separated by a Whatman GF/D borosilicate glass fiber sheet saturated with 1 M LiPF6 in
EC:DMC (1:1 weight ratio) (LP30).
A.c. impedance measurements were performed with a Bio-Logic MTZ-35 Impedance Analyzer, in a frequency range of 1 MHz to 0.1 Hz and with an excitation voltage of 100 mV. The
5 measurements were done under argon at various stabilized temperatures ranging from 100 to 450°C.
Results
a) Synthesis and Electrochemistry of K2Fe2(SO4)3
In previous reports, langbeinite K2Fe2(SO4)3 was prepared from an aqueous solution of K2SO4
and FeSO4.19,29 Herein, we simply prepared this phase by ball-milling stoichiometric amounts
of K2SO4 and anhydrous FeSO4 with a Spex 8000 vibratory miller for 1 h. The powders were
placed in a hermetic stainless-steel jar filled in an argon dry box. A ball-to-powder weight ratio of ~30 was used. Afterwards, the composite mixture was annealed at 400 °C for 7 h under argon atmosphere to produce a single phase powder as deduced by X-ray diffraction (XRD). The Rietveld refinement22–24 of as-prepared K
2Fe2(SO4)3 was performed with an initial
structural model constructed from K2Mn2(SO4)3,15 where Mn was replaced by Fe, and all atoms
were freely refined. The final refinement is shown in Figure 1a and indicates that K2Fe2(SO4)3
and K2Mn2(SO4)3 are isotructural. K2Fe2(SO4)3 crystallizes in a cubic unit cell with lattice
parameter a = 10.00476(4) Å. The structure, described in space group P213, consists of isolated
FeO6 octahedra (blue) that are connected to six SO4 tetrahedra (light blue) via their oxygen
(grey) vertices (Figure 1b). The K1 and K2 atoms, which are eight- and six-fold coordinated, respectively, are located in the large cavities of the Fe2(SO4)3 framework. The structural data,
6
Figure 1: Rietveld refinement of the X-ray diffraction pattern of K2Fe2(SO4)3. The red crosses, black line, and green line
represent the observed, calculated and difference patterns, respectively. The positions of the Bragg reflections are shown as vertical blue bars. b) Structure of K2Fe2(SO4)3, where the FeO6 octahedra and SO4 tetrahedra are shown in blue and light
blue, respectively. O and K atoms are illustrated as grey and orange spheres.
Electrochemical tests were conducted in Swagelok-type cells with a lithium anode and a cycling regime of C/20 (1C equals the uptake or removal of 1 Li+ in 1 h). A typical
composition-voltage trace is shown in Figure 2a. On charge, we observe a pseudo-plateau at around 3.9 V vs. Li+/Li0 and a flat plateau at ~4.1 V vs. Li+/Li0, each accounting for approximately 0.2 K+. On
discharge, however, only ~0.2 Li+ can be reinserted resulting in merely 10 % of the theoretical
capacity (129 mAh/g) of K2Fe2(SO4)3. Further optimization trials of the cathode material (e.g.
longer ball-milling, higher Csp content) did not improve the electrochemical performance. To further check the extend of potassium removal, we conducted chemical oxidation of K2Fe2(SO4)3 using NO2BF4 as oxidizing agent in acetonitrile under reflux (~ 80°C) for times
ranging from 5 hours to 2 days. XRD of the resulting K2-xFe2(SO4)3 compound indicates a minor
shift of the Bragg peaks (Figure 2b, blue pattern), as well as a tiny amount of KBF4 (peak
marked with asterisk), resulting from the reaction of NO2BF4 with the extracted K+. However,
its amount did not increase with increasing reaction time, thus confirming the difficulties of K+ extraction encountered during the electrochemical cycling. Lastly, the neat superimposition
of the XRD patterns of the K-deficient samples (Figure 2b) prepared by chemical and electrochemical oxidation indicates that the same amount of K+ is extracted for both routes
and it is limited to values lower than ~0.4 K+ per formula unit (see voltage-composition trace,
Figure 2a). In addition to the poor reversibility observed during the electrochemical discharge, the existence of large voltage polarization suggests sluggish diffusion kinetics. This does not come as a surprise given the high percolation energy of 7.8 eV as calculated by the Bond
7 Valence Energy Landscape (BVEL) approach (described in detail in SI; Figure SI1a).23,31 This
value exceeds by far the BVEL percolation energies of other sulfate-based materials (~0.5 - 3 eV)8,32,33, hence indicating a hampered K+ diffusion. Problems during K+ extraction were
previously assessed for langbeinite K2TiV(PO4)3, where chemical oxidation failed to remove
K+.34 Moreover, it was reported that Li+ and Na+ are too small to generate a stable langbeinite
framework.29 This statement is also confirmed by our unsuccessful trials to prepare
langbeinite A2Fe2(SO4)3 with A=Li or Na using a variety of precursors and methods as well as
ionic substitution of K2Fe2(SO4)3 with LiNO3 and NaNO3. In short, these results show that
K2Fe2(SO4)3 is not a suitable electrode material.
Figure 2: a) Voltage-composition trace of cubic K2Fe2(SO4)3. A in A2Fe2(SO4)3 corresponds to K+ in the first charge and to Li+
onwards. b) XRD pattern of pristine K2Fe2(SO4)3 (orange), chemically oxidized K2-xFe2(SO4)3 (blue), electrochemically
charged K2-xFe2(SO4)3 (purple) and discharged (K,Li)2Fe2(SO4)3 (maroon). The asterisk marks the peak attributed to KBF4.
b) Synthesis, structure and electrochemistry of K2Cu2(SO4)3
Aside from Fe-based sulfate compounds, we recently demonstrated the feasibility to achieve high redox potentials (> 4.6 V vs. Li+/Li0) in Cu-based sulfates/oxysulfates such as
Li2Cu2O(SO4)2.31 Interestingly, Gattow et al.29 predicted that the Cu-based homologue of
K2Fe2(SO4)3 might present a different crystal structure due to the preferential square-planar
coordination of the Jahn-Teller active Cu2+. All together this prompted us to explore the
possibility of stabilizing K2Cu2(SO4)3 and study its properties.
Phase-pure K2Cu2(SO4)3 was successfully prepared by a two-steps solid-state route. First,
stoichiometric amounts of K2SO4 and anhydrous CuSO4 (Alfa Aesar, Reagent Grade), which has
been dried under vacuum at 260 °C for 24 h, were ball milled for 4 h in an Ar-filled ball-mill jar
K+extraction
Li+insertion
8 with a Spex 8000 vibratory miller with a ball-to-powder weight ratio of 25. The obtained mixture was then pressed to a pellet and heated at 300 °C for 20 h under constant argon flow. The resulting powder consists of particles in the sub-micrometer range (Figure SI2). It is worth mentioning at this point that like most of the alkali-based 3d metal sulfates, K2Cu2(SO4)3 is
highly moisture sensitive and decomposes into K2Cu(SO4)2∙6H2O and CuSO4∙5H2O after solely
8 h of air exposure (Figure SI3). It is therefore important to synthesize and handle K2Cu2(SO4)3
under air- and moisture-free conditions.
In the absence of single crystals, the crystal structure of K2Cu2(SO4)3 was solved by combined
synchrotron X-ray and neutron powder diffraction. With help of the Dicvol25,26 program, the
Bragg peaks in the synchrotron XRD patterns could be indexed in an orthorhombic unit cell with the lattice parameters a = 4.81065(1) Å, b = 11.91795(3) Å and c = 18.67516(4) Å and a volume of V = 1070.704(4) Å3. This cell can accommodate four formulae units (Z = 4). We
obtained in total 17 possible space groups that could index the observed reflections. Since no structural model was known for this compound, we performed ab initio structural determination methods for all possible space groups using the Fox27,28 program and compared
the obtained structural models to the experimental SXRD data. During this process, the SO4
tetrahedra were treated as rigid groups. Besides the many possible space groups, the large number of atoms further complicated the search for the correct structural model. The only space group, which indexed all the Bragg peaks obtained by SXRD and resulted in a meaningful structure, was P212121. Furthermore, this symmetry is corroborated by the electron diffraction
data (collected on an FEI Tecnai G2 microscope). The observed reflection conditions h00: h = 2n; 0k0: k = 2n; 00l: l = 2n are consistent only with the space group P212121 (Figure 3a). The
final refinement of K2Cu2(SO4)3 with all atoms freely refined using the Rietveld method as
implemented in the FullProf23,24 program is shown in Figure 3b. The structural data deduced
from this refinement are summarized in Table 2. Moreover, for a more accurate refinement of the O positions, we performed neutron powder diffraction on the D1B powder diffractometer, with a wavelength of 2.529 Å. The Rietveld refinement conducted on the NPD pattern is shown in Figure 3b and fully validates the structural model.
9
Figure 3: a) Electron diffraction data for K2Cu2(SO4)3. In the patterns taken along the main zone axis (square patterns),
reflections violating h00: h=2n; 0k0: k=2n; 00l: l=2n extinction conditions reappear owing to the dynamical effects. The reflection conditions are unambiguously observed when the crystal is tilted away from the zone axis, so that only a single row of reflections fulfills the diffraction conditions (rectangular patterns).b) Rietveld refinement of the synchrotron XRD and neutron powder diffraction patterns of K2Cu2(SO4)3. The red crosses, black line, and green line represent the observed,
calculated and difference patterns, respectively. The positions of the Bragg reflections are shown as vertical blue bars. The second phase in the neutron diffraction pattern stems from the vanadium can.
The 19 independent atoms of K2Cu2(SO4)3 are all located in the 4a general position of the
P212121 space group (Table 2). The structure of K2Cu2(SO4)3 is based on distinct infinite
“Cu2(SO4)3” chains running along [100] and forming a herringbone pattern in the bc plane
(Figure 4a). Each of these chains consists of square-planar CuO4 and square-pyramidal CuO5
10 entities, which are further bridged via SO4 tetrahedra. The K1 and K2 atoms, which are
eight-fold coordinated (Figure 4c), are located in the empty space between the chains. The oxidation states of the atoms calculated by bond valence sum analysis (Table 2) are consistent with what is expected for this composition.
Figure 4: a) Structure of orthorhombic K2Cu2(SO4)3 shown along the [100] axis. The CuOx polyhedra and SO4 tetrahedra are
shown in blue and red, respectively, with the oxygen atoms in grey. The potassium atoms are represented as yellow balls. b) Connectivity of the CuOx polyhedra and SO4 tetrahedra in K2Cu2(SO4)3. c) Local coordination of K1 and K2 with the
respective K-O bond lengths. K1-O1: 2.778(4) Å K1-O7: 3.175(5) Å K1-O8: 3.020(5) Å K1-O8: 3.190(5) Å K1-O10: 2.765(4) Å K1-O11: 2.896(4) Å K1-O11: 2.776(4) Å K1-O12: 2.852(4) Å K2-O1: 2.655(4) Å K2-O3: 2.820(5) Å K2-O3: 2.878(5) Å K2-O4: 2.658(5) Å K2-O6: 2.800(4) Å K2-O7: 2.809(4) Å K2-O8: 2.995(5) Å K2-O9: 2.965(4) Å a) b) Cu(1)O4 Cu(2)O5 c) K2 O1 O7 O8 O6 O3 O4 O9 O3 K1 O12 O11 O10 O11 O1 O8 O7 O8
11 Figure 5 shows the room temperature electrochemical behavior of a Li/K2Cu2(SO4)3
Swagelok-type cell using K2Cu2(SO4)3 ball milled for 15 min with Csp (weight ratio 80:20) as positive
electrode, LP30 as electrolyte and cycled at a C/50 rate. The cell voltage profile (Figure 5a) presents a limited electrochemical activity (x ~ 0.1) being far from reaching the theoretical capacity of 124 mAh/g. The redox process proceeds via one plateau at 3.4 V vs. Li+/Li0 and two
minor sloping contributions at 3.75 V vs. Li+/Li0 on charge and between 2.5-2.8 V vs. Li+/Li0 on
discharge that can be also seen on the dx/dV derivative curve (Figure 5b). We observed that charging the Li/K2Cu2(SO4)3 to higher potentials such as 5 V vs. Li+/Li0 leads to a decomposition
of the active material as deduced from traces of elemental copper on the separator of disassembled cells.
Figure 5: Voltage-composition trace of K2Cu2(SO4)3 cycled at C/50 started in oxidation (orange arrow) (a) and its derivative
curve (b).
We further attempted to chemically remove K+ from K
2Cu2(SO4)3 by oxidation using an excess
of NO2BF4 in acetonitrile. Figure 6 compares the XRD patterns of samples recovered from
electrochemical cells, which were stopped on charge (purple pattern) and discharge (maroon pattern), respectively, with the pattern of the chemically oxidized (blue pattern) and the pristine (orange pattern) samples. They all look alike with no noticeable shift of the Bragg peaks. However, we observe the formation of KBF4 (peaks marked with asterisk) for the
chemically oxidized sample. From a Rietveld refinement (shown in Figure SI4), we could estimate the amount of KBF4 to be 10(4) %, hence implying that ~10 % of K+ was extracted, in
12
Figure 6: XRD patterns of pristine K2Cu2(SO4)3 (orange) and chemically oxidized K2Cu2(SO4)3 using NO2BF4 (blue pattern).
The purple and red XRD patterns were recorded ex situ after charge and discharge of K2Cu2(SO4)3. The peak marked with *
corresponds to KBF4.
To rationalize the poor removal of K+, we calculated the K+ diffusion pathways via the Bond
Valence Energy Landscape (BVEL) approach (Figure SI1b) and deduced an anisotropic diffusion of K+ in this material with percolation energies of 1.59, 2.78 and 6.38 eV along the [100], [010]
and [001] directions, respectively. To provide a real meaning to these values, temperature-dependent a.c. conductivity was measured on a sintered K2Cu2(SO4)3 pellet (Ø 10 mm,
compactness 82%) between ionically blocking gold electrodes (Figure 7a). The measurements were done under argon at various stabilized temperatures ranging from 100 to 450°C in a frequency range of 1 MHz to 0.1 Hz and with an excitation voltage of 100 mV. A typical collected impedance spectrum (see inset Figure 7a) consists of a low frequency tail indicating that the conductivity is mainly ionic with in addition the presence of two semi-circles corresponding to the bulk contribution (high frequency) and the grain boundary (medium frequency). K2Cu2(SO4)3 presents an activation energy of 1.49 eV as deduced by fitting the a.c.
data with the Arrhenius law and an extrapolated room temperature a.c. conductivity of RT =
10-13 S/cm. Compared to other polyanionic cathode materials such as LiFePO
4 and triplite
LiFeSO4F, which show activation energies of 0.6 eV and 0.79 eV, respectively,35,36 K2Cu2(SO4)3
presents rather mediocre conductivity in agreement with the observed electrochemical performances. Note the sudden drop of conductivity of K2Cu2(SO4)3 upon heating at around
13
Figure 7: Temperature dependence of the a.c. conductivity of K2Cu2(SO4)3 and its activation energy Ea deduced from the
Arrhenius equation (a). These activation energies are physically not related to the percolation energies deduced from BVEL. The inset shows the measured impedance spectrum at 363 °C and the circuit used for the fit. The observed drop of conductivity around 380 °C suggests a phase transformation (b).
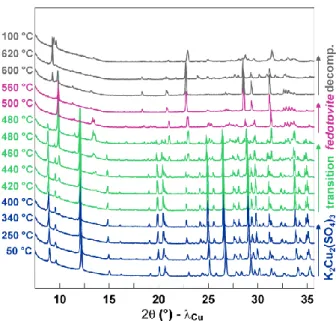
To get more insight into this possible phase transformation, we performed high-temperature
in situ XRD measurements (Figure 8), where K2Cu2(SO4)3 was heated under a steady nitrogen
flow from 50 °C to 620 °C in 20 °C steps and with a ramp of 5 °C/min and cooled down to 100 °C again. The temperature was held constant at each step during the recording of the XRD pattern (1h). Pristine K2Cu2(SO4)3 is stable until 400 °C and presents only a thermal expansion
of the structure. From 420 °C onwards a new peak appears at ~12°, which can be assigned to the mineral fedotovite K2Cu3O(SO4)3. The phase transformation from K2Cu2(SO4)3 to
K2Cu3O(SO4)3 is completed at 500 °C, before the irreversible decomposition of K2Cu3O(SO4)3 at
560 °C. The slightly different transition temperatures seen from impedance measurements and in situ XRD are due to differences in heating ramps and heating dwells. The phase transformation, also confirmed by DSC measurements, can be directly visualized through a colour change from light blue for K2Cu2(SO4)3 to dark green for K2Cu3O(SO4)3 (Figure SI5).
grain boundary bulk
14
Figure 8: High-temperature in situ XRD experiment on K2Cu2(SO4)3, which was heatedfrom 50 °C to 620 °C and cooled down
to 100 °C under nitrogen flow. The blue, green and purple pattern correspond to the pristine K2Cu2(SO4)3, the transition
range (biphasic domain) and to fedotovite K2Cu3O(SO4)3 respectively. The grey patterns correspond to decomposition
products.
c) Synthesis and Structure of K2Cu3O(SO4)3
Fedotovite K2Cu3O(SO4)3 is a volcanic mineral, which was first discovered in Kamchatka,
Russia, after a volcano eruption in 1975/1976.37 It has only been characterized as a natural
mineral, but, to the best of our knowledge, has never been obtained synthetically. We thus report here for the first time its synthesis protocol. For the preparation of K2Cu3O(SO4)3, we
started either from K2Cu2(SO4)3, which was ball milled for 30 min with an excess of CuO (10 %)
(Equation 1), or from the precursors K2SO4, CuSO4 and CuO (Equation 2), which were
ball-milled for 45 min. The mixtures were heated at 500 °C for 30-48 h under argon atmosphere. K2Cu2(SO4)3+ CuO → K2Cu3O(SO4)3 (1)
K2SO4+ CuSO4+ CuO → K2Cu3O(SO4)3 (2)
XRD experiments confirmed the purity of the sample. Rietveld refinements of the SXRD and neutron patterns of synthetically prepared K2Cu3O(SO4)3 were performed using the monoclinic
C2/c structural model previously reported by Starova et al.37 (Figure 9). The obtained
structural data is given in Table 3. The slight differences of the lattice parameters of our prepared fedotovite phase (a = 19.09059(5) Å, b = 9.52853(2) Å, c = 14.18650(3) Å, = 110.63109(19)° and V = 2415.100(9) Å3) as compared to the one reported by Starova et al. (a
15 volume of V = 2396.8(3) Å3)37 might be related to the fact that their structure was solved on
the mineral, which might contain impurities that influence the lattice size.
Figure 9: Rietveld refinement of the synchrotron X-ray powder diffraction (top) and neutron powder diffraction (bottom) of fedotovite K2Cu3O(SO4)3. Red, black and green lines represent the experimental, calculated and difference patterns,
respectively. Bragg positions are shown as blue bars. The second phase in the neutron diffraction pattern stems from the vanadium can.
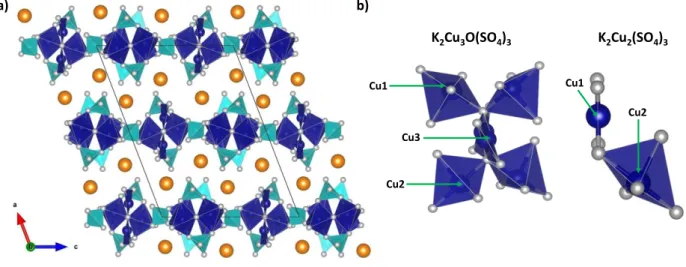
K2Cu3O(SO4)3 adopts a layered-like structure (Figure 10a). The layers are constructed on
Cu(1)O5 and Cu(2)O5 square-based pyramids linked to Cu(3)O4 planar entities via vertices,
forming building blocks (Figure 10b, left) which are connected through SO4 tetrahedral groups.
Potassium atoms are located between the layers. Note that the two coordination modes of copper in this K2Cu3O(SO4)3 structure are also present in K2Cu2(SO4)3 (Figure 10b, right).
16
Figure 10: a) Structure of K2Cu3O(SO4)3, which adopts a layered-like structure as shown along the b-axis. The Cu-based
polyhedra (CuO5 and CuO4) and SO4 tetrahedra are shown in blue and light blue, respectively. Oxygen and potassium atoms
are illustrated as grey and orange spheres. b) Local coordination of Cu-based polyhedra in K2Cu3O(SO4)3 and K2Cu2(SO4)3.
Unfortunately, our trials to remove K+ from K
2Cu3O(SO4)3 (theoretical capacity: 109 mAh/g)
failed, regardless of the route (chemical or electrochemical) and conditions we tried. Nevertheless, since both K2Cu2(SO4)3 and K2Cu3O(SO4)3 compounds are part of the family of S
= 1/2 systems, which have been intensively studied for magnetic properties, we wanted to check for a possible transition into a magnetically ordered state. We therefore recorded neutron powder diffraction patterns at temperatures ranging from 1.6 K to 290 K (Figure SI6). All NPD patterns are superimposable over the whole temperature range (expect for a small shift of peaks resulting from a cell contraction on cooling) implying the absence of magnetic long range ordering. Moreover, the unchanged background at low temperature suggests the absence also of short range correlations. This does not come as a surprise since the topology of the two compounds reveal rather isolated Cu2+ atoms. Further studies on the magnetic
behaviors of these compounds are desirable. Conclusions
In previous reports, new polyanionic host structures for Li+ and Na+ insertion have been
stabilized through K+ extraction from their mother phase. We have here reported an extension
of this concept to the langbeinite K2Fe2(SO4)3 phase, which shows, however, poor
electrochemical activity owing to its structural instabilities upon K+ extraction. Further
exploring the A2M2(SO4)3 family, we synthesized a novel K2Cu2(SO4)3 member via a solid state a) K2Cu2(SO4)3 K2Cu3O(SO4)3 Cu1 Cu2 Cu3 Cu1 Cu2 b)
17 approach that crystallizes in an orthorhombic unit cell (space group P212121) different from
the one of the langbeinite phases. K2Cu2(SO4)3, which presents moderate electrochemical
properties, is shown to transform upon heating to the naturally occurring mineral fedotovite K2Cu3O(SO4)3, which is prepared for the first time synthetically. In light of these findings, we
can conclude that although the approach of stabilizing new host structures from K-based polyanionic materials is highly interesting, it cannot be fully generalized. Lastly, even though K2Cu2(SO4)3 nor K2Cu3O(SO4)3 are suitable as cathode materials, both compounds present a
S=1/2 system and therefore might display interesting magnetic properties. Supporting Information
Details on Bond Valence Energy Landscape (BVEL) calculations and resulting BVELs of K2Fe2(SO4)3 and K2Cu2(SO4)3; low magnification HAADF-STEM image of K2Cu2(SO4)3 particles;
Rietveld refinement of chemically oxidized K2Cu2(SO4)3; pictures of K2Cu2(SO4)3 and
K2Cu3O(SO4)3 powders; neutron powder patterns of K2Cu2(SO4)3 and K2Cu3O(SO4)3. CIF files of
K2Fe2(SO4)3, K2Cu2(SO4)3 and K2Cu3O(SO4)3.
Acknowledgements
We thank Matthieu Courty for performing TGA/DSC measurements. Use of the 11-BM mail service of the APS at Argonne National Laboratory was supported by the U.S. Department of Energy under Contract DE-AC02-06CH11357 and is acknowledged. The French CRG D1B is acknowledged for allocating neutron beamtime. L.L. thanks the ANR “Hipolite” for the PhD funding.
Author Information Notes
18 References
(1) Padhi, A. K.; Nanjundaswamy, K. S.; Masquelier, C.; Goodenough, J. B. Mapping of Transition Metal Redox Energies in Phosphates with NASICON Structure by Lithium Intercalation. J.
Electrochem. Soc. 1997, 144, 2581–2586.
(2) Masquelier, C.; Croguennec, L. Polyanionic (Phosphates, Silicates, Sulfates) Frameworks as Electrode Materials for Rechargeable Li (or Na) Batteries. Chem. Rev. 2013, 113, 6552–6591. (3) Barpanda, P.; Ati, M.; Melot, B. C.; Rousse, G.; Chotard, J.-N.; Doublet, M.-L.; Sougrati, M. T.;
Corr, S. A.; Jumas, J.-C.; Tarascon, J.-M. A 3.90 V Iron-Based Fluorosulphate Material for Lithium-Ion Batteries Crystallizing in the Triplite Structure. Nat. Mater. 2011, 10, 772–779.
(4) Ati, M.; Sathiya, M.; Boulineau, S.; Reynaud, M.; Abakumov, A.; Rousse, G.; Melot, B.; Van Tendeloo, G.; Tarascon, J.-M. Understanding and Promoting the Rapid Preparation of the
Triplite -Phase of LiFeSO4 F for Use as a Large-Potential Fe Cathode. J. Am. Chem. Soc. 2012, 134,
18380–18387.
(5) Ati, M.; Melot, B. C.; Chotard, J.-N.; Rousse, G.; Reynaud, M.; Tarascon, J.-M. Synthesis and Electrochemical Properties of Pure LiFeSO4F in the Triplite Structure. Electrochem. Commun.
2011, 13, 1280–1283.
(6) Recham, N.; Rousse, G.; Sougrati, M. T.; Chotard, J.-N.; Frayret, C.; Mariyappan, S.; Melot, B. C.; Jumas, J.-C.; Tarascon, J.-M. Preparation and Characterization of a Stable FeSO4F-Based Framework for Alkali Ion Insertion Electrodes. Chem. Mater. 2012, 24, 4363–4370.
(7) Ling, C.; Mizuno, F. Mechanistic Study of the Electrochemical Extraction of K+ from KFeSO 4F. J.
Mater. Chem. A 2013, 1, 8000–8006.
(8) Lander, L.; Rousse, G.; Abakumov, A. M.; Sougrati, M.; Tendeloo, G. van; Tarascon, J.-M. Structural, Electrochemical and Magnetic Properties of a Novel KFeSO4F Polymorph. J. Mater.
Chem. A 2015, 3, 19754–19764.
(9) Fedotov, S. S.; Khasanova, N. R.; Samarin, A. S.; Drozhzhin, O. A.; Batuk, D.; Karakulina, O. M.; Hadermann, J.; Abakumov, A. M.; Antipov, E. V. AVPO4F (A = Li, K): A 4 V Cathode Material for High-Power Rechargeable Batteries. Chem. Mater. 2016, 28, 411–415.
(10) Manthiram, A.; Goodenough, J. B. Lithium Insertion into Fe2(SO4)3 Frameworks. J. Power Sources
1989, 26, 403–408.
(11) Wu, Q.; Xu, Y.; Ju, H. New-Type Low-Cost Cathode Materials for Li-Ion Batteries: Mikasaite-Type Fe2(SO4)3. Ionics 2012, 19, 471–475.
(12) Barpanda, P.; Oyama, G.; Nishimura, S.; Chung, S.-C.; Yamada, A. A 3.8-V Earth-Abundant Sodium Battery Electrode. Nat. Commun. 2014, 5.
(13) Oyama, G.; Pecher, O.; Griffith, K. J.; Nishimura, S.; Pigliapochi, R.; Grey, C. P.; Yamada, A. Sodium Intercalation Mechanism of 3.8 V Class Alluaudite Sodium Iron Sulfate. Chem. Mater.
2016, 28, 21-5328.
(14) Zemann, A.; Zemann, J. Die Kristallstruktur von Langbeinit, K2Mg2(SO4)3. Acta Crystallogr. 10, 409–413.
(15) Oelkrug, H.; Brückel, T.; Hohlwein, D.; Hoser, A.; Prandl, W. The Magnetic Structure of the Langbeinite K2Mn2(SO4)3. Phys. Chem. Miner. 1988, 16, 246–249.
(16) Emmenegger, F. Crystal Growth and Electro-Optic Effect of Some Double Sulfates with the Langbeinite Structure. J. Appl. Phys. 1968, 39, 3039.
(17) Hernández-Rodríguez, C.; Geday, M. A.; Kreisel, J.; Glazer, A. M.; Hidalgo-López, A. Optical Birefringence Imaging of the Phase Transition of K2Mn2(SO4)3. J. Appl. Crystallogr. 2003, 36, 914–919.
(18) Speer, D.; Salje, E. Phase Transitions in Langbeinites I: Crystal Chemistry and Structures of K-Double Sulfates of the Langbeinite Type M22+K2(SO4)3, M2+= Mg, Ni, Co, Zn, Ca. Phys. Chem.
Miner. 1986, 13, 17–24.
(19) Windhaus, M.; Mosel, B. D.; Muller-Warmuth, W. Moessbauer Studies of Fe2+ in Iron Langbeinites and Other Crystals with Langbeinite Structure. Z. Naturforschung -J. Phys. Sci.
19 (20) Abrahams, S. C.; Bernstein, J. L. Piezoelectric Langbeinite-Type K2Cd2(SO4)3: Room Temperature
Crystal Structure and Ferroelastic Transformation. J. Chem. Phys. 1977, 67, 2146.
(21) Abrahams, S. C.; Lissalde, F.; Bernstein, J. L. Piezoelectric Langbeinite-Type K2Cd2(SO4)3 Structure at Four Temperatures below and One above the 432°K Ferroelastic–paraelastic Transition. J.
Chem. Phys. 1978, 68, 1926.
(22) Rietveld, H. M. A Profile Refinement Method for Nuclear and Magnetic Structures. J. Appl.
Crystallogr. 1969, 2, 65–71.
(23) Rodríguez-Carvajal, J. FullProf Suite; www.ill.eu/sites/fullprof/; www.ill.eu/sites/fullprof/. (24) Rodriguez-Carvajal, J. Recent Advances in Magnetic Structure Determination by Neutron
Powder Diffraction. Phys. B Condens. Matter 1993, 192, 55.
(25) Boultif, A. History of the Dichotomy Method for Powder Pattern Indexing. Powder Diffr. 2005,
20, 284–287.
(26) Boultif, A.; Louër, D. Indexing of Powder Diffraction Patterns for Low-Symmetry Lattices by the Successive Dichotomy Method. J. Appl. Crystallogr. 1991, 24, 987–993.
(27) FoxWiki - FOX, Free Objects for Crystallography Wiki http://fox.vincefn.net/.
(28) Favre-Nicolin, V.; Cerny, R. FOX, `free Objects for Crystallography’: a Modular Approach to Ab Initio Structure Determination from Powder Diffraction. J. Appl. Crystallogr. 2002, 35, 734–743. (29) Gattow, G.; Zemann, J. Über Doppelsulfate Vom Langbeinit-Typ A<sup>2+</sub>B2+(SO
4)3. Z
Anorg Allg Chem 1958, 293, 233–240.
(30) Bronw, I. D.; Altermatt, D. Bond-Valence Parameters Obtained from a Systematic Analysis of the Inorganic Crystal Structure Database. Acta Crystallogr. 1985, B41, 244–247.
(31) Adams, S. From Bond Valence Maps to Energy Landscapes for Mobile Ions in Ion-Conducting Solids. Solid State Ion. 2006, 177, 1625–1630.
(32) Sun, M.; Rousse, G.; Abakumov, A. M.; Saubanère, M.; Doublet, M.-L.; Rodríguez-Carvajal, J.; Van Tendeloo, G.; Tarascon, J.-M. Li2Cu2O(SO4)2: A Possible Electrode for Sustainable Li-Based Batteries Showing a 4.7 V Redox Activity vs Li+/Li0. Chem. Mater. 2015, 27, 3077–3087.
(33) Lander, L.; Reynaud, M.; Carrasco, J.; Katcho, N. A.; Bellin, C.; Polian, A.; Baptiste, B.; Rousse, G.; Tarascon, J.-M. Unveiling the Electrochemical Mechanisms of the Li2Fe(SO4)2 Polymorphs by Neutron Diffraction and Density Functional Theory Calculations. Phys. Chem. Chem. Phys. 2016,
18, 14509–14519.
(34) Rangan, K. K.; Gopalakrishnan, J. New Titanium-Vanadium Phosphates of Nasicon and Langbeinite Structures, and Differences between the Two Structures toward Deintercalation of Alkali Metal. J. Solid State Chem. 1994, 109, 116–121.
(35) Delacourt, C.; Laffont, L.; Bouchet, R.; Wurm, C.; Leriche, J.-B.; Morcrette, M.; Tarascon, J.-M.; Masquelier, C. Toward Understanding of Electrical Limitations (Electronic, Ionic) in LiMPO[sub 4] (M=Fe, Mn) Electrode Materials. J. Electrochem. Soc. 2005, 152, A913.
(36) Sun, M.; Rousse, G.; Corte, D. D.; Saubanère, M.; Doublet, M.-L.; Tarascon, J.-M. A Fully Ordered Triplite, LiCuSO4F. Chem. Mater. 2016, 28, 1607–1610.
(37) Starova, G. L.; Filatov, S. K.; Fundamensky, V. S.; Vergasova, L. P. The Crystal Structure of Fedotovite, K2Cu3O(SO4)3. Mineral. Mag. 1991, 55, 613–616.
20
Tables
Table 1: Crystallographic data and atomic positions of K2Fe2(SO4)3 deduced from Rietveld refinements of its
X-ray powder diffraction pattern. The isotropic temperature values (Biso) and the results from Bond Valence Sum
(BVS) analyses are listed in last two columns.
Cubic K2Fe2(SO4)3
Space group P213 RBragg = 3.42 % χ2 = 1.50
a = 10.00478(3) Å V = 1001.433(6) Å3
Atom Wyckoff
position x y z Occupancy Biso (Å2) BVS
K1 4a 0.8135(3) 0.8135(3) 0.8135(3) 1 2.21(7) 1.14(1) K2 4a 0.0502(3) 0.0502(3) 0.0502(3) 1 2.21(7) 1.00(1) Fe1 4a 0.3350(2) 0.3350(2) 0.3350(2) 1 1.39(4) 2.19(2) Fe2 4a 0.59432(17) 0.59432(17) 0.59432(17) 1 1.39(4) 1.93(2) S1 12b 0.2210(3) 0.3760(5) 0.0174(4) 1 1.41(6) 6.41(8) O1 12b 0.3108(8) 0.2798(8) 0.9597(7) 1 2.59(9) 2.18(4) O2 12b 0.0845(8) 0.3244(9) 0.0066(7) 1 2.59(9) 2.06(4) O3 12b 0.2353(7) 0.4970(10) 0.9388(11) 1 2.59(9) 2.14(5) O4 12b 0.2540(6) 0.4088(7) 0.1541(9) 1 2.59(9) 2.12(4)
21
Table 2: Crystallographic data and atomic positions of K2Cu2(SO4)3 determined from Rietveld refinements of its
synchrotron X-ray powder diffraction pattern. The isotropic temperature values (Biso) and the results from
Bond Valence Sum (BVS) analyses are listed in last two columns.
Orthorhombic K2Cu2(SO4)3
Space group P212121 RBragg = 4.84 % χ2 = 1.05
a = 4.81065(1)Å b = 11.91795(3) Å c = 18.67516(4) Å V = 1070.704(4) Å3
Atom Wyckoff
position x y z Occupancy Biso (Å
2) BVS K1 4a 0.18250(32) 0.13076(11) 0.40811(7) 1 1.914(39) 1.05(1) K2 4a 0.69591(38) 0.32848(11) 0.18436(7) 1 1.519(40) 1.30(1) Cu1 4a 0.24424(32) 0.48396(5) 0.34274(4) 1 1.330(17) 1.87(1) Cu2 4a 0.24010(22) 0.11442(7) 0.05180(3) 1 1.085(15) 1.94(1) S1 4a 0.24667(54) 0.11663(12) 0.21865(7) 1 0.797(28) 5.82(3) O1 4a 0.16573(91) 0.03348(30) 0.27297(21) 1 1.520(108) 1.93(2) O2 4a 0.07946(73) 0.08287(30) 0.15149(23) 1 0.498(95) 2.08(2) O3 4a 0.20298(113) 0.23147(33) 0.23780(17) 1 1.765(103) 1.98(2) O4 4a 0.54695(74) 0.11448(35) 0.19594(19) 1 0.592(95) 2.05(2) S2 4a 0.20980(42) 0.38040(14) 0.04783(8) 1 1.027(32) 5.96(3) O5 4a 0.19490(104) 0.60269(34) 0.47395(17) 1 1.552(102) 1.80(2) O6 4a 0.31752(84) 0.27285(33) 0.07609(16) 1 0.582(92) 2.08(2) O7 4a 0.89854(76) 0.37610(36) 0.04664(21) 1 1.073(106) 2.05(2) O8 4a 0.29464(111) 0.46651(27) 0.09906(19) 1 1.109(96) 1.80(2) S3 4a 0.23111(46) 0.14077(12) 0.59875(8) 1 0.864(32) 5.94(3) O9 4a 0.06258(72) 0.11974(37) 0.66422(19) 1 0.544(89) 2.00(2) O10 4a 0.18384(109) 0.05074(29) 0.54712(20) 1 1.538(119) 2.15(2) O11 4a 0.16777(78) 0.24878(39) 0.56824(17) 1 0.844(92) 1.99(2) O12 4a 0.03586(73) 0.35793(32) 0.37840(20) 1 0.509(90) 1.96(2)
22
Table 3: Crystallographic data and atomic positions of K2Cu3O(SO4)3 determined from the Rietveld refinement
of its synchrotron XRD pattern. The isotropic temperature values (Biso) were constrained identical for a same
chemical species. Results from Bond Valence Sum (BVS) analyses are listed in last column.
Monoclinic fedotovite K2Cu3O(SO4)3
Space group C2/c RBragg = 2.45 % χ2 = 6.17
a = 19.09059(5) Å b = 9.52853(2) Å c = 14.18650(3) Å = 110.63109(19)° V = 2415.100(9) Å3
Atom Wyckoff
position x y z Occupancy Biso (Å
2) BVS K1 8f 0.32450(11) 0.7499(3) 0.43781(15) 1 2.56(4) 1.42(2) K2 8f 0.19534(12) 0.7348(3) 0.12292(15) 1 2.56(4) 0.85(2) Cu1 8f 0.48124(6) 0.01768(14) 0.34270(8) 1 0.681(13) 2.06(2) Cu2 8f 0.48655(6) 0.47906(14) 0.14051(8) 1 0.681(13) 2.16(2) Cu3 8f 0.42128(6) 0.74630(16) 0.20640(8) 1 0.681(13) 1.99(2) S1 8f 0.50556(13) 0.7495(3) 0.49027(17) 1 0.70(3) 5.92(1) S2 8f 0.64718(12) 0.0260(3) 0.36632(18) 1 0.70(3) 6.02(1) S3 8f 0.35189(13) 0.4676(3) 0.21723(17) 1 0.70(3) 5.90(1) O1 4e 0.5 0.8869(9) 0.25 1 0.81(4) 1.98(16) O2 8f 0.4511(3) 0.8272(5) 0.4080(4) 1 0.81(4) 2.01(2) O3 8f 0.5611(3) 0.6769(5) 0.4581(4) 1 0.81(4) 1.91(3) O4 8f 0.4635(3) 0.6458(5) 0.5274(4) 1 0.81(4) 2.21(3) O5 8f 0.5892(3) 0.0595(6) 0.4100(4) 1 0.81(4) 2.05(3) O6 8f 0.4042(3) 0.4419(5) 0.3152(4) 1 0.81(4) 2.26(3) O7 8f 0.3389(3) 0.6224(6) 0.2028(4) 1 0.81(4) 2.06(3) O8 8f 0.2808(3) 0.3954(5) 0.2008(4) 1 0.81(4) 1.93(3) O9 8f 0.5479(3) 0.8486(5) 0.5736(4) 1 0.81(4) 2.03(2) O10 8f 0.6200(3) 0.0691(5) 0.2584(4) 1 0.81(4) 1.89(2) O11 8f 0.3894(3) 0.4208(5) 0.1415(4) 1 0.81(4) 1.77(3) O12 4e 0.5 0.6045(9) 0.25 1 0.81(4) 2.04(16) O13 8f 0.6611(3) 0.8718(6) 0.3713(4) 1 0.81(4) 1.98(3) O14 8f 0.7160(3) 0.0942(5) 0.4226(4) 1 0.81(4) 2.23(3)
23 For Table of Contents Only
The possibility of extracting K to re-insert Li from langbeinite K2Fe2(SO4)3 is evaluated. A new
copper-based compound K2Cu2(SO4)3 is reported for the first time and its structure
determined. The electrochemical behavior of K2Cu2(SO4)3 against Li is explored, and its relation


![Figure 4: a) Structure of orthorhombic K 2 Cu 2 (SO 4 ) 3 shown along the [100] axis](https://thumb-eu.123doks.com/thumbv2/123doknet/11594333.298901/11.892.176.714.234.1023/figure-structure-orthorhombic-k-cu-shown-axis.webp)