HAL Id: hal-01289487
https://hal.inria.fr/hal-01289487
Submitted on 30 Jun 2016
HAL is a multi-disciplinary open access
archive for the deposit and dissemination of
sci-entific research documents, whether they are
pub-lished or not. The documents may come from
teaching and research institutions in France or
abroad, or from public or private research centers.
L’archive ouverte pluridisciplinaire HAL, est
destinée au dépôt et à la diffusion de documents
scientifiques de niveau recherche, publiés ou non,
émanant des établissements d’enseignement et de
recherche français ou étrangers, des laboratoires
publics ou privés.
Experimental Evaluation of Interference Impact on the
Energy Consumption in Wireless Sensor Networks
Viktor Toldov, Román Igual-Pérez, Rahul Vyas, Alexandre Boé, Laurent
Clavier, Nathalie Mitton
To cite this version:
Viktor Toldov, Román Igual-Pérez, Rahul Vyas, Alexandre Boé, Laurent Clavier, et al..
Experimen-tal Evaluation of Interference Impact on the Energy Consumption in Wireless Sensor Networks. 17th
IEEE International Symposium on a World of Wireless, Mobile and Multimedia Networks
(WoW-MoM), Jun 2016, Coimbra, Portugal. �hal-01289487�
Experimental Evaluation of Interference Impact on
the Energy Consumption in Wireless Sensor
Networks
Viktor Toldov
1,2, Rom´an Igual-P´erez
2, Rahul Vyas
2, Alexandre Bo´e
2, Laurent Clavier
2,3, Nathalie Mitton
1 1Inria, firstname.lastname@inria.fr,2Univ. Lille, CNRS, UMR 8520 - IEMN, firstname.lastname@univ-lille1.fr,3Institut Mines-T´el´ecom, T´el´ecom Lille, firstname.lastname@telecom-lille.fr
Abstract—In the era of Internet of Things (IoT), the develop-ment of Wireless Sensor Networks (WSN) arises different chal-lenges. Two of the main issues are electromagnetic interference and the lifetime of WSN nodes. In this paper, we show and evaluate experimentally the relation between interference and energy consumption, which impacts the network lifetime. We present a platform based on commercially available low-cost hardware in order to evaluate the impact of electromagnetic interference in 2.4 GHz ISM band on energy consumption of WSN. The energy measurements are obtained separately from each electronic component in the node. Interference and energy measurements are conducted in an anechoic chamber and in an office-type lab environment. X-MAC protocol is chosen to manage the Radio Duty Cycle of the nodes and its energy performance is evaluated. The energy consumption transmitter nodes is analyzed particularly in this work. Moreover, this energy consumption has been quantified and differentiated according to the number of (re-)transmissions carried out by the transmitter as well as the number of ACK packets sent by the receiver for a single packet. Finally, we use a model of real battery to calculate the lifetime of the node for operation within different interference level zones. This study lays the basis for further design rules of communication protocols and development of WSNs.
I. INTRODUCTION
Today, in the era of the Internet of Things (IoT), the number of connected objects increases dramatically [1]. Wireless Sen-sor Networks (WSN) constitute a significant part of the IoT. In general, this kind of networks uses the Industrial, Scientific and Medical (ISM) radio bands to transmit data. These bands are license-free, but, on the other hand, a lot of devices share them. This makes the electromagnetic interference an important issue. The different ISM bands are defined by ITU-R [2]. In particular, the worldwide available 2.4 GHz ISM band, also used in WSN, becomes overcharged because of many radio technologies sharing this band, e.g. Wi-Fi, Bluetooth and cordless phones. In [3] the authors observed an increase of the Packet Error Rate (PER) due to the in-band activity of different interference sources (IEEE 802.11g wireless router, Bluetooth headset, microwave oven). Another important issue for WSN is the energy consumption. Most of WSN nodes are powered by batteries. In some cases, it is difficult, if not impossible, to charge or replace these batteries due to application constraints or the location of nodes. These two Work partially supported by CPER NPdC DATA, LIRIMA PREDNET and IRCICA Telecom Platform, especially Mr. R. Kassi and Mr. B. Verbeke.
problems are related. Interference impacts not only the Quality of Service (QoS) and reliability of communications, but also the energy consumption. Interference causes packet losses. In most of WSN applications, lost packets need to be re-transmitted and every re-transmission is an energy waste. In [4] the authors show the relationship between interference and energy consumption. Unlike the simulations and theoretical analysis, we carry out hardware measurements which provide real and accurate values of the energy consumption.
The contribution of this paper is thus as follows: 1) an experimental measurement platform which enables to measure the energy consumption of different components of WSN nodes independently as well as the interference level and device state; 2) quantification of the relationship between in-terference and energy consumption from an experimental point of view; 3) experimental evaluation of the energy performance of the X-MAC protocol [5]; 4) energy measurements for each component of the WSN node as the one of the radio module to exclude the activity of other circuits on the measurements. The remainder of this paper is organized as follows: Sec-tion II presents a review of related works, SecSec-tion III explains the structure of our measurement platform and Section IV describes the experimental setup. The obtained results are provided and analyzed in Section V. Finally, Section VI concludes this paper and describes our future work.
II. MOTIVATION ANDSTATE OF THE ART
If the impact of interference on the QoS in WSN is de-scribed in literature, the consequence on energy consumption is not obvious. In this paper, we focus on the impact in 2.4-GHz band on the energy consumption of WSN nodes. The coexistence of several wireless communication technologies in the 2.4-GHz band as Wi-Fi (IEEE 802.11), IEEE 802.15.4, Bluetooth, wireless cameras, among others, as well as other sources of interference (e.g. microwave oven) in a same envi-ronment is a serious issue. [6] and [7] studied it by calculating the packet reception rate (PRR) according to the interference level and the technology selected. [3] focuses on the impact of Wi-Fi, Bluetooth and microwave ovens on the PER of ZigBee (IEEE 802.15.4) transmitters. Besides [8] presents the impact of the interference caused by IEEE 802.11g/n technologies on IEEE 802.15.4 networks. They calculate the PRR according to different parameters as the selected IEEE 802.15.4 channel,
distance or angle between nodes and interference makers. However, none of these works investigates the relation between interference and energy consumption.
[4] illustrates the increase of energy consumption due to interference by calculating the excess energy through a home automation scenario that features a simple re-transmission without any radio duty cycle (RDC) protocol. Energy con-sumption of multiple retransmissions is only estimated as a product of the energy of single transmission by the number of transmissions, which, as we will show, is not necessarily true. None of these works studied experimentally the energy con-sumption neither combined the energy and interference mea-surements. This paper experimentally studies the interference from real devices in relation with the energy consumed by the nodes of WSN when the retransmissions and the packet loss happen. Moreover, unlike the mentioned studies, we assess the energy consumption of every physical (re)transmission.
Another contribution of this work is the analysis of the energy consumption of each single module of a node. An oscilloscope [9] or a commercial data acquisition module [10] are frequently used for this type of studies. [11] proposes a solution with energy analyzer integrated in the node itself. [12] uses a non-invasive power meter (Nemo) to integrate a series of shunt resistors and communicate the current level of energy. All these examples carry the energy measurements out for the whole node. [13] proposes a software solution to estimate the energy consumption but they confirm the importance of dis-tinguished measurements for each component independently. Indeed, some components of the circuit of the WSN node can alter the values of current drain of other components.
III. DESCRIPTION OF THE PLATFORM
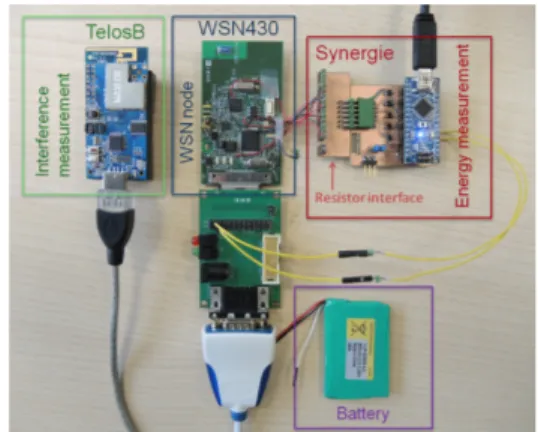
Two sets of devices were used in our experiments: for the transmission (TX) and for the reception (RX). Both sets are composed of three different devices (Fig. 1):
1) WSN430 sensor node [14], as the node under evaluation. It contains an MSP430 microcontroller, a CC2420 radio, luminosity and temperature sensors, a microphone and 3 LEDs and can be controlled by embedded operating systems (OS) e.g. Contiki or TinyOS.
2) TelosB mote [15] to measure the interference. Similar to WSN430, it is programmed with a Contiki code that reads Received Signal Strength Indicator (RSSI) values at the center frequency of the channel used by the WSN430 nodes, providing average values of electromagnetic energy measured during 128µs intervals. In our case, we were able to achieve an operating rate of 4000 samples per second.
3) Synergie platform [16] developed at IRCICA lab to accurately measure the energy consumed by each component of a node. It is based on commercially available low-cost and low-power components and consists of a 10-bit Analog-to-Digital Converter (ADC) embedded in an ATmega328P microcontroller and five operational amplifiers ZXCT1086 to enable five independent measurements. To recover the energy measurements from the node, Synergie takes the voltage from the terminals of resistors added before the power supply input
Fig. 1: Elements of the measurement platform. of each component of the circuit. The node under evaluation and the measurement platform are connected by the resistor interface. The node is also connected to the Synergie platform via General Purpose Input-Output (GPIO) lines in order to synchronize energy measurement with different states (e.g. be-ginning of the (re-)transmission, dropped packet). GPIO lines provide this information directly from the code programmed in the micro-controller of WSN430. The measured values and GPIO codes are transmitted through a serial link to a computer which assesses the energy consumption.
In this work, we analyze the average values of RSSI and energy consumption for each application layer packet (includ-ing retransmissions). These values are calculated between the end of previous packet and the end of current packet which are delimited using GPIO signals. The timestamp values are used to estimate the packet duration.
IV. EXPERIMENTAL SETUP
We have run a unicast communication between two Contiki-driven WSN430 nodes with the Rime protocol [17] at net-work layer, X-MAC RDC and Carrier Sense Multiple Access (CSMA) Medium Access Control (MAC) algorithm and IEEE 802.15.4 [18] data packets. Packets generated every second include 19-byte payload, 6-byte Rime header and 15-byte MAC header (total packet size of 40 bytes) stored in a 24-packet capacity buffer before sending. Following X-MAC protocol, TX wakes up when it has a packet to transmit and sends a sequence of beacons (X-MAC preamble) containing RX MAC address. Once awaken, this latter decodes the MAC address from the beacon and sends an early acknowledgment (11-byte ACK) back to TX. TX node can then start to send its data packet, acknowledged by RX in case of correct reception. Otherwise, TX repeats the procedure, after a random back-off time, up to 3 times. After 3 non-ACKed transmissions, the current data packet is dropped. RX wakes up every 125 ms to check whether there is a packet to receive on the medium or not. We performed two similar sets of measurements: the first one in an anechoic chamber (ideal case) and another in an office environment (real case).
A. Ideal case
Ideal case experiments were run in an anechoic chamber to study the behavior of TX and RX nodes without any external sources of interference. Then, we add progressively up to three interfering XBee IEEE 802.15.4 nodes that generate 100-byte packets on the same channel every 10 ms. Distance between TX and RX nodes is 3.5 meters whereas the interfering nodes are situated 20 cm away from TX.
B. Real case
TX, RX and interfering XBee modules are now placed in a laboratory environment subject to surrounding sources of interference, as Wi-Fi or microwave oven. The distance between TX and RX nodes is still set to 3.5 meters but the interfering nodes are situated further from TX node. The goal of this change of position is to study the system behavior in a realistic scenario with interfering nodes situated at realistic positions.
C. Measurement approach
In this subsection, data measurements are described for the ideal case. We collect packet statistics on the number of re-transmissions (on TX side) and of received duplicated packets (on RX side) for each generated packet. and show them in Table I where each row represents the number of physical transmissions of a single packet. Packet ’1’ corresponds to the situation when a packet is sent only once, i.e. well received by RX and the ACK sent by RX is well received by TX. This is the ideal situation. Packet type ’2’ (resp. 030) corresponds to two (resp. 3) transmissions of a packet, whether data or an ACK packet(s) is lost. For packet type ’4’, three transmissions are done but TX never receives the ACK. Each column in Table I corresponds to the number of times a single packet is received by RX. Packet type ’1’ describes the situation when a packet is received once, the best situation. Packet type ’2’ (resp. ’3’) stands when a single packet arrives twice (resp. ’3’ times) to RX (loss of an ACK). Finally, packet type ’4’ corresponds to ”no packet received”.
We can see that most of the transmitted packets correspond to the combination ’1’-’1’, where the used format is ’TX’-’RX’, i.e. type of packet on TX and in RX sides resp.. ’1’-’1’ represents the ideal situation. ’2’-’2’ situation appears rarely because of the short ACK length. We observe as well that ’3’-’2’ occurs less often than ’3’-’1’ whereas ’3’-’3’ appears only once in this example. Indeed, when the channel occu-pancy significantly increases because of interfering signals, the probability to lose a data frame is higher than to lose an ACK, due to the difference of size. As the case of ’3’-’3’, the combination ’4’-’3’ is unlikely to appear since the probability TABLE I: Nb of transmissions (TX) and received packets (RX).
’1’ (1RX) ’2’ (2RX) ’3’ (3RX) ’4’(0RX) ’1’ 1 TX 745
’2’ 2 TX 203 24
’3’ 3 TX (success) 131 20 1
’4’ 3 TX (fail) 77 10 0 330
to lose three consecutive ACK messages while receiving three duplicated data frames is very small. Therefore, ’4’-’3’ never appears in this experiment. Finally, ’4’-’4’ corresponds to the situation when the interference in the channel makes the communication impossible. No data packets are received by RX and, then, ACK packets are not sent.
V. MEASUREMENT RESULTS
In this section, measurement results for both, ideal and real cases, are presented and analyzed focusing on TX.
A. Ideal case
Synchronized measurements of energy consumption of the radio module, interference level and packet transmission statis-tics are presented in Fig. 2a which shows the average energy consumed by radio as a function of the RSSI for each packet. The total number of packets for each type (’1’, ’2’, ’3’ and ’4’) is indicated in the legend. These different packet types of transmissions are presented by different colors (see Table I). We can notice three distinguished sets of points. The first set is situated in the zone of low interference (around −95 dBm) and low energy consumption. This set contains the packets successfully received after one transmission and only one packet retransmitted once. These packets were transmitted during the first part of the experiment, carried out without any interference (thanks to anechoic chamber ideal characteristics), which explains the high transmission success rate. Second set of points is situated around interference level of −83 dBm. So, the gap between these two sets of points is bigger than 12 dB. No packets are situated in this zone because the interfering XBee node is switched on suddenly. The second set of points corresponds to the cases when one to two nodes interfere. In this case, we can observe an important number of packets retransmitted once or twice (types ’2’ and ’3’ resp.) as well as dropped packets (type ’4’). Average energy consumption is also significantly increased. The third set of points is situated near the interference level of −72 dBm (three interfering nodes) where dropped packets prevail over other packet types. B. Real case
Similar graph is provided for the real case. Fig. 2b rep-resents different types of packets as a function of energy consumption and measured RSSI on TX side. As for the ideal case, we can clearly notice three sets of points but with a significant variance of RSSI values due to the presence of signal reflections and external sources of interference. The same explanation also holds for the presence of retransmitted and lost packets in the low interference zone, where no XBee module is active. In this case, this zone corresponds to the set of points around −93 dBm RSSI level in Fig. 2b.
C. Measurement analysis
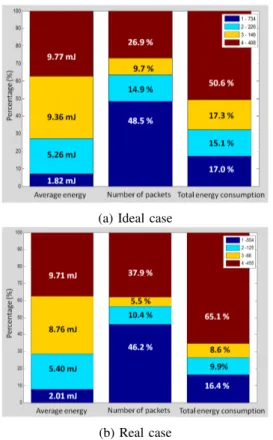
Fig. 3 represents the average energy, the distribution of different types of packets and the total energy consumed by each type of packet during the experiment at the TX side for ideal and real cases. The total energy consumption per type
(a) Ideal case
(b) Real case
Fig. 2:Energy consumption vs RSSI per packet type
(a) Ideal case
(b) Real case
Fig. 3: Energy, nb packets and total energy per packet type on TX.
of packet is calculated from the average energy consumption and the number of packets.
From Fig. 3, we can notice that the distribution of the total energy consumed by the TX device is different in ideal and real cases. However, the average energy consumed for each packet type is almost the same in both scenarios. The difference of total energy consumption is due to a higher packet loss rate in the real case. We observe also that in the ideal case, half of the total energy (50.6%) used by the radio module during the entire experiment was related to dropped packets (type ’4’). In other words, near 50% of the TX node energy is wasted even though only the quarter of packets (26.9%) is
lost (packet type ’4’). The real case is even worth: we observe 65.1% of wasted energy because of this type of packets. On the other hand, we can notice that for both, ideal and real cases, the first-try acknowledged packets (best case) represent almost half of the sent packets (48.5% and 46.2% resp.). Even so this is the largest group of packets, it represents only 17% of the energy consumption in the ideal case and 16.4% in the real case. Another important observation is related to the low percentage of packets successfully acknowledged after three trials (9.8% for ideal and 5.5% for real case). Since the number of transmissions is limited to three, after two trials, the only possible options are success or fail (packet type ’3’ and ’4’ resp.). We can notice that the percentage of failure after two unsuccessful transmissions is much higher than the percentage of success. That impugns the pertinence of a third transmission. The percentage of success after second trial is also relatively low comparatively to first-time acknowledged packets. This questions the efficiency of the retransmission policy when the interference is high.
D. Lifetime evaluation depending on RSSI
The main objective of this study is to show the impact of the interference on the energy consumption of the node. For that, based on experiment data, we calculate the relative frequencies or percentage of number for each packet type, with different values of RSSI.
1) Ideal case: According to the measurements of energy consumption and RSSI of the packets obtained on TX side for the ideal case, as shown in Fig. 2a, we calculate the distribution of the type of packets (’1’, ’2’, ’3’ and ’4’) over different RSSI windows. Generally, the windows are chosen by starting from −95 dBm and by increasing with a step of 5 dB. In the ideal case, no packets are situated in the [−90, −85] dBm window, then, this window is merged with the [−95, −90] dBm window. Fig. 4 shows the distribution of the packets with the exact values of these percentages.
In Fig. 4, we observe that the type ’1’ packets (in dark blue) in the [−95, −85] dBm window correspond to almost 100% of packets. This is coherent because the experiment was completed in the anechoic chamber. In the [−85, −80] dBm window, the percentage of packets ’1’ decreases considerately
but continues to be the predominant type. The number of other packet types is increased significantly, especially types ’2’ and ’4’ with a relative frequency of 23.3% and 24.7%, resp. In the [−80, −75] dBm window, packets ’1’ decrease to 23% whereas type ’2’ and, mainly, ’4’ continues to increase. The [−75, −70] dBm window corresponds to the zones where the interference becomes higher due to the activity of the three interfering XBee modules. In this window, the dominant packet is ’4’ with 72.5%, which means three out of four packets sent with this level of interference are lost despite three transmission trials. We also observe the low percentage of packet type ’3’ in all the windows. This constitutes an important issue because the probability to receive a packet successfully after three tries is low while the energy consumed by this type of packet is very high. At this point, we can conclude that having transmission limit set to three is not efficient in case of high interference. So, decreasing the maximal number of transmissions can help to save energy.
The average energy consumption is calculated according to the level of interference (see Table II). A packet transmitted with an interference level situated in the [−75, −70] dBm window will consume 4.6 times more in average than a packet sent when the RSSI value does not exceed -85 dBm.
Next, we evaluate the number of packets that TX node is able to send until total discharge of a given battery for every RSSI window to estimate the lifetime of the node. We have chosen a real 850-mAh TCL PL-383562 polymer Li-ion battery modeled by Chen and Rincon-Mora [19]. They give the discharge equation of a real battery and calculate the State-of-Charge (SOC) where the voltage decreases below a threshold which corresponds to near 5% of the SOC. Below that voltage, the circuit is not operational. Then, the maximum amount of energy used to supply the circuit corresponds to about 95% of the total energy stored in the battery. Based on this result and the average energy consumption per RSSI window, we calculate the maximum number of packets transmitted and the estimated node lifetime with respect to the interference level, as presented in Table II. The lifetime of the node decreases dramatically from 46.8 days in the [−95, −85] dBm window to 20.2 days in [−85, −80] dBm. The lifetime continues to decrease up to 16.2 days if the interference level in the channel stays in the [−75, −70] dBm window.
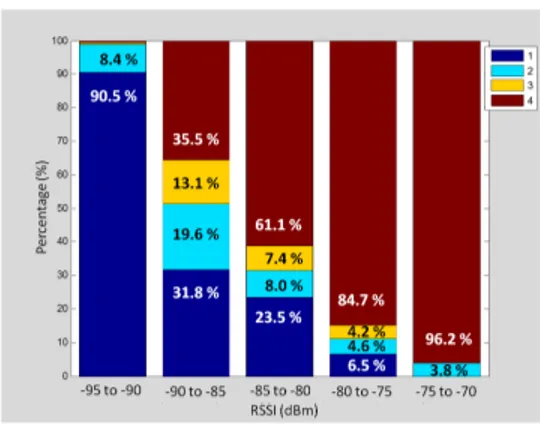
2) Real case: Fig. 5 represents the distribution of the different types of packets in the real case for 5 interference zones from −95 dBm to −70 dBm with the step of 5 dB.
We observe different behaviors in each window. In the zone with lowest interference level ([−95, −90] dBm), 99.3% of transmissions are successful (packets ’1’, ’2’ and ’3’) against
TABLE II: Avg. energy, maximum number of transmitted packets and lifetime of the node per RSSI window - Ideal case.
RSSI (dBm) -95 to -85 -85 to -80 -80 to -75 -75 to -70
Avg. energy (mJ) 1.84 5.71 6.74 8.47 Num. of packets (×106) 5.23 1.68 1.42 1.13
Lifetime (days) 46.8 20.2 18.2 16.2
Fig. 5:Packet distribution per RSSI window on TX - Real case.
TABLE III:Avg. energy, maximum number of transmitted packets and lifetime of the node per RSSI window - Real case.
RSSI (dBm) -95 to -90 -90 to -85 -85 to -80 -80 to -75 -75 to -70
Energy (mJ) 2.37 6.29 7.48 8.97 9.54
Packets (×106) 4.04 1.52 1.28 1.07 1.01
Lifetime (days) 34.4 18.8 17.1 15.7 15.2
90.5% of successful transmission with only one try (packet ’1’). Due to the external sources of interference, this is less than in the ideal case, where it reaches 99.7%. The percentage of packets ’1’ decreases in an exponential manner until it reaches 0% in the highest interference zone. At the same time, the percentage of packets ’4’ increases slightly while the decrease of packet ’1’ is more significant because of the presence of types ’2’ and ’3’ in −90 – −75 dBm RSSI window. Other aspect to notice is that packet type ’3’ have the smallest percentage of appearance in all RSSI windows, as in the ideal case. Also, it is important to notice that the percentage of packet type ’4’ in windows with the maximum of interference, [−80, −75] dBm and [−75, −70] dBm, is 84.7% and 96.2%, respectively. This means that the probability to transmit a packet successfully is very low. Then, we should avoid sending the packets when the interference reaches these levels in order to improve the energy efficiency.
Now, we calculate the number of packets that TX can send with a 850mAh battery supplying the node, as in ideal case. The resulting values of the average energy, the number of packets and the lifetime of the node per RSSI window are presented in Table III. We observe that four times more packets can be sent in conditions of low interference in comparison with the highest interference conditions. The maximum life-time (34.4 days) is more than the double of the expected lifetime in the case of the highest interference level (15.2 days). Finally, if we compare ideal and real cases, lifetime of the node is shorter in all the RSSI windows of the real case due to the interference caused by the external sources.
E. Discussion
One of the results in [20] is the experimental evaluation of success rate of data packet transmission after failed X-MAC early ACK handshake. For this case the authors observe a
very low success rate of 2%. In our work we notice similar results, but in case of successive transmissions after fails. From Fig. 3b we observe the success rate of 5.5% after two unsuccessful transmissions (type ’3’ packets). This observation is also related to the second conclusion in [20]: X-MAC preamble interruption after noise perception could decrease significantly the packet loss rate (from 50% to 33%). Thus, postponing of the data transmissions towards the periods with low level of interference could increase the success rate and decrease the energy consumption of the nodes. However, this technique is not suitable for some applications with real-time constraints, e.g. an event-driven alarm.
VI. CONCLUSION AND FUTURE WORK
In this work, we have experimentally evaluated the impact of interference on the energy consumption of transmitter nodes with the example of X-MAC RDC protocol and CSMA MAC strategy. According to the IEEE 802.15.4 standard, transmit-ter node can carry out up to three transmissions for each application layer packet. Never acknowledged packets at the transmitter side increase dramatically the energy consumption of the devices and, thus, decrease the lifetime. We show that the maximum number of three transmissions of an application layer packet is not energy-efficient because the energy con-sumed by the transmitter node for three tries is much higher than for one and two tries. Moreover, the results show that the probability to have a well-received packet after two tries is near to 5% in average and 0% in highest interference window for real case. Then, the third transmission can be removed in order to reach a longer lifetime of the node at the expense of slightly lower packet delivery rate.
We note that the broadly used actual CSMA MAC strat-egy completed by X-MAC RDC protocol cannot solve this problem and avoid useless and energy inefficient unsuccessful transmissions. Development of a dynamically adaptable MAC protocol is, thus, required. For example, the current RSSI value can be used as input information for the algorithm to dynamically modify the communication parameters (e.g. max. number of retransmissions, CCA threshold) before sending a packet.
The results of this study could be also used to adjust the parameters of upper layer protocols, as routing path or data resolution for the application layer. It is also possible to develop a cross-layer solution to extend the lifetime in the more efficient way by adjusting the parameters of all layers in coordinated manner.
In our future work, we consider investigating the impact of other sources of interference (e.g. Wi-Fi, microwave ovens) on energy consumption of the nodes running other RDC and MAC protocols. We plan to develop and test an adaptable MAC protocol by using the techniques described above. An interference classification approach [21] can also be used to extend the adaptability of the MAC protocol to the cases of other types of interference sources.
REFERENCES
[1] D. Evans, “The Internet of Things. how the next evolution of the Internet is changing everything,” In White Paper of Cisco Internet Business Solutions Group (IBSG), 2011.
[2] ITU-R, “ITU radio regulations,” vol. 1, 2012.
[3] W. Guo, W. Healy, and M. Zhou, “Impacts of 2.4-GHz ISM band interference on IEEE 802.15.4 wireless sensor network reliability in buildings,” IEEE Trans. on Instrumentation and Measurement, 2012. [4] J. Rohde and T. Toftegaard, “Mitigating the impact of high interference
levels on energy consumption in wireless sensor networks,” in Inter. Conf. on Wireless Communication, Vehicular Technology, Information Theory and Aerospace Electronic Systems Techn. (wVITAE), 2011. [5] M. Buettner, G. V. Yee, E. Anderson, and R. Han, “X-MAC: A short
preamble MAC protocol for duty-cycled wireless sensor networks,” in Proc. Int. Conf. on Embedded Networked Sensor Systems, 2006. [6] A. Sikora and V. F. Groza, “Coexistence of IEEE802.15.4 with other
systems in the 2.4 GHz-ISM-Band,” in Proc. of the IEEE Instrumenta-tion and Measurement Technology Conf., 2005.
[7] A. Hithnawi, H. Shafagh, and S. Duquennoy, “Understanding the impact of cross technology interference on IEEE 802.15.4,” in Proc. of the 9th ACM Int. Workshop on Wireless Network Testbeds, Experimental Evaluation and Characterization, 2014.
[8] M. Petrova, L. Wu, P. Mahonen, and J. Riihijarvi, “Interference measure-ments on performance degradation between colocated IEEE 802.11g/n and IEEE 802.15.4 networks,” in Proc. Conf. on Networking, 2007. [9] K. Shinghal, A. Noor, N. Srivastava, and R. Singh, “Power
measure-ments of wireless sensor networks node,” Int. Journal of Computer Engineering & Science, 2011.
[10] C. Antonopoulos, A. Prayati, T. Stoyanova, C. Koulamas, and G. Pa-padopoulos, “Experimental evaluation of a WSN platform power con-sumption,” in Proc. of the IEEE Int. Symposium on Parallel Distributed Processing, (IPDPS), 2009.
[11] E. Capo-Chichi, H. Guyennet, J.-M. Friedt, I. Johnson, and C. Duffy, “Design and implementation of a generic hybrid wireless sensor network platform,” in Proc. of IEEE Conf. on Local Computer Networks, 2008. [12] R. Zhou and G. Xing, “Nemo: A high-fidelity noninvasive power meter system for wireless sensor networks,” in Proc. of the ACM/IEEE Int. Conf. on Information Processing in Sensor Networks (IPSN), 2013. [13] A. Dunkels, F. ¨Osterlind, N. Tsiftes, and Z. He, “Software-based
sensor node energy estimation,” in Proc. of Inter. Conf. on Embedded Networked Sensor Systems, 2007.
[14] A.-S. Tonneau, N. Mitton, and J. Vandaele, “A survey on (mobile) wireless sensor network experimentation testbeds,” in Proc. of the IEEE Int. Conf. on Distributed Computing in Sensor Systems (DCOSS), 2014. [15] J. Polastre, R. Szewczyk, and D. Culler, “Telos: Enabling ultra-low power wireless research,” in Proc. of Int. Symposium on Information Processing in Sensor Networks, 2005.
[16] R. Igual-Perez, A. Bo´e, N. Rolland, and L. Clavier, “Experimentation and modeling of node energy consumption in wireless sensor networks,” in Nationales du R´eseau Doctoral en Micro-Nano´electronique, 2014. [17] A. Dunkels, “Rime — a lightweight layered communication stack for
sensor networks,” in Proc. of the European Conf. on Wireless Sensor Networks (EWSN), Poster/Demo session, 2007.
[18] IEEE Std 802.15.4-2006, IEEE Standards Association, 2006.
[19] M. Chen and G. A. Rincon-Mora, “An accurate electrical battery model capable of predicting runtime and I-V performance,” IEEE Trans. on Energy Conversion, 2006.
[20] J. Beaudaux, A. Gallais, J. Montavont, T. Noel, D. Roth, and E. Valentin, “Thorough empirical analysis of X-MAC over a large scale internet of things testbed,” Sensors Journal, IEEE, 2014.
[21] B. Bloessl, S. Joerer, F. Mauroner, and F. Dressler, “Low-cost interferer detection and classification using TelosB sensor motes,” ACM SIGMO-BILE Mobile Computing and Communications Review, 2012.