HAL Id: hal-00879544
https://hal.archives-ouvertes.fr/hal-00879544
Submitted on 13 Nov 2013
HAL is a multi-disciplinary open access
archive for the deposit and dissemination of
sci-entific research documents, whether they are
pub-lished or not. The documents may come from
teaching and research institutions in France or
abroad, or from public or private research centers.
L’archive ouverte pluridisciplinaire HAL, est
destinée au dépôt et à la diffusion de documents
scientifiques de niveau recherche, publiés ou non,
émanant des établissements d’enseignement et de
recherche français ou étrangers, des laboratoires
publics ou privés.
Polymer Optical Fiber
Linning Peng, Sylvain Haese, Maryline Hélard
To cite this version:
Linning Peng, Sylvain Haese, Maryline Hélard. Optimized Discrete Multitone Communication Over
Polymer Optical Fiber. IEEE/OSA Journal of Optical Communications and Networking, IEEE, 2013,
Volume 5 (Issue 11), pp.1313-1327. �hal-00879544�
Abstract— In this paper, we propose an overall
optimization of discrete multi-tone transmissions (DMT) over polymer optical fiber (POF). The optimization is carried out from both theoretical and experimental approach. At first, the parameters of the POF channel characteristics, resonant cavity light emitting diode (RC-LED) dynamic non-linearity performance, and analog-to-digital converters effective number of bits (ENOB) in our digital storage oscilloscope are measured. From the measured results, we investigate the channel capacity of a 50 m step-index POF system. Then the optimal DMT bandwidth is theoretically derived. On the other hand, we optimize the system with different experimental setups. The optimal cyclic prefix length and RC-LED optimal working current are given. The ENOB can be improved by oversampling and averaging. The optimal oversampling factor is discussed. Furthermore, a joint DMT clipping and subcarrier number optimization is synthetically investigated. Based on the proposed approaches, an optimized DMT gigabit transmission over a real 50 m POF channel employing low-cost components is presented. Finally, a methodology for the practical design of the DMT transmission over POF is concluded.
Index Terms— Discrete Multi-tone; Polymer Optical
Fiber; Light Emitting Diode; System Optimization; Bit-loading; Effective Number of Bits; Non-linearity; Peak-to-Average Power Ratio; Clipping;
I. INTRODUCTION
ecently, polymer optical fiber (POF) has become more and more popular for short range optical communications [1]. Compared to traditional silica based multi mode fiber (MMF) and single mode fiber (SMF), POF has the advantages of easier connection and bend insensitive. As one of the research issues in the seventh framework program (FP7) “Architectures for Flexible Photonic Home and Access networks” (ALPHA) [2], POF is demonstrated to be a competent solution for Gigabits home The authors are with Institute of IETR (Electronic and Telecommunications in Rennes), INSA (National Institute of Applied Sciences) of Rennes, Rennes 35700, France (E-mails: {linning.peng, sylvain.haese, maryline.helard}@insa-rennes.fr).
networking. It is also worth noting that, in a foreseeable future, POF could be one of the most economic solutions for home networking, compared to existing copper based category 5 cable (Cat-5e) solution, and optical MMF, SMF solutions [3].
In past decades, on-off keying (OOK) modulation was used in typical POF communications [4]. More recently, multi-carrier modulation techniques are enrolled to explore the throughput in POF channels [1][5-6]. Derived from the generally well-known orthogonal frequency division multiplexing (OFDM) in wireless communications [7], discrete multi-tone (DMT) is a baseband version of multi-carrier modulation technique, which has been already used for asymmetric digital subscriber line (ADSL) communications [8]. As numerous subcarriers are distributed in the whole transmission bandwidth, modulations with different orders can be allocated according to the channel frequency response, which is a significant advantage in DMT systems [9]. Many of the research institutes have demonstrated their works employing DMT in POF [10-18]. Most of them reach the fastest transmission rate records with the existing materials and components [14][16][18].
However, compared to traditional OOK modulation, DMT modulation is more sensitive to the experimental setup impairments. The non-linearity phenomenon in resonant cavity light emitting diode (RC-LED) causes distortions to DMT signals [19-21]. Furthermore, DMT modulation requires high bit resolution of digital-to-analogue converters (DAC) and analog-to-digital converters (ADC) [22]. In most POFs experiments adopting off-line processing, an arbitrary waveform generator (AWG) and a digital storage oscilloscope (DSO) were used to meet the requirements of high sampling rate and bit resolution of DAC/ADC [1][5][12-18]. It is worth noting that the quantization noise due to the limited effective number of bits (ENOB) in ADC of DSO is a significant limitation of overall performance in optical communications [23]. Furthermore, like most of the multi-carrier modulation systems, DMT modulation results in large peak-to-average power ratio (PAPR) [24], which thus leads to higher required ENOB in DAC/ADC. Therefore PAPR reduction techniques are needed for high data-rate DMT transmission over POF, such as clipping [25-28]. Last but not least, although DMT has the advantage of adaptive transmission rate, it is difficult to choose the optimal transmission bandwidth for DMT in a determined POF channel. The aforementioned problems reveal that designing an appropriate DMT
Optimized Discrete Multi-tone
Communication over Polymer
Optical Fiber
Linning Peng, Sylvain Haese, Maryline Hélard
transmission system over POF is a systematical problem, which should be carefully designed with a global optimization. The parameters that can be taken into account to optimize the transmission are the clipping level, the cyclic prefix (CP) length, the non-linearity in the system, the quantization noised caused by the ENOB limitation, the used bandwidth, and the number of subcarriers.
Many published works present their deliberately designed DMT systems, but only taking into account one or two parameters [8][10]. In [10][18], different clipping levels and number of subcarrier selection are analyzed. However, these optimizations are implemented without the consideration of cyclic prefix (CP) length, non-linear behavior in LED and the ENOB problem. For DMT transmissions over 50 m SI-POF presented in [10] and [11], systems are designed with different CP length selection. Concerning the non-linear behavior of RC-LED, [19] highlights its influence on subcarriers in the low frequency range of the DMT system but without taking into account the RC-LED dynamic non-linear behavior and authors of [29] chose a linear working range for their experiments. Some LED non-linearity mitigation techniques for OFDM systems are presented in [30][31]. In [30], the proposed technique requires another LED source to reduce the distortion of OFDM symbols, which is not suitable for single RC-LED. In [31], time domain compensation technique is employed for LED system but the efficiency of this technique has not been demonstrated for RC-LED that has much wider bandwidth. Some works present joint clipping and quantization optimization for theoretical optical OFDM system with different DAC/ADC resolution [32][33]. However in an experimental POF DMT system, ENOB is quite lower that the DAC/ADC number of bits and the low frequency subcarriers have very high SNR, which requires more bits in the ADC. Although oversampling is usually used in the DMT transmission over POF [5][12][13], none of them indicates the relationship between the ENOB and the oversampling. The optimal oversampling rate is also not investigated in the POF system. Finally, the DMT channel capacity and reachable transmission rate after bit-loading is related to the used bandwidth. In [8] channel capacity of the DMT transmission over POF is provided. However this study is carried out with a bandwidth-limited numerical approach and a fixed used bandwidth. Furthermore, [8] only presents the channel capacity in the theoretical numerical approach. When bit-loading is employed in the DMT system, the real reachable transmission rate can also be studied.
In this paper, an overall optimization of DMT transmission over POF is presented. This optimization aims at a practical gigabits DMT transmission employing low-cost components over a 50 m step-index (SI) POF. Our optimization approach also focuses on searching the trade-off between system performance and system complexity. A global optimization of DMT transmission over POF concerning all of the parameters mentioned in the previous paragraph is firstly demonstrated in this work. We manage the optimization from the theoretical analysis to the experimental verification. The contribution of this paper is shown as follows: At first, we investigated the theoretical channel capacities and practical available transmission rate
of the DMT system with different used bandwidth. Next, the multi-path profile of the SI-POF system is presented. The optimal CP length selection is investigated. Then, the RC-LED non-linear dynamic performance and optimal working current are investigated. After that the ENOB limitation in the DMT transmission over POF is discussed. The optimal oversampling factor is studied. Then the joint optimal DMT clipping level and the number of subcarriers optimization is analyzed in theoretical pure linear scenario simulation and experimental investigation with RC-LED non-linearity. Finally, taking into account all the important parameters for DMT transmission, a methodology for the practical design of the DMT transmission over POF is introduced in the conclusion.
The structure of this paper is shown as follows: In Section II, the optical communication over POF is briefly introduced, including the large core diameter POF, RC-LED emitters and Si-PIN photo-detectors. Section III describes DMT transmission over POF channel. Section IV outlines our POF experimental setup. Section V introduces the approach of DMT optimization in POF channel. The theoretical optimizations in pure linear scenario are investigated. Then section VI demonstrates the experimental results in order to access and valid the optimal setups. Finally, Section VII presents an experimental gigabits DMT transmission over POF with the proposed optimal setups.
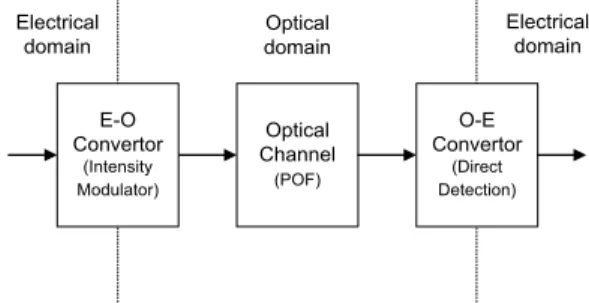
II. OPTICAL COMMUNICATION OVER POF Coherent detection is largely used in silica optical fiber (SOF) communications. Although coherent detection can greatly increase receiver sensitivity, coherent detection is not the optimum solution for low-cost POF systems. Coherent detection requires a very low phase noise and narrow spectrum optical source that is not available at 650 nm for POF low lost component. Also, the multimode properties of the POF make coherent detection almost impossible. Therefore, an intensity modulated direct detection (IM/DD) structure [25] is usually used in POF communication systems with low-cost consideration. In IM/DD optical systems, electrical signal directly drives the electrical to optical (E-O) convertor. The electrical signal
Optical Channel (POF) O-E Convertor (Direct Detection) E-O Convertor (Intensity Modulator) Electrical domain Optical domain Electrical domain
Fig. 1. IM/DD Optical Communication System Plastic Optical Fiber
Cladding
Core
Multi-mode propagation
modulates the power intensity of the optical signal. After a transmission over POF, optical signal intensity is directly converted in electrical domain by optical to electrical (O-E) convertor. A description of IM/DD optical communication system is shown in Fig. 1.
A. Polymer Optical Fiber
POF are also more robust and less sensitive to bending. Furthermore, large core diameter POFs are very easy for installation and maintenance.
The 1 mm-core poly-methy-methacrylate SI-POF is the most usual material for short range communications. With the help of large core diameter, SI-POF can be easily installed for optical communication systems, without any elaborate equipment for connecting. Visible light source is compatible for the transmission over SI-POF [4]. Four wavelength windows are suitable for SI-POF communications, such as 650 nm, 570 nm, 520 nm and 470 nm [4]. The mostly used transmission window is red light at 650 nm, which leads to an optical attenuation around 0.18 dB per meter [4].
When light is injected in SI-POF, it propagates through different modes. An illustration of multi-mode propagation in SI-POF is shown in Fig. 2. The multi-path propagation causes the multi-mode dispersion in SI-POF, which degrades the transmission bandwidth. There are millions propagation modes in SI-POF [4], which causes available transmission bandwidth of 50 m SI-POF as low as about 30 MHz. Therefore compared to SOF, the transmission bandwidth in SI-POF is very limited.
B. Emitter
With the advantage of large core diameter, low-cost LED are considered for POF communications, which further reduces the system cost. In recent researches, RC-LED have been tested for POF communications [1][10][11]. The 3 dB modulation bandwidth of RC-LED is around 100 MHz, which is much larger than LED bandwidth [4]. Owing to large bandwidth, low cost and high reliability, RC-LED offers a good solution for practical low-cost short-range POF transmission systems.
C. Photo-detector
A low-cost Si-PIN photodetector (PD) is usually used to detect the optical signal after POF transmission. Si-PIN with active diameter around 0.8 mm has a 625 MHz cut-off bandwidth [35]. The electrical signal is then amplified by a high bandwidth trans-impedance amplifier (TIA).
III. DMTTRANSMISSION IN IM/DDPOFCHANNEL In this section, a general description of DMT transmission in IM/DD POF channel is given.
A. DMT Transmission
Slightly different from OFDM, DMT modulation generates only real-value signals after inverse fast Fourier transform (IFFT). Thus DMT system does not need any analogue radio frequency (RF) component to mix the in-phase and quadrature signals in one channel. However, in order to achieve real-valued signals, the IFFT size is twice the subcarrier number [9].
DMT modulation can be illustrated as follows:
where is the total available subcarrier number, is a modulated real-valued DMT signal, which requires points of IFFT in Eq. (1). The original signal follows Hermitian symmetry property in Eq. (2).
A CP is usually added before DMT symbol in order to eliminate the inter symbol interference (ISI). The CP length should be designed larger than the channel delay spread.
A DMT system block diagram is presented in Fig. 3. B. Bit-loading in DMT
When the channel response is known at the transmitter, an evident advantage of DMT systems is the possibility to allocate the number of bits transmitted by each subcarrier, according to its SNR value. DMT system employing
C on ju ga te X1 X2 X3 ... Xn-3 Xn-2 Xn-1 2n Points IFFT QAM Modulator with Bit-Loading QAM Modulator with Bit-Loading QAM Modulator with Bit-Loading QAM Modulator with Bit-Loading QAM Modulator with Bit-Loading QAM Modulator with Bit-Loading ● ● ● P/S Convertor 0 X*n-1 X*n-2 X*n-3 ... X*3 X*2 X*1 0 X1 X2 X3 ... Xn-3 Xn-2 Xn-1 D up lic ati on S/P Convertor PRBS Generator Added CP Data CP Data in DMT DMT Symbols Add zero Add zero
Fig. 3. Illustration of DMT Transmission
appropriate quadrature amplitude modulation (QAM) constellation can thus approach the channel capacity. A theoretical calculation and comparison of bit-loading algorithms is given in [29], which shows that both Levin-Campello [36][37] and Chow [38] algorithms can achieve similar bit-loading results for SI-POF systems. Since it is the simplest, Chow algorithm is chosen for our study. The number of allocated bits is computed for each subcarriers in an iterative process taking into account the SNR of each subcarrier and the total power.
The bit-rate in DMT transmission is given by:
where is the SNR of the subcarrier, is the gap between the SNR required to achieve Shannon capacity and the SNR to achieve this capacity at a given bit error rate (BER), is the system performance margin of Chow algorithm [38]. set at 0 at the beginning of the bit-loading, and after several iterations, converges to the optimal value in order to keep the constant total power of all allocated subcarriers. The SNR gap provided in [29] is given in Table I, where is the symbol error rate.
C. DMT Signal over IM/DD POF Channel
In IM/DD channel, only light intensity is modulated. At the transmitter side, electrical signal from DAC output directly drives the RC-LED. A DC-bias is usually added to DMT bipolar signal, in order to drive the electro-optical component with positive unipolar signal. The electrical signal is then directly converted into optical signal. At the receiver side, light is captured by photo-detector and optical power intensity is directly converted to electrical current. A TIA is added after the PD in order to amplify the received signal to appropriate ADC range. Finally, signal is sampled and quantized by ADC.
For DMT transmission over IM/DD channel, several issues will degrade the system performance:
Non-linearity Distortion
Non-linearity distortion is mostly generated because of the non-linearity behavior of E-O component. In the RC-LED, the emitted optical power is enhanced when the feeding electrical signal current increases. However, the RC-LED has a non-linear E-O conversion function when feeding signal current is high. A RC-LED non-linear function is modeled by Lee and Inan [19][39]:
where is the output power, is the signal current value, is the basing current, is the Taylor expansion of RC-LED non-linear function. However, RC-LED non-linearity is frequency dependant [19]. Therefore, an optimal LED working current should be found in a DMT transmission system.
Receiver Noise
Receiver noise is mostly generated by PD and TIA. The main sources of noise in the PD are shot noise (quantum noise and the diode dark current noise) and thermal noise. The main sources of noise in TIA are the thermal noise and noise associated with the amplifier. The total receiver noise
can be given as [40]:
where is the current in the PD, is the charge of an electron, is the dark current, is the Boltzman’s constant, is the absolute temperature, is the electrical bandwidth of the system, is the feedback resistor value of the TIA and is the noise associated with the amplifier. The receiver noise value depends on the components and received optical power. In most of the cases, the receiver noise can be modeled as an additive white Gaussian noise (AWGN) with constant noise power spectral density (PSD).
Clipping Noise
Due to the high PAPR in DMT and finite dynamic range of DAC/ADC, clipping is usually performed digitally before DAC. In case of saturations in RC-LED or Si-PIN, excess signal will also be clipped. In DMT system with large number of subcarriers, distortion due to clipping can be modeled as a clipping noise and represented by the following equations [26]:
where is the power of the clipping noise in a DMT system,
is the clipping limit, is the variance of DMT symbols.
By considering only clipping noise in DMT system, the signal-to-clipping-noise can be given as:
where , the is the complementary error function [41].
Quantization Noise
Quantization noise is generated from quantization effects in DAC/ADC, due to the finite bit resolution of components. Insufficient ENOB will generate serious quantization noise. A relationship between signal-to-quantization-noise and ENOB is given as [42]:
TABLEI
TYPICALVALUESOFSNRGAP[29]
4.0386 6.06 5.4827 7.39 6.9458 8.42 8.4213 9.25
where is the ENOB, is the average signal power, is the maximal signal power. Eq. (9) shows that every additional 1 bit enhancement can approximately improve the
.
Low-pass Channel Response
POF channels have serious modal dispersion that cause low-pass frequency response. The low-pass channel frequency response of POF channels can be modeled as Gaussian filter. A POF channel frequency response is modelled as [4]:
, with
where is the linear fiber loss, is the 3 dB bandwidth of the channel frequency response. For an ideal DMT transmission over POF fading channel, the received SNR at different frequency can be given as:
where is the transmitted signal power,
is the receiver noise. As shown in Eq. (3) The transmission bit-rate can be maximized according to the
[43][44].
D. Normalized SNR of DMT Signal over IM/DD POF Channel
As shown in the last section, DMT transmission over IM/DD POF channel can be optimized taking into account each aspect in the whole system, corresponding to , , and . However, it is a systematical problem when a real DMT-POF is implemented. Due to the abovementioned different factors, the received signal suffers from mixed noise and attenuations.
Considering the whole transmission link, a normalized of the DMT signal at different frequencies in IM/DD POF channel is represented as:
where is the interference caused by the non-linearity distortion at the frequency , is the clipping noise and is the quantization noise, is the POF channel frequency response. A straightforward approach consists in increasing the RC-LED input current, but at a price of non-linear distortion increase. A second method consists of digital clipping before the DAC. After clipping, DMT signal power increases for a same working current range. However, the more signal is clipped, the more clipping noise is introduced. Since are interrelated and interact with each other, it is important to investigate the influence of the clipping to determine the optimum working current. At the same time, the quantization noise can be greatly reduced by increasing the ENOB. However, in a practical
system, the ENOB is limited. Therefore the appropriate ENOB for the DMT transmissions over SI-POF should be carefully investigated, in order to meet the ADC requirement of practical implementations.
As being mentioned above, in order to enhance
over a SI-POF transmission link, an overall DMT system optimization with deliberate system parameter configurations should be investigated. It is worth noting that the degradations in Eq. (12) are combined. Furthermore some factors are non-linear. It is obvious that a mathematical-experimental-mixed approach for system optimization is worth being considered.
IV. EXPERIMENTAL SETUP
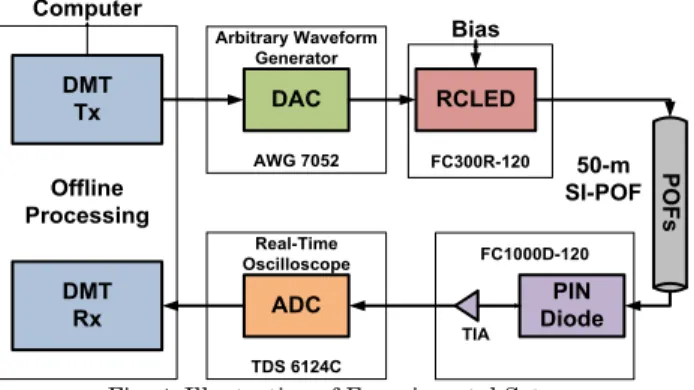
With the low-cost consideration, the system uses commercially available components. DMT symbols are pre-generated in computer and stored in the AWG memory. The AWG (AWG 7052TM, Tektronix, 10 bits resolution)
output directly drives RC-LED (FC300R-120TM, Firecomms)
with a proper bias circuit. A 50 m SI-POF (ESKA PremierTM,
Mitsubishi) with a numerical aperture of 0.5 is used for evaluation. After transmission over the 50 m SI-POF, signal is received by Si-PIN diode (FC1000D-120TM, Firecomms)
and subsequently captured by DSO (TDS 6124CTM,
Tektronix, 8 bits resolution). Finally, off-line digital signal processing is implemented in MatlabTM.
V. SYSTEM PARAMETERS FOR OPTIMIZATION A. System Frequency-domain Response
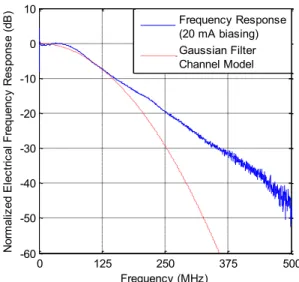
A channel frequency response of abovementioned 50 m SI-POF system is measured by the network analyser. The measured results are given in Fig. 5. Due to the high mode dispersion in large core diameter SI-POF, the measured system 3 dB bandwidth in 50 m SI-POF is limited to 80 MHz. From Fig. 5, it is clear that the channel frequency response has a low-pass characteristic. With the help of DMT modulation employing bit-loading, an adaptive transmission system can be designed according to its channel frequency response. With a determinate noise level, a maximal available bandwidth can be defined. Meanwhile, the frequency response of a Gaussian low-pass filter channel model with of 80 MHz is depicted in the same figure. As shown in the figure, the frequency response of the Gaussian low-pass filter channel model matches that of the measured channel in low frequencies range.
FC300R-120 FC1000D-120 Offline Processing DMT Tx DMT Rx Computer Arbitrary Waveform Generator AWG 7052 Real-Time Oscilloscope TDS 6124C DAC ADC RCLED PIN Diode P O F s Bias 50-m SI-POF TIA
Fig. 4. Illustration of Experimental Setup
B. System Time-domain Multi-path Profile
A measured multi-path profile of the 50 m SI-POF system is illustrated in Fig. 6. The multi-path profile is measured with 1 ns resolution. Measured results show that the delay of the main path is around 267 ns and the multi-path delay spread is around 12 ns. Meanwhile, a calculated POF channel with Gaussian low-pass filter channel model with of 80 MHz is compared in Fig. 6. As shown in the figure, the distribution of the measured channel multi-path profile is still very similar to the demonstrated Gaussian channel model. Therefore, it is practical to use the Gaussian low-pass filter channel model in Eq. (10) to do the numerical calculation for the DMT system.
From the measured channel multi-path profile presented in Fig. 6, the CP length of DMT symbol should be set no less than 12 ns.
C. System Non-linearity
As the channel frequency response shown in Fig. 5, the channel capacity depends on the received . Increasing RC-LED output power can increase SNR; however more non-linearity will be caused in the system. The measured static relationship between RC-LED feeding current and
output optical power is shown in Fig. 7. With a fixed biasing current , the maximal peak to peak range of signal current variation is .
As shown in Fig. 7, the RC-LED has a useable working current range from 0 to 40 mA, The current to output power curve is saturated above 40 mA. The static result shows that RC-LED works linearly in the current range from 0 to 20 mA. Although some works employ their experimental setup with this linear working range in order to reduce the non-linear distortions [29], it is obvious that the power efficiency is also reduced when the RC-LED works only in the linear range. Therefore, for a given RC-LED, it is practical to find a trade-off between transmission optical power and system linearity.
Furthermore, the measured curve in Fig. 7 represents the static non-linear performance in RC-LED. It is useful to measure the nonlinearity of the RC-LED by its dynamic performance. A dynamic performance of the RC-LED nonlinearity can be measured by the spurious free dynamic range (SFDR) including the harmonics [45]. In our system, the studied RC-LED provides a 3 dB bandwidth of around 100 MHz. We generated several Sine waveforms with different frequencies (1 MHz, 5 MHz, 10 MHz, 20 MHz, 50 MHz, 100 MHz, 150 MHz and 250 MHz). The Sine Fig. 5. Channel Frequency Response of 50 m SI-POF System
0 125 250 375 500 -60 -50 -40 -30 -20 -10 0 10 Frequency (MHz) N or m al iz ed E le ct ric al F re qu en cy R es po ns e (d B ) Frequency Response (20 mA biasing) Gaussian Filter Channel Model
Fig. 6. Multi-path Profile of 50 m SI-POF System 250 255 260 265 270 275 280 285 0 0.05 0.1 0.15 0.2 0.25 Time Spread (1 ns) N or m al iz ed P ow er
Measured Multi-path Profile Gaussian Filter Channel Model
Fig. 7. Measured static power transfer function of the RC-LED
0 10 20 30 40 50 0 500 1000 1500 2000
Input Electrical Current (mA)
O ut pu t O pt ic al P ow er ( uW ) Measured curve Linear approximation curve
Fig. 8. Measured dynamic SFDR performances and SNR without Harmonics distortions of the RC-LED
50 100 150 200 250 10 15 20 25 30 35 40 45 50 Frequency (MHz) M ea su re d S F D R a nd S N R ( dB ) SFDR biasing 20mA SFDR biasing 15mA SFDR biasing 10mA SFDR biasing 5mA SNR biasing 20mA SNR biasing 15mA SNR biasing 10mA SNR biasing 5mA
waveforms are emitted with RC-LED by different biasing currents. Full available current range is used for each biasing current. For example when 20 mA biasing is selected, the output signal varies from 0 to 40 mA; When 10 mA biasing is selected, the output signal varies from 0 to 20 mA.
After passing an attenuator, the optical signals are directly received by a PIN diode with a 3 dB bandwidth of 625 MHz. The received Sine waveforms are averaged 16 times in order to reduce the residual Gaussian noise in the PIN diode. The SFDR performance and SNR without the Harmonics distortions are measured and presented in Fig. 8. As shown in the figure, when 20 mA biasing current is employed, the SFDR in low frequencies seriously suffers from non-linear distortions. However, the SFDR can be improved when the measured frequency increases. Therefore it can be concluded that the RC-LED has a frequency-selective non-linear behavior and only the frequencies near the DC have the similar power transfer function shown in Fig. 7. In most of the real DMT systems, the used system bandwidth is much wider than the RC-LED 3 dB bandwidth [10][11]. Therefore being different from the results in [31], the static power transfer function based time-domain compensation cannot be easily implemented to the RC-LED due to its hundred MHz working bandwidth.
Furthermore, the SFDR below the RC-LED 3 dB bandwidth can be significantly improved when lower biasing current is employed. These results can be explained from the Fig. 7. The lower RC-LED biasing current, the better linearity in the RC-LED static power transfer function. However it is worth noting that the SFDR improvements decrease when the tested Sine waveform has a frequency near the RC-LED 3 dB bandwidth. It can be concluded that reducing the RC-LED working current can only improve the non-linear distortions in the low frequencies.
In addition, it can be noticed is that the SFDR improves in the 150 and 250 MHz with 5 and 10 mA biasing current. As the RC-LED works at a very small current and a frequency much higher than its 3dB bandwidth, very low optical power is emitted and received after the attenuation. In fact when the RC-LED works in a relatively linear condition, the non-linear distortions of the PIN diode and the TIA dominate the system non-linear distortions.
Finally, the measured SNR without the Harmonics distortions show that the lower the RC-LED biasing current, the higher the SNR reduction in the high frequencies. Therefore with lower RC-LED biasing current, the available transmission rates in the high frequencies decreases after the bit-loading in Eq. (3).
D. System ENOB Limitation
High-speed ADC are largely used in digital oscilloscopes. However, power consumption in the ADC drastically increases with the ADC bit-resolution increment, thus limiting practical ADC bit-resolutions [46]. ADC in high performance DSO are usual with high-speed (Multi-Giga samples/sec) and low-middle bit resolution (4-8 bit). Moreover, in most of real ADC, ENOB is much smaller than nominated resolution [46], which enhances the influence of ADC quantization noise. For a practical low cost system, we will chose the ADC with moderate sampling rate but with
optimum ENOB, which leads to a different choice than that of the DSO.
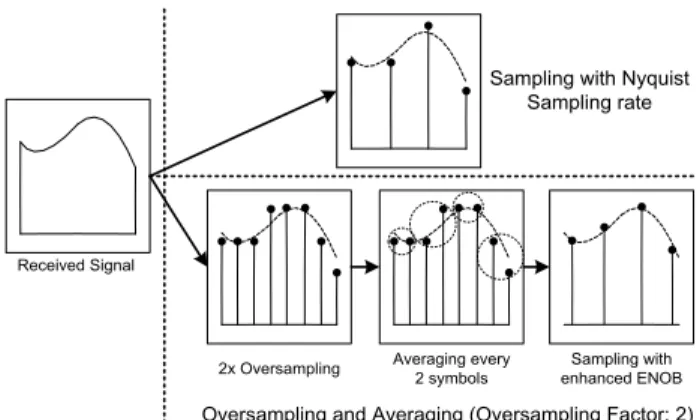
ENOB can be measured by spectrum analysis of pure sinusoid signal converted in ADC [45]. It is proved that an oversampling and averaging technique can enhance ADC ENOB [47]. A block diagram of the oversampling and averaging process is shown in Fig. 9. As shown in the figure, the received signal is acquired once by ADC with a sampling rate higher than Nyquist sampling rate. Then the oversampled signal can be averaged by passing through a low-pass filter and being down-sampled. With the help of oversampling and averaging, we can significantly increase the ADC ENOB with only one acquisition of the received signal.
A theoretical relationship between oversampling value and ENOB enhancement is given as [47]:
where is original sampling rate, is oversampling rate and is additional bits after oversampling. Eq. (13) is the theoretical results for the maximal performance gained by oversampling and averaging. In a practical system, the ENOB improvement can be investigated by experiments of the back-to-back connection of the DAC and ADC.
Although the oversampling and averaging technique is not commonly used in a practical system, it is useful in an
2x Oversampling Averaging every 2 symbols enhanced ENOBSampling with Received Signal
Sampling with Nyquist Sampling rate
Oversampling and Averaging (Oversampling Factor: 2)
Fig. 9. Illustration of oversampling and averaging for ENOB enhancement (oversampling factor: 2)
Fig. 10. ENOB and the improvements in ADC 25 50 75 100 150 200 4.5 5 5.5 6 6.5 7 7.5 Frequency (MHz) E N O B ( B its ) ADC: 0.5 GS/s ADC: 1.25 GS/s ADC: 5 GS/s ADC: 40 GS/s
experimental system using a DSO. In an experimental system, we can get the ENOB improvement by oversampling and averaging and get the minimal required ENOB for a POF transmission system. Then in a practical system, we can use the conclusion from the experimental system to select the ADC and DAC with appropriate ENOB and sampling rate, in order to obtain the tradeoff between the performance and system complexity.
The measured results of ENOB in DSO are drawn in Fig. 10. By means of oversampling and averaging, the ENOB can be enhanced with off-line processing.
As shown in the figure, with the Nyquist sampling rate of 0.5 GS/s, the measured ENOB in DSO is around 4.7 bits from 25 MHz to 200 MHz. The resulting ADC quantization noise is significant, which can be very “penalizing” especially in case of DMT transmission with high order modulation (64-QAM or even more). By increasing ADC sampling rate and averaging, ENOB is significantly improved, and can reach around 7 bits in case of 40 GS/s sampling rate. The ENOB improvements after oversampling and averaging are shown in Fig. 10. Although the theoretical calculation of the ENOB improvement in Eq. (13) is around 3.2 bits ( ) with an oversampling factor at 80, the real achieved enhancement of the ENOB is only around 2 to 2.5 bits. However, the more sampling rate, the higher requirement of hardware and digital processing. It is important to find an appropriate ENOB value for the 50 m SI-POF system with the consideration of the trade-off between performance and complexity.
E. DMT System Clipping
Signal after DMT modulation is a combination of different modulated symbols at different frequencies. In multi-carrier modulation system such as OFDM and DMT, modulated subcarriers may incidentally add together, which causes unexpected peaks in modulated symbols [33]. This phenomenon is characterized by PAPR that increases with the subcarrier number [24]. For example in the investigation of the statistical results of the PAPR in a DMT system [48], the DMT system with a subcarrier number of 512 has a PAPR around 14.5 dB at a complementary cumulative distribution function of .
Clipping technique is verified as a straightforward approach to reduce PAPR [24], but unfortunately generates more clipping noise in Eq. (6). The clipping process can be illustrated as follows:
where is original symbol, is clipping threshold defined by clipping ratio :
A relationship between the clipping ratio and can be theoretically calculated from Eq. (8), which is represented in Fig. 11. As shown in the figure, taking only the clipping noise into account, the theoretically calculated system SNR after clipping is higher than 30 dB even with 9 dB clipping. Then considering the complex noise in Eq. (8) and Eq. (9), we can get the system SNR after clipping with limited
DAC/ADC resolutions. The simulation results are shown in Fig. 11. It is clear that for each DAC/ADC resolution, there is an optimum clipping value to maximize . However from Eq. (12), it can be seen that in a global optimization, the optimal clipping ratio is also related to the system non-linearity distortion .
F. DMT System Bandwidth
In a practical DMT transmission system, the used bandwidth depends on the determined channel. Although the channel frequency response is shown in Fig. 5, it cannot be used to clearly determine the available transmission bandwidth for a practical system.
It is well know that the channel capacity for an AWGN channel is defined as [49]:
where is the used bandwidth, is the signal power, is the noise PSD. In DMT system, in order to investigate the system capacity, we can divide the used bandwidth into subcarriers with equal subcarrier spacing. It is worth noting that in case of total output power is limited, the larger the used bandwidth , the less the available power can be allocated to each subcarrier. Therefore it is imperative to evaluate the channel capacity of DMT transmission over POF with different used bandwidths.
Since Gaussian low-pass filter channel model provides a very precise model of our POF, we use it in order to theoretically derive the capacities. Then the calculated capacities can be used to design the DMT system with an appropriate used bandwidth and a desired BER. The capacity of DMT modulation in Gaussian low pass channel model is given as:
Fig. 11. Theoretical Clipped SNR versus Clipping Ratio with
unlimited and limited DAC/ADC resolution
4 6 8 10 12 10 15 20 25 30 35 40 45 50 55 Clipping Value (dB) S N R ( dB )
DAC/ADC Unlimited bit DAC/ADC 8 bits DAC/ADC 7 bits DAC/ADC 6 bits DAC/ADC 5 bits DAC/ADC 4 bits
where is the allocated power to the subcarrier, is the frequency at the subcarrier, is the noise power at the subcarrier. The allocated power to each subcarrier can be optimized by water-filling algorithm [44]. In [29], it is mentioned that the water-filling algorithm and equal power allocation can reach similar performance in the SI-POF system. Therefore the equal power allocation is selected in our system. Then we can get . As is assumed to be the unified value 1, the noise PSD of our 50 m SI-POF system is measured at -111 dB/Hz.
Introducing the bit-loading in Eq. (3) and in Table I, we can theoretically calculate the relationship between used bandwidth and transmission rate.
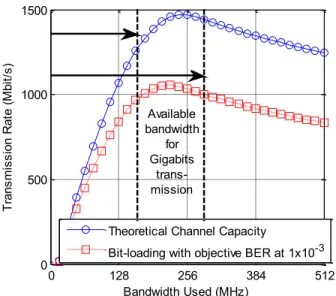
As shown in Fig. 12, although the 3 dB bandwidth of the simulated SI-POF is only 80 MHz, transmission rate can largely increase when the used bandwidth is wider than the system 3 dB bandwidth. The system maximal transmission rate can be achieved with a used bandwidth of 240 MHz. Although the system has an optimal used bandwidth, the simulation results show that in the range of a used bandwidth from 170 MHz to 270 MHz, DMT system can still obtain a Gigabit transmission after the bit-loading. The change of the transmission rate is moderate in this bandwidth range. We presented the experimental verifications of this theoretical analysis in [48]. Therefore for our practical system, the used bandwidth for a 50 m SI-POF is selected at 250 MHz. Then the practical used bandwidth can be optimally assigned after bit-loading.
G. DMT System Optimization in Simulations As the Gaussian channel model is employed, the channel capacities of the DMT transmission over the SI-POF are investigated in [8]. However, in a real system, the DMT performance depends on the experimental conditions. In the pure linear scenario, we can search the optimum DMT setups by simulations.
We first simulate the DMT performance with different system ADC ENOB. The DAC ENOB is set as 12 bits, which is higher than that in the ADC, 512 subcarriers with 12 ns CP length is set for the simulation. The simulation is processed without digital clipping. The Chow bit-loading
algorithm is adopted with the objective BER at . With the different ADC ENOB, the available transmission rate after the bit-loading is shown in Fig. 13.
When the ADC ENOB is higher than 6 bits, the increase of the ENOB can only gain slight performance enhancement. In addition, the DMT performance will be seriously degraded when ADC ENOB is lower than 5 bits. The simulation results show that the optimum ENOB is between 5 to 6 bits, with the consideration of the system performance and hardware complexity.
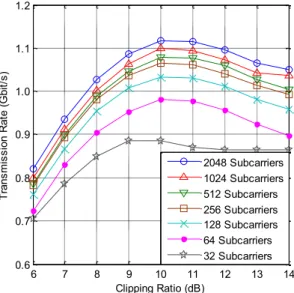
Then, the DMT system with different subcarrier number and clipping ratio is simulated in the pure linear scenario. The CP length is also fixed at 12 ns. The simulation is processed without quantization effects. As shown in Fig. 14, the greater number of the subcarriers, the better performance in the simulated POF channel. The difference of the performance enhancement is slight when subcarrier number is more than 256. The simulation results reveal that the 9 dB clipping value is the optimum selection for the pure linear scenario.
Fig. 12. Relationship between Used Bandwidth and Transmission Rate in Gaussian Low-pass Filter Channel Model 0 128 256 384 512 0 500 1000 1500 Bandwidth Used (MHz) T ra ns m is si on R at e (M bi t/ s)
Theoretical Channel Capacity
Bit-loading with objective BER at 1x10⁻³
Available bandwidth for Gigabits trans-mission
Fig. 13. Simulation results of the available transmission rate with
different ADC resolutions (512 subcarriers, BER at )
4 5 6 7 8 9 10 0.7 0.75 0.8 0.85 0.9 0.95 1 1.05 1.1
ADC Resolutions (bits)
T ra ns m is si on R at e (G bi t/ s)
Fig. 14. Simulation results of the available transmission rate with
different subcarrier number and clipping ratio (BER at )
6 7 8 9 10 11 12 13 14 0.9 0.95 1 1.05 1.1 1.15 1.2 1.25 1.3 1.35 1.4 Clipping Ratio (dB) T ra ns m is si on R at e (G bi t/ s) 2048 Subcarriers 1024 Subcarriers 512 Subcarriers 256 Subcarriers 128 Subcarriers 64 Subcarriers 32 Subcarriers
VI. SEARCHING OPTIMAL SYSTEM SETUPS In the previous section, the optimum DMT setups are investigated by simulations in pure linear scenario. However, in a practical system, the system optimization depends on the system non-linearity and the experimental conditions. In order to search the optimal system setup, a set of DMT probing symbols are generated to measure the . 250 MHz bandwidth DMT probing symbols with QPSK modulation are generated [50]. After off-line processing in receiver, subcarrier SNR can be measured by means of known information in transmitter. With an objective BER of , system capacity can be investigated by Eq. (3). The processing chain is shown in Fig. 15.
A. Performance with Different CP Length
A comparison of system capacities between different CP lengths is investigated in Fig. 16. 512 subcarriers DMT signal is generated with 1024 points IFFT, leading to a “useful” part of the OFDM symbols equal to 2048 ns. DAC
works at 1 GS/s, thus 2x oversampling is processed in transmitter. ADC works at 5 GS/s, which gives around 5.7 ENOB in the system. The bit-loading is processed after the subcarrier SNR are measured in the receiver. The net bit-rate is the experimental result without the consideration of CP cost in the system, which only reveals the ISI. As shown in the figure, most of the ISI can be eliminated when CP length is longer than 8 ns. Taking into account the CP cost in a real system, the practical bit-rate is obtained. As shown in the figure, 12 ns CP length is the optimum selection for the 50 m SI-POF system employing DMT with 512 subcarriers. The transmission system suffers from serious ISI when the CP length is less than 8 ns.
B. Performance with Different RCLED Biasing Current
With the same system setups of subcarrier number and DAC/ADC sampling rate, a comparison of system capacities between different RC-LED biasing values is investigated in Fig. 17. As shown in the figure, the 20 mA with full RC-LED current range can obtain the highest transmission rate. A measured subcarrier SNR with different is also shown in Fig. 18. It is worth noting that system with lower can be more linear, which increases the in low frequencies. However, the benefits of the linearity are counterweighed with the decreasing in high frequencies, because of reduced optical power. The conclusion for a RC-LED system is that a full range working current can be used in order to maximize the system
performance. Although the subcarriers in the low frequency suffer from some non-linearity distortions with the full range working current, the overall benefits are considerable.
Offline Processing Equalization DAC PSK Probing Symbols Estimate SNR Down-Sampling if Necessary Up-Sampling if Necessary Clipping IFFT & Adding CP Remove CP & FFT ADC
Fig. 15. Process of Subcarrier SNR Measurement [50]
Fig. 16. System Performance with Different CP Length
4 8 12 16 24 32 0.94 0.96 0.98 1 1.02 1.04 1.06 CP Length (ns) T ra ns m is si on R at e (G bi t/ s) Net Bit-rate Practical Bit-rate
Fig. 17. System Performance with Different RC-LED Biasing Current 10 15 20 0.92 0.94 0.96 0.98 1 1.02 1.04 1.06
RCLED Biasing Current (mA)
T ra ns m is si on R at e (G bi t/ s)
Bit-Rate with Differnt RCLED Biasing
Fig. 18. Measured with Different RC-LED Biasing
Current 128 256 384 512 -5 0 5 10 15 20 25 30 Subcarrier Number Frequency Spacing 0-250 MHz S N R ( dB ) RCLED 10mA RCLED 15mA RCLED 20mA
C. Performance with Different Sampling Rate As shown in Eq. (12), ENOB in ADC can be improved by oversampling and averaging. The measured results of DMT (512 subcarriers) system with different sampling rates of DAC and ADC are shown in Fig. 19. It is shown that the higher sampling rate in DAC and ADC, the better system performance. Since DAC has higher bit resolution than ADC’s, the benefits of sampling rate enhancement in ADC are more considerable than DAC’s. Furthermore, due to the used bandwidth equals to 250 MHz, DAC working at 0.5 GS/s will cause overlapping in cut-off frequency, which can degrade system performance.
Then a comparison of with different ADC sampling rates is shown in Fig. 20. With the help of increased ENOB, the overall system SNR from low frequencies to high frequencies is increased. From the measured results in Fig. 19 and Fig. 20, 5 GS/s sampling (oversampling factor: 10) rate in ADC can offer a sufficient ENOB (about 5.6 bits) for DMT system, which ensures a Gigabit transmission over SI-POF. Meanwhile, 40 GS/s sampling (oversampling factor: 80) can give 6.4 bits ENOB,
but it is not practical, compared to its increased complexity. With a lower sampling rate around 1.25 GS/s (oversampling factor: 2.5, ENOB at 4.8 bits), system performance decreases around 10%-14%, due to insufficient ENOB. Finally, systems with Nyquist sampling rate lose approximately one third of the maximal performance.
These experimental results coincide with the simulation conclusions. Therefore the required ENOB for a POF transmission system can be theoretically calculated by simulations in pure linear scenario. Additionally, the required ENOB for our 50 m SI-POF system is around 5 to 6 bits.
D. Performance with Different DMT Subcarrier Number and Clipping Level
Finally, a comparison of system capacities between different subcarrier number and clipping value is investigated in Fig. 21. The CP length of the DMT system is fixed to 12 ns. DAC works at 1 GS/s and ADC works at 5 GS/s. From the measured results, it is clear that the larger subcarrier number, the better system performance. However, in case of the subcarrier number is larger than 256, the enhancement of the DMT system transmission rate is slight. DMT system with 32 subcarriers has a performance loss around 21%, compared to system with 2048 subcarriers. The difference of the system performances between 2048 subcarriers and 256 subcarriers is only 4.7%. Therefore, it is practical to choose the system subcarrier number at 512, with the consideration of the trade-off between system performance and complexity. Furthermore, from the measured results in Fig. 21, each DMT system can obtain an optimized performance with 10-11 dB clipping ratio. It is worth noting that these experimental results are slightly different from the simulation results in Fig. 14. Compared with the 9 dB optimum clipping in the pure linear scenario simulations, the optimum clipping value is 10 to 11 dB in the real system. There is a 1 to 2 dB gap due to the system non-linearity. Furthermore, due to the system non-linearity, the benefits of the clipping in real system are less than that in the simulation system. Therefore the 10 to 11 dB clipping ratio is the trade-off between system power efficiency and Fig. 19. System Performance with Different Sampling Rate of ADC
and DAC 0.5 1.25 5 40 0.7 0.75 0.8 0.85 0.9 0.95 1 1.05 1.1
ADC Sampling Rate (GS/s)
T ra ns m is si on R at e (G bi t/ s)
DAC Sampling Rate: 0.5 GS/s DAC Sampling Rate: 1 GS/s DAC Sampling Rate: 2 GS/s
Fig. 20. Measured with Different Sampling Rate in ADC
128 256 384 512 -5 0 5 10 15 20 25 30 35 Subcarrier Number Frequency Spacing 0-250 MHz S N R ( dB )
ADC: 0.5 GS/s (ENOB: 4.5 bits) ADC: 1.25 GS/s (ENOB: 4.8 bits) ADC: 5 GS/s (ENOB: 5.6 bits) ADC: 40 GS/s (ENOB: 6.4 bits)
Fig. 21. Measured Subcarrier SNR with Different Subcarrier Number and Clipping Value
6 7 8 9 10 11 12 13 14 0.6 0.7 0.8 0.9 1.0 1.1 1.2 Clipping Ratio (dB) T ra ns m is si on R at e (G bi t/ s) 2048 Subcarriers 1024 Subcarriers 512 Subcarriers 256 Subcarriers 128 Subcarriers 64 Subcarriers 32 Subcarriers
system non-linearity.
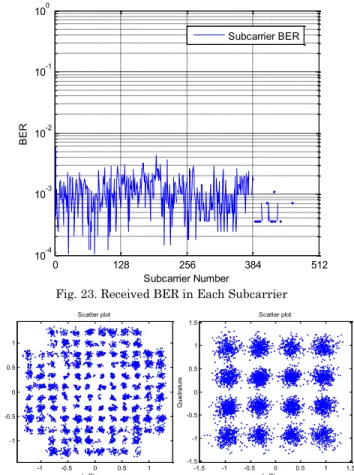
VII. GIGABITS TRANSMISSION WITH OPTIMAL SETUP With the help of abovementioned results, an optimized DMT transmission is tested over 50 m SI-POF. 512 subcarriers are generated with a used bandwidth of 250 MHz. According to the measured , 1500 DMT symbols employing bit-loading are generated and pre-processed with 10 dB clipping and 2 times oversampling before DAC, 12 ns CP is added. DAC in AWG works at 1 GS/s. RC-LED works with a biasing current of 20 mA. The optical output mean power is -1 dBm. After transmission over 50 m SI-POF, -12 dBm optical signal is received. ADC in DSO works at 5 GS/s. Received signal is resampled to 0.5 GS/s by averaging. After synchronization process in MatlabTM, DMT symbols are demodulated and equalized.
Finally, 1.07 Gbits/s transmission rate is achieved with an
obtained BER around .
The allocated bit and power in DMT transmission are shown in Fig. 22. The measured subcarrier BER is presented in Fig. 23. The demodulated constellation maps of 50th and
300th subcarriers are depicted in Fig. 24.
VIII. CONCLUSION
In this paper, a global optimization of the DMT transmission over POF with commercial available low-cost components is proposed and investigated. The proposed optimization takes into account all the important parameters including DMT CP length, RC-LED biasing current, DAC/ADC sampling rate, DMT subcarrier number and clipping value.
In order to carry out a complete analysis of the non-linear behavior and the frequency-selectivity of a RC-LED, we provided its static but also its dynamic power transfer function. The static power transfer function based time-domain compensation technique cannot be easily implemented to the RC-LED due to its hundred MHz working bandwidth. Furthermore, we find that the full usage of the RC-LED working current can maximize the DMT performance. Although in this case, the RC-LED works in the non-linear region, the benefit of the power increase is
higher than the degradation due to the introduced non-linear distortions. Thus working in non-linear range can significantly improve the power efficiency.
Furthermore, we demonstrate that theoretical simulations in pure linear scenario are not accurate to optimize the clipping ratio and that non-linearity has to be taken into account. Therefore, a 1-2 dB clipping gap should be reserved in the real system compared to the simulation results.
In addition, we investigate the ADC/DAC ENOB effect in the DMT transmissions over POF. These results can be directly introduced to the design of the practical implementation of the DMT transmission system. In a practical system, ADC with appropriate ENOB and sampling rate can be selected according to simulation results. If the ADC ENOB in the real system is not enough, oversampling and averaging technique can be efficiently employed to increase it.
Otherwise, with the help of measured channel multi-path profile, the optimal CP length can be selected for the DMT system. After that, with the help of the measured system 3 dB bandwidth and noise PSD, the simulation of the DMT channel capacity and available transmission rate after bit-loading can be obtained. These results can be used to introduce the range of appropriate bandwidth for the practical DMT system. We also demonstrated that the higher the number of subcarriers, the higher the bit rate, but that a good performance/complexity trade-off can be reached with 512 subcarriers.
Finally, with the help of this global optimization of the Fig. 22. Allocated Bit and Power in Each Subcarrier
128 256 384 512 0 1 2 3 4 5 6 7 8 A llo ca te d B it (b its ) Subcarrier Number 128 256 384 512-4 -3 -2 -1 0 1 2 3 4 A llo ca te d P ow er ( dB ) Allocated Bit Allocated Power
Fig. 23. Received BER in Each Subcarrier
0 128 256 384 512 10-4 10-3 10-2 10-1 100 Subcarrier Number BER Subcarrier BER
Fig. 24. Received Constellation Map of 50th and 300th Subcarriers
-1 -0.5 0 0.5 1 -1 -0.5 0 0.5 1 Q ua dr at ur e In-Phase Scatter plot -1.5 -1 -0.5 0 0.5 1 1.5 -1.5 -1 -0.5 0 0.5 1 1.5 Q ua dr at ur e In-Phase Scatter plot
DMT transmission system, we demonstrated that a 1.07 Gbits/s transmission with very low cost components and low complexity could be achieved over 50 m SI-POF.
This optimization methodology and most of our analysis can be usefully extended to other optical fiber systems employing DMT or OFDM.
REFERENCES
[1] C.M. Okonkwo, E. Tangdiongga, H. Yang, D. Visani, S. Loquai, R. Kruglov, B. Charbonnier, M. Ouzzif, I. Greiss, O. Ziemann, R. Gaudino, and A.M.J Koonen, “Recent Results from the EU POF-PLUS Project: Multi-Gigabit Transmission over 1 mm Core Diameter Plastic Optical Fibers”, Journal of Lightwave Technology, vol. 29, no. 2, pp. 186-193, Jan. 15 2011
[2] www.ict-alpha.eu (ICT ALPHA project web-site)
[3] A.M.J. Koonen, H.P.A. van den Boom, E. Ortego Martinez, Ph. Guignard, and E. Tangdiongga, “Cost Optimization of Optical In-Building Networks”, in European Conference on Optical Communication, 2011
[4] O. Ziemann, J. Krauser, P.E. Zamzow, and W. Daum, “POF Handbook: Optical Short Range Transmission Systems”, 2nd Edition, Springer, 2008
[5] D. Visani, C. Okonkwo, S. Loquai,H. Yang, Y. Shi, H.P.A. van den Boom, T. Ditewig, G. Tartarini, B. Schmauss, S.C.J Lee, A.M.J. Koonen, and E. Tangdiongga, “Beyond 1 Gbit/s Transmission Over 1 mm Diameter Plastic Optical Fiber Employing DMT for In-Home Communication Systems”, Journal of Lightwave Technology, vol. 29, no. 4, pp. 622-628, Feb. 15 2011
[6] S. Randel, F. Breyer, S.C.J. Lee, and J.W. Walewski, “Advanced
Modulation Schemes for Short-Range Optical
Communications”, IEEE Sel. Topics in Quantum Electronics, vol. 16, no. 5, pp. 1280-1289, Sep-Oct 2010
[7] R.V. Nee, and R. Prasad, “OFDM for wireless multimedia communications”, Artech House, 2000
[8] S.C.J. Lee, F. Breyer, S. Randel, R. Gaudino, G. Bosco, A. Bluschke, M. Matthews, P. Rietzsch, R. Steglich, H.P.A. van den Boom, and A.M.J. Koonen, “Discrete Multitone Modulation for Maximizing Transmission Rate in Step-Index Plastic Optical Fibers”, Journal of Lightwave Technology, vol. 27, no. 11, pp. 1503-1513, Jun. 1 2009
[9] Asymmetric Digital Subscriber Line (ADSL) Transceivers, ITU Std. G.992.1, July 1999
[10] S.C.J. Lee, F. Breyer, S. Randel, O. Ziemann, H.P.A. van den Boom, and A.M.J. Koonen, “Low-Cost and Robust 1-Gbit/s Plastic Optical Fiber Link Based on Light-Emitting Diode Technology”, in Optical Fiber Communication Conference, 2008 [11] B. Charbonnier, P. Urvoas, M. Ouzzif, J. Le Masson, J. D. Lambkin, M. O'Gorman and R. Gaudino, “EU project POF-PLUS: Gigabit Transmission over 50 m of Step-index Plastic Optical Fibre for Home Networking”, in Optical Fiber Communication Conference, 2009
[12] H. Yang, E. Tangdiongga, S.C.J. Lee, C. Okonkwo, H.P.A. van den Boom, S. Randel and A.M.J. Koonen, “4.7 Gbit/s Transmission over 50m Long 1mm Diameter Multi-core Plastic Optical Fiber”, in Optical Fiber Communication Conference, 2010
[13] S. Loquai, R. Kruglov, O. Ziemann, J. Vinogradov, and C.A. Bunge, “10 Gbit/s over 25 m Plastic Optical Fiber as a way for extremely low-cost optical interconnectio”, in Optical Fiber Communication Conference, 2010
[14] S. Loquai, R. Kruglov, C.A. Bunge, O. Ziemann, B. Schmauss, and J. Vinogradov, “10.7-Gb/s Discrete Multitone Transmission Over 25-m Bend-Insensitive Multicore Polymer Optical Fiber”, IEEE Photonics Technology Letters, vol. 22, no. 21, pp. 1604-1606, Nov. 1 2010
[15] H. Yang, E. Tangdiongga, S.C.J. Lee, S. Randel, H.P.A. van den Boom and A.M.J. Koonen, “4 Gbit/s over 50-m Large Core
Diameter GI-POF using Low-cost VCSEL”, in European Conference on Optical Communication, 2009
[16] D. Visani, C.M. Okonkwo, S. Loquai, H. Yang, Y. Shi, H.P.A van den Boom, A.M.H. Ditewig, G. Tartarini, B. Schmauss, S. Randel, A.M.J. Koonen, and E. Tangdiongga, “Record 5.3 Gbit/s Transmission over 50m 1mm Core Diameter Graded-Index Plastic Optical Fiber”, in Optical Fiber Communication Conference, 2010
[17] H. Yang, S.C.J. Lee, E. Tangdiongga, F. Breyer, S. Randel, and
A.M.J. Koonen, “40-Gb/s Transmission over 100m
Graded-Index Plastic Optical Fiber based on Discrete Multitone Modulation”, in Optical Fiber Communication Conference, 2009 [18] H. Yang, S. C. J. Lee, E. Tangdiongga, C. Okonkwo, H.P.A. van den Boom, F. Breyer, S. Randel, and A. M. J. Koonen, “47.4 Gb/s Transmission Over 100 m Graded-IndexPlastic Optical Fiber Based on Rate-Adaptive Discrete Multitone Modulation”, Journal of Lightwave Technology, vol. 28, no. 4, pp. 352-359, Feb. 15 2010
[19] B. Inan, S. C. J. Lee, S. Randel, I. Neokosmidis, A.M. J. Koonen, and J.W. Walewski, “Impact of LED Nonlinearity on Discrete Multitone Modulation”, Journal of Optical Communications and Networking, vol. 1, no. 5, pp. 439-451, Oct 2009
[20] I. Neokosmidis, T. Kamalakis, J.W. Walewski, B. Inan, and T. Sphicopoulos, “Impact of Nonlinear LED Transfer Function on Discrete Multitone Modulation: Analytical Approach”, Journal of Lightwave Technology, vol. 27, no. 22, pp. 4970-4978, Nov. 15 2009
[21] H. Eigalat, R. Mesleht and H. Haast, “A Study of LED Nonlinearity Effects on Optical Wireless Transmission using OFDM”, in Wireless and Optical Communications Networks, 2009
[22] J.M. Tang and K.A. Shore, “Maximizing the Transmission Performance of Adaptively Modulated Optical OFDM Signals in Multimode-Fiber Links by Optimizing Analog-to-Digital Converters”, Journal of Lightwave Technology, vol. 25, no. 3, pp. 787-798, Mar. 2007
[23] B. Mao, N. Stojanovic, C. Xie, M. Chen, L.N. Binh and N. Yang, “Impacts of ENOB on the Performance of 112Gbps PDMQPSK Digital Coherent Receiver”, in European Conference on Optical Communication, 2011
[24] T. Jiang and Y. Wu, “An Overview: Peak-to-Average Power Ratio Reduction Techniques for OFDM Signals”, IEEE Transactions on Broadcasting, vol. 54, no. 2, pp. 257-268, Jun. 2008
[25] J. Armstrong, “OFDM for Optical Communications”, Journal of Lightwave Technology, vol. 27, no. 3, pp. 189-204, Feb. 2009 [26] C.R. Berger, Y. Benlachtar, R.I. Killey and P.A. Milder,
“Theoretical and experimental evaluation of clipping and quantization noise for optical OFDM”, Optics Express, vol. 19, no. 18, pp. 17713-17728, Aug. 25 2011
[27] H. Ochiai, and H. Imai, “Performance Analysis of Deliberately
Clipped OFDM Signals”, IEEE Transactions on
Communications, vol. 50, no. 1, pp. 89-101, Jan. 2002
[28] D.J.G. Mestdagh, P. Spruyt and B. Biran, “Analysis of Clipping Effect in DMT-based ADSL Systems”, in International Conference on Communications, 1994
[29] B. Cardiff, M.F. Flanagan, F. Smyth, L.P. Barry, and A.D. Fagan, “On Bit and Power Loading for OFDM Over SI-POF”,
Journal of Lightwave Technology, vol. 29, no. 10,
pp. 1547-1554, May 15 2011
[30] R. Mesleh, H. Elgala, and H. Haas, “LED Nonlinearity
Mitigation Techniques in Optical Wireless OFDM
Communication Systems”, Journal of Optical Communications and Networking, vol. 4, no. 11, pp. 865-875, Nov. 2012
[31] H. Elgala, R. Mesleh, and H. Hass, "Predistortion in Optical Wireless Transmission using OFDM", in International Conference on Hybrid Intelligent Systems, 2009
[32] C.R. Berger, Y. Benlachtar, and R.I. Killey, “Optimum Clipping for Optical OFDM with Limited Resolution DAC/ADC”, SPPCom 2011
[33] D. Dardari, “Joint Clip and Quantization Effects Characterization in OFDM Receivers”, IEEE Transactions on Circuits and Systems, vol. 53, no. 8, pp. 1741-1748, Aug. 2006
[34] W.Shieh and I. Djordjevic, “OFDM for Optical
Communications”, Academic Press, Oct 2009
[35] www.firecomms.com, FC1000D-120, datasheet (Firecomms Website)
[36] J. Campello, “Practical Bit Loading for DMT”, in International Conference on Communications, 1999
[37] H.E. Levin, “A complete and optimal data allocation method for
practical discrete multitone systems”, in Global
Communications Conference, 2001
[38] P.S. Chow, J.M. Cioffi, and J.A.C. Bingham, “A Practical Discrete Multitone Transceiver Loading Algorithm for Data Transmission over Spectrally Shaped Channels”, IEEE Transactions on Communications, vol. 43, no. 234, pp. 773-775, Feb/Mar/Apr 1995
[39] T. P. Lee, “The nonlinearity of double-hetero structure LED’s for optical communications,” Proc. IEEE, vol. 65, no. 9, pp. 1408–1410, 1977.
[40] Y. Wang, “Investigation and Simulation of high speed Gigabit Transmission for POF based MOST Networks,” Elektronik Automotive (Special issue MOST), pp. 18–33, Apr. 2011 [41] Abramowitz, Milton and Stegun, Irene A., "Chapter 7",
Handbook of Mathematical Functions with Formulas, Graphs, and Mathematical Tables, New York: Dover, pp. 297, 1965 [42] B.P.Lathi, Modern Digital and Analog Communication Systems
(3rd edition), Oxford University Press, 1998
[43] A. Leke and J.M. Cioffi, “Maximum Rate Loading Algorithm for Discrete Multitone Modulation”, in Global Communications Conference, 1997
[44] W. Yu and J.M. Cioffi, “On Constant Power Water-filling”, in International Conference on Communications, 2001
[45] www.spec.de, “Measuring of dynamic figures: SNR, THD, SFDR” (SPECTRUM web-site)
[46] E.H. Chen, and C.K.K. Yang, “ADC-Based Serial I/O Receivers”, IEEE Transactions on Circuits and Systems, vol. 57, no. 9, pp. 2248-2258, Sep. 2010
[47] www.cygnal.com, “Improving ADC Resolution by Oversampling and Averaging”, (Cygnal Integrated Products web-site) [48] L. Peng, M. Hélard, and S. Haese , ”Optimization of
Multi-Band DFT-Spread DMT System for Polymer Optical Fiber Communications”, in International Conference on Communications, 2013
[49] J. Proakis and M. Salehi, “Digital Communications, 5th Edition”, McGraw-Hill Science/Engineering/Math, 2007 [50] L. Peng, S. Haese and M. Hélard, “Optimum Configuration for
Discrete Multi-tone Transmission over Polymer Optical Fiber”, in International Conference on Telecommunications, 2012
Linning Peng received his B.S. and M.S. degrees in 2006 and 2010
respectively, from Institute of Information Science and Engineering, Southeast University, China. He is now a PhD student in IETR (Electronics and Telecommunications Institute of Rennes) laboratory at INSA (National Institute of Applied Sciences) of Rennes, France, from 2010. His primary research interests focus on optical communications and indoor optical networking.
Sylvain Haese received the engineer and Ph.D degrees in electrical
engineering from INSA (National Institute of Applied Sciences) Rennes, France, in 1983 and 1997 respectively. From 1984 to 1993 he was an analog IC designer for automotive and RF circuits. In 1993, he joined INSA/IETR (Electronics and Telecommunications Institute of Rennes) laboratory where he conducted research for automotive powerline applications and for RF wideband channel sounder circuitry. He is currently involved in hardware analog implementation for RF and optical circuits with the Communication Department at IETR Rennes.
Maryline Hélard received the M.Sc and PhD degrees from INSA
(National Institute of Applied Sciences) of Rennes and the
Habilitation degree from Rennes 1 University in 1981, 1884 and 2004 respectively. In 1985, she joined France Telecom Research Laboratory as a research engineer and since 1991 she carried out physical layer studies in the field of digital television and wireless communications. In 2007, she joined INSA as a professor and she is now the co-director of the Communication Department at IETR (Electronics and Telecommunications Institute of Rennes). She is co-author of 22 patents and several papers (Journal and conferences). Her current research interests are in the areas of digital communications such as equalization, synchronization, iterative processing, OFDM, MC-CDMA, channel estimation, and MIMO techniques applied to wireless and wire communications. She was involved in several French and European collaborative research projects including digital television, MC-CDMA techniques and time reversal technique.