Nutritional evaluation of indigenous foods with
potential food-based solution to alleviate hunger and
malnutrition in Kenya
Catherine N. Kunyanga1, Jasper K. Imungi1, Vadivel Vellingiri2.
1Dr. Catherine Nkirote Kunyanga (PhD), Department of Food Science, Nutrition and Technology,
University of Nairobi, P.O. Box 29053-00625, Nairobi, Kenya.Email: [email protected]
1Prof. Jasper Kathenya Imungi (PhD), Department of Food Science, Nutrition and Technology, University of Nairobi, P.O. Box 29053-00625, Nairobi, Kenya.Email: [email protected]
2Dr. Vadivel Vellingiri (PhD), Institute of Oenology and Food Engineering, UniversitaCattolica Del SacroCuore, Piacenza, Italy.E-mail: [email protected]
Corresponding authorEmail:[email protected], [email protected]
Original submitted in on 16th May 2013 Published online at www.m.elewa.org on 30th July 2013. ABSTRACT
Objective: This study was designed to evaluate the nutritional quality and key essentialnutrients in indigenous foodsconsumed by vulnerable groups to identify practical applications for alleviation of hunger and malnutrition in Kenya.Plant foods such as cereals, legumes and vegetables possess high nutritive value and functional properties which are associated with positive health and nutrition.
Methodology and results: The indigenous foods were identified and selected on the basis of common food ingredients used by vulnerable groups in Kenya. They were evaluated for their nutritional composition, amino acid and fatty acid profiles using standard methods. The foods contained 6-44% protein; 11-43% fat; 324-497 kcal energy; 15-57% carbohydrates; 25-328 mg/100g calcium; 1.0-51 mg/100g iron; 44-1320 mg/100g magnesium among others.The indigenous vegetables exhibited 3.2-63 mg/100g vitamin C and 0.7-5.1 mg/100g β-carotene contents while the grains showed 22-110 µg/100g folic acid, 1.2-17.7 mg/100g niacin andhigh B Vitamins content. The total essential amino acid content ranged from 0.9 to 12.8% whilefatty acid levels were 4.8-33.6% palmitic, 1.5-9.0% stearic, 2.2-53.9% oleic, 4.5-53.7% linoleic and 0.9-60.4% α-linolenic acids. Conclusion and application of findings: The study demonstrated that the food ingredients were high in macro- and micro-nutrients, essential amino acids and fatty acids, and could potentially be used in addressing nutrition and food security issues, particularly among vulnerable groups in Kenya. The study findings provide practical feasibility of on use of locally-produced formulations as low-cost alternatives in supplementary and emergency feeding programmes to reduce malnutrition and chronic diseases. These foods are low-cost and locally available and therefore offer food-based solutions to hunger and malnutrition in developing countries. Keywords: Indigenous foods; Nutrient content; Fatty acids; Amino acids; vulnerable groups.
INTRODUCTION
The challenge for agricultural practices to increase food production and obtain food security still persists after 40 years of the green revolution (Hobbs, 2007).
Poverty and food insecurity seriously constrain the accessibility of nutritious diets that have high protein quality, adequate micronutrient content and
Journal of Applied Biosciences 67:5277 – 5288
bioavailability, macronutrients and essential fatty acids, and high nutrient density (Omueti, 2009). The typical diets of vulnerable populations with high prevalence of malnutrition and under nutrition consist predominantly of starch-rich staples, such as a cereal or tuber, with limited amounts of fruits, vegetables, legumes and pulses (Solomon &Owolawashe, 2007). Such diets are bulky, have low nutrient density and poor bioavailability of minerals and vitamins and therefore result in impaired growth, development and a host of chronic diseases. Investigations on economically viable indigenous food ingredients as alternative strategies to curb under nutrition and food insecurity are of utmost importance to broaden the essential nutrient sources for human beings (Barba de la Rosa et al., 2009). Faced with increasing food shortages, agriculturalists and food scientists are becoming increasingly interested in previously neglected tropical grains and indigenous vegetables such as finger millet, amaranth grain, pigeon pea, field bean, pumpkin, sweet potatoes drumstick leaves, amaranth leaves and pumpkin leaves (Islam 2006). Indigenous foods are foods that have their origin in a region, are culturally acceptable and adapted to the local climatic conditions which have been consumed traditionally by the inhabitants as opposed to exotic foods which have been introduced from other regions of the world. Indigenous foods are rich and inexpensive sources of protein, carbohydrates, dietary fibre, minerals and vitamins to millions of peoples in developed and developing countries, and are some of the basic foods of the indigenous populations of Africa (Luthria& Pastor-Corrales, 2006). Further, adaptation to adverse environmental conditions, resistance to pests, cultural acceptability and sufficient nutritional qualities are the key advantages of these indigenous foods. In developing countries like Kenya, due to high cost and limited access to animal food products that provide high intakes of minerals such as iron and zinc, the main dietary sources of minerals are cereals and legumes. Traditional plant foods are believed to be highly
nutritious; containing high levels of both vitamins and minerals (Orech et al., 2007). The first Millennium Development Goal is to “eradicate extreme poverty and hunger by 2015” and the nutrition indicator in Kenya is “to halve the prevalence of underweight in children less than five years old from 35.5 per cent in 1990 to 16.25 per cent in 2015” (CBS/MPHS/ORC, 2010). Malnutrition has been defined as inadequate or excess intake of one or more nutrients. Under nutrition appears when nutritional reserves are depleted and nutrient and energy intake is insufficient to meet the day-to-day needs or added metabolic stress (WHO/WFP/UNICEF, 2008). The state of food insecurity in the world estimates the total incidence of undernourishment in the developing countries at 780-798 million in 1999/2001 (FAO, 2005). In Kenya, malnutrition accounts for 38% of all deaths in children under five years of age, of which 4% is as a result of severe, and 34% a result of mild and moderate malnutrition (WHO/WFP/UNICEF, 2008). Malnutrition has always been a concern of the underprivileged in the developing countries including Kenya. The incidence of micronutrient malnutrition among the vulnerable groups in Kenya, necessitate the need to explore underutilized indigenous foods to overcome nutritional disorders.Vulnerable groups are the population groups living with severe health problems and compromised immunity level due to inadequate food intakes and poverty.Dietary diversification is the most important factor in ensuring intake of adequate nutrients from indigenous foods. Lack of diversity in basic staple foods creates poverty traps and negatively affects longer-term food security. Data on nutrient composition of indigenous foods with potential to address nutrition and food security in Kenya is still very limited in spite of the incidences of hunger and malnutrition. The objective of this study was therefore to evaluate and identify the important nutritional qualities of indigenous food ingredients for use in alleviating hunger and malnutrition especially among the vulnerable groups in Kenya.
MATERIALS AND METHODS
Chemicals: The chemicals used included Lithium dodecyl sulfate (>99%, Carl Roth, 76185, Karlsruhe,
Germany), DL-Norleucine (Serva, 64271, Heidelberg, Germany), hydrochloric acid (36%, Fisher Scientific,
58239 Schwerte, Germany), Formic acid, ethylene glycol, phosphoric acid, L-amino acids and hydrindantin dehydrate (Fluka, 82024 Taufkirchen, Germany). All the other analytical grade solvents and chemicals were supplied by Merck Chemicals, 64271, Darmstadt, Germany.
Sample Collection and Preparation: The samples were collected on the basis of common food ingredients used by vulnerable groups in Nairobi, Kenya. Samples included cereals such as finger millet (Eleusine coracana L. Gaertn. P-224) and amaranth grain (Amaranthus cruentus L.); legumes such as pigeon pea (Cajanus cajan (L.) Millsp. Kat/Mbaazi 3) and field bean (Dolicho spupureum L. Kat/DL-3); oil seeds such as groundnut (Arachis hypogea L.), pumpkin seed (Cucurbita maxima Duchesne ex Lam.) and sunflower seed (Helianthus annuus L. PAN 7369). The vegetables selected were pumpkin (Cucurbita maxima L.), butternut (Juglan scinerea L.), sweet potatoes (Ipomoea batatas [L.] Lamk. SPK 004), and leafy vegetables such as drumstick leaves (Moringa oleifera L.), amaranth leaves (Amaranthus hybridus L.) and pumpkin leaves (Cucurbita maxima Lam.). The food ingredients (1 kg each) were purchased from the local open-air market at Kangemi and Uchumi supermarket in Nairobi, Kenya. All the samples dried in an air oven at 60 °C for 6-10 h, milled using a laboratory mill (Hammer mill, type DFH48, No. 282521/UPM 6000, Switzerland) and sieved (0.1mm) to obtain fine flour for analyzes.
Methods
Chemical analysis: The dried indigenous food samples were analyzed for chemical composition. Nitrogen (reference no. 960.52), ether extract (920.85), ash (923.03), moisture content (934.01), and fibre (991.43) were determined according to the standard methods of AOAC (2000). The remaining percentage was represented carbohydrates by difference. Energy was calculated from fat, carbohydrate and protein contents using Atwater’s conversion factors. Ascorbic acid was determined following the AOAC (2000) official method 967.21 by titration with the 2-6 dichlorophenolindophenol reagents. Total carotenoids and β-carotene were also analyzed according to standards methods of AOAC (2000). The vitamins, vitamin B1, vitamin B2, niacin, and folic acid were analyzed according to the fluorometric method of AOAC (1990) procedure number 953.17 for vitamin B1 which involved extraction with 0.1 N HCL for 1h, autoclaving (20min/109 °C ), centrifugation (20min/3500 rpm), oxidation and fluorescence measurements of thiochrome compound. Vitamin B2 was extracted with dilute mineral acid (0.1 N HCL for 30-60
min), followed by enzymatic digestion of starch with takadiastase using modified AOAC fluorometry method 985.31; Folate was analyzed using microbiological assay-Trienzyme procedure (45.2.09), official method 2004.05; Niacin was extracted by autoclaving the samples with 0.5M mineral acid and NAD glycohydrolase using modified AOAC method 975.41 (Ball, 2005). The samples for minerals were digested with concentrated nitric acid, sulphuric acid and perchloric acid (10:0.5:2, v/v) and mineral constituents (calcium, iron, magnesium, potassium, phosphorus, sodium, and zinc) were determined using inductively coupled argon plasma atomic emission spectroscopy (ICP-AES, Jarrel-Ash). The mineral contents were quantified against standard solutions of known concentrations which were analyzed concurrently.
Amino acids analysis: The amino acid profiles were determined according to standard methods of the Official Journal of the European Union (2009). The free amino acids were extracted with dilute hydrochloric acid. Co-extracted nitrogenous macromolecules were precipitated with sulfosalicylic acid and removed by filtration then the filtered solution was adjusted to pH 2.20. The total amino acids were oxidized at 0 °C with performic acid/phenol mixture. Excess oxidation reagent was decomposed with sodium disulphite. The oxidized or unoxidised sample was hydrolyzed with hydrochloric acid (3.20) for 23 hrs and the hydrolysate adjusted to pH 2.20. The amino acids were separated by ion exchange chromatography and determined by reaction with ninhydrin with photometric detection at 570 nm (440 nm for proline). For the determination of tryptophan, the sample was hydrolysed under alkaline conditions with saturated barium hydroxide solution and heated to 110 °C for 20 hrs. After hydrolysis internal standard was added in the hydrolysate. The amino acids and internal standards were measured using an amino acid analyzer (Eppendorf-Biotronic LC 3000, LaborserviceOnken, 63584 Grȕndau, Germany). Extraction and GC-MS analysis of fatty acid methyl esters (FAME): Accelerated solvent extraction technique was used for sample extraction, using a combination of elevated temperature (80 - 100 °C) and pressure (2500 psi) with the liquid solvents. Compressed gas was used to purge the sample extract from the cell into a collection vessel. The solid flour was enclosed in a sample cartridge, filled with an extraction solvent and sued to statically extract the sample. Methyl esters were prepared by transmethylation using 0.5 M KOH in methanol and n-hexane. A sample of 10 mg was mixed with 0.5 ml of 0.5 M methanolic KOH for saponification and heated to 80 °C for 5 min then cooled down on ice. 1 ml BF3 for
methylation was added with a 1 ml glass volumetric pipette then heated to 80 °C for 5 min then cooled down on ice. 2 ml n-hexane and saturated NaCl solution were added to dissolve the FAMEs and for a better phase separation. After strong shaking and phase separation, the supernatant (organic phase) was taken for measurement on the GC. The fatty acid methyl esters (FAME) were analyzed using Hewlett-Packard HP 5911A mass spectrometer interfaced with an HP 5890 gas chromatograph. Electron ionization at 70 eV with an ion source temperature of 240 °C was used. An HP-5 column was used (30 m x 0.25 mm i.d; film thickness 0.25 µm), with helium carrier gas. The oven temperature was
70-325 oC at 4° C min-1 and 0.2 µl of the diluted fatty acid esters were ejected into the GC-MS. The fatty acids were identified by comparing the retention time of FAME with the standard 37 component FAME mixture or relative to authentic standards. The GC experiment was replicated thrice and results were expressed in GC area % as mean values ± standard deviation.
Statistical analysis: All analyses were performed in triplicate (n = 3), and the data was presented as means standard error of deviation (± SEM) and analysis of variance was determined at 5% level of significance. GraphPadPRISM® version IV software, San Diego, CA was used for statistical analysis.
RESULTS AND DISCUSSION
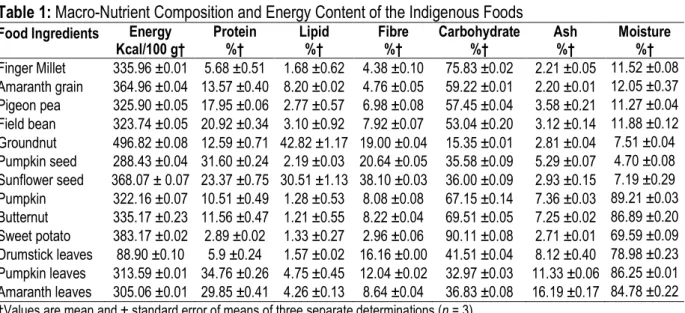
Nutrient composition and energy content: The results of macro-nutrient analysis and energy contents of food ingredients are shown in Table 1. The cereal grains (finger millet and amaranth) had a protein range of 5.7 – 13.6%, lipid content of 1.7-8.2%, carbohydrates of 59-75.8%, and ash contents of 2.2% with amaranth grain exhibiting the higher protein, fibre and lipid content. The
proximate composition of the amaranth grain in the present study had comparable protein (14.8-15.3%), lipids (7.9-8.9%), ash (3.3-3.9%) and fibre (1.9-2.5%) contents to similar amaranth varieties grown in Mexican highlands and Southern Europe (Barba de la Rosa et al., 2009).
Table 1: Macro-Nutrient Composition and Energy Content of the Indigenous Foods
Food Ingredients Energy
Kcal/100 g† Protein %† Lipid %† Fibre %† Carbohydrate %† Ash %† Moisture %† Finger Millet 335.96 ±0.01 5.68 ±0.51 1.68 ±0.62 4.38 ±0.10 75.83 ±0.02 2.21 ±0.05 11.52 ±0.08 Amaranth grain 364.96 ±0.04 13.57 ±0.40 8.20 ±0.02 4.76 ±0.05 59.22 ±0.01 2.20 ±0.01 12.05 ±0.37 Pigeon pea 325.90 ±0.05 17.95 ±0.06 2.77 ±0.57 6.98 ±0.08 57.45 ±0.04 3.58 ±0.21 11.27 ±0.04 Field bean 323.74 ±0.05 20.92 ±0.34 3.10 ±0.92 7.92 ±0.07 53.04 ±0.20 3.12 ±0.14 11.88 ±0.12 Groundnut 496.82 ±0.08 12.59 ±0.71 42.82 ±1.17 19.00 ±0.04 15.35 ±0.01 2.81 ±0.04 7.51 ±0.04 Pumpkin seed 288.43 ±0.04 31.60 ±0.24 2.19 ±0.03 20.64 ±0.05 35.58 ±0.09 5.29 ±0.07 4.70 ±0.08 Sunflower seed 368.07 ± 0.07 23.37 ±0.75 30.51 ±1.13 38.10 ±0.03 36.00 ±0.09 2.93 ±0.15 7.19 ±0.29 Pumpkin 322.16 ±0.07 10.51 ±0.49 1.28 ±0.53 8.08 ±0.08 67.15 ±0.14 7.36 ±0.03 89.21 ±0.03 Butternut 335.17 ±0.23 11.56 ±0.47 1.21 ±0.55 8.22 ±0.04 69.51 ±0.05 7.25 ±0.02 86.89 ±0.20 Sweet potato 383.17 ±0.02 2.89 ±0.02 1.33 ±0.27 2.96 ±0.06 90.11 ±0.08 2.71 ±0.01 69.59 ±0.09 Drumstick leaves 88.90 ±0.10 5.9 ±0.24 1.57 ±0.02 16.16 ±0.00 41.51 ±0.04 8.12 ±0.40 78.98 ±0.23 Pumpkin leaves 313.59 ±0.01 34.76 ±0.26 4.75 ±0.45 12.04 ±0.02 32.97 ±0.03 11.33 ±0.06 86.25 ±0.01 Amaranth leaves 305.06 ±0.01 29.85 ±0.41 4.26 ±0.13 8.64 ±0.04 36.83 ±0.08 16.19 ±0.17 84.78 ±0.22
†Values are mean and ± standard error of means of three separate determinations (n = 3). All the legumes studied were rich in protein ranging from
18% in pigeon pea to 21% in field bean. Legumes also contained significant amounts of crude fibre which ranged from 7.0% in pigeon pea and 19% in groundnuts. The carbohydrate content varied from 15 % to 57%. The grains were observed to contain more energy content (324-497 Kcal) when compared to the vegetables, with groundnut showing the highest content. The lipid content was highest in the groundnut (43%) and sunflower seeds
(31%) and the oil seeds exhibited highest fibre content (19-38%). The results were in comparison with earlier studies on proximate composition of nineteen domestic legumes including soybeans, black soy beans, azuki beans and mung beans (8-12% moisture, 19-44% protein, 0.6-18% fat, and 4-6% ash) (Lin & Lai 2006), mucuna beans (30% proteins, 4.3% lipids, 3.5% ash, and 7.4% fibre) (Siddhuraju& Becker, 2005) and pigeon peas (87-88% dry matter, 19-22% proteins, 1.2-1.3% fat,
9.8-13.0% fibre and 3.9-4.3% ash) (Amarteifio et al., 2002). The groundnut investigated in the current study had similar composition to edible nuts such as almonds, brazil nut, cashew nut, hazelnut, macadamia, pecan, pine nut, pistachio, walnut and Virginia peanut in the lipid (42.88-66.71%), protein (7.50-21.56%), ash (1.16-3.28%) and moisture (1.47-9.51%) contents that are grown in the U.S.A. (Venkatachalam & Sathe, 2006). All the vegetables exhibited high fibre and moisture contents (8-12% and 69-89%, respectively). The pumpkin and amaranth leaves showed highest ash contents (11% and 16%, respectively). The nutritional profile of the pumpkin seeds in the current study was comparable to results reported by Younis et al. (2000) for pumpkin seeds (Cucurbita pepo) used locally in Eritrea in terms of the oil content (35%), protein (38%), carbohydrate (37%), ash (3.3%) and moisture content (6.6%). The chemical composition of the indigenous vegetable in this study was comparable to that of underutilized green leafy vegetables such as Cucurbita maxima, Deloni xelata, Amaranthus tricolor, Digera arvensis among others grown in India in their moisture content (73-95 g/100 g), ash (0.8-3.5 g/100 g) and ether extract (0.2-0.9 g/100 g) (Gupta et al., 2005). Similarly, the chemical composition of the sweet potatoes investigated in this study was comparable to that of two sweet potatoes varieties
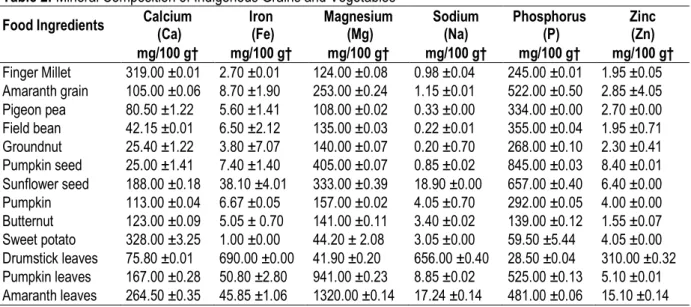
(Koganesengan and Beniazuma) in terms of moisture (69.9-70.9 g/100 g), protein (1.28-2.13 g/100 g), lipid (0.20-0.33 g/100 g), fibre (2.30-3.42 g/100 g) and ash (1.08-1.43 g/100 g) grown in Japan (Ishida et al., 2000). Micronutrient contents: The mineral composition (calcium, iron, magnesium, sodium, phosphorus and zinc in mg/100 g) of the presently investigated food samples are presented in Table 2. Minerals are required in the human body for numerous functions in the body and their essentiality has been well established (Gupta et al., 2005). The mineral content of the foods ranged from 25-328 mg/100 g for Ca, 1.0-51 mg/100 g Fe, 44-1320 mg/100g Mg, 0.2-19 mg/100 g Na, 60-1105 mg/100 g P, and 1.6-15 mg/100 g Zn. The mineral content of the finger millet of the current study was slightly higher in most elements as compared to reports of mineral contents (P, 288 mg/100 g; K, 280 mg/100 g; Mg, 149 mg/100 g; Ca, 51 mg/100 g; Na, 6 mg/100 g; Zn, 6.5 mg/100 g; and Fe, 20 mg/100 g) in pearl millet (Pennisetum glaucum L.) grown in the UAE (Ragaee et al., 2006). This could be attributed to varietal and climatic differences. Previous studies have also shown that finger millet (Eleusine coracana) has the highest calcium content (344 mg/100 g) known in foods (Hedge &Chandra, 2005).
Table 2: Mineral Composition of Indigenous Grains and Vegetables
Food Ingredients Calcium
(Ca) Iron (Fe) Magnesium (Mg) Sodium (Na) Phosphorus (P) Zinc (Zn) mg/100 g† mg/100 g† mg/100 g† mg/100 g† mg/100 g† mg/100 g† Finger Millet 319.00 ±0.01 2.70 ±0.01 124.00 ±0.08 0.98 ±0.04 245.00 ±0.01 1.95 ±0.05 Amaranth grain 105.00 ±0.06 8.70 ±1.90 253.00 ±0.24 1.15 ±0.01 522.00 ±0.50 2.85 ±4.05 Pigeon pea 80.50 ±1.22 5.60 ±1.41 108.00 ±0.02 0.33 ±0.00 334.00 ±0.00 2.70 ±0.00 Field bean 42.15 ±0.01 6.50 ±2.12 135.00 ±0.03 0.22 ±0.01 355.00 ±0.04 1.95 ±0.71 Groundnut 25.40 ±1.22 3.80 ±7.07 140.00 ±0.07 0.20 ±0.70 268.00 ±0.10 2.30 ±0.41 Pumpkin seed 25.00 ±1.41 7.40 ±1.40 405.00 ±0.07 0.85 ±0.02 845.00 ±0.03 8.40 ±0.01 Sunflower seed 188.00 ±0.18 38.10 ±4.01 333.00 ±0.39 18.90 ±0.00 657.00 ±0.40 6.40 ±0.00 Pumpkin 113.00 ±0.04 6.67 ±0.05 157.00 ±0.02 4.05 ±0.70 292.00 ±0.05 4.00 ±0.00 Butternut 123.00 ±0.09 5.05 ± 0.70 141.00 ±0.11 3.40 ±0.02 139.00 ±0.12 1.55 ±0.07 Sweet potato 328.00 ±3.25 1.00 ±0.00 44.20 ± 2.08 3.05 ±0.00 59.50 ±5.44 4.05 ±0.00 Drumstick leaves 75.80 ±0.01 690.00 ±0.00 41.90 ±0.20 656.00 ±0.40 28.50 ±0.04 310.00 ±0.32 Pumpkin leaves 167.00 ±0.28 50.80 ±2.80 941.00 ±0.23 8.85 ±0.02 525.00 ±0.13 5.10 ±0.01 Amaranth leaves 264.50 ±0.35 45.85 ±1.06 1320.00 ±0.14 17.24 ±0.14 481.00 ±0.06 15.10 ±0.14
†Values are mean and ± standard error of means of three separate determinations (n = 3). The mineral content of pigeon peas of the present study
was comparable to the mineral contents (P 163-293, Ca 120-167, Mg 113-127, Na 11.3-12.0, Zn 7.2-8.2, Fe 2.5-4.7 mg/100 g) reported for pigeon peas grown in Botswana (Amarteifio et al., 2002). However, the calcium
and phosphorus content of the legumes in the current study were higher than the range reported for similar legumes such as Bambara groundnut, pigeon pea and lima bean (0.15-0.52%) growing in Nigeria (Fasoyiro et al., 2006). The small dried fish showed high contents of
Zn (9.6 mg/100 g) and P (1105 mg/100 g). The results of the study show that these food ingredients can be used to prevent adverse effects of micronutrient deficiencies among the vulnerable groups through regular consumption.Sunflower and pumpkin seeds are usually roasted in an open-pan iron container to a golden brown colour for 30 min using traditional charcoal burner at 1500C with continuous stirring to avoid burning of the seed coat. The seed coat is then removed and milling is done to produce fine flour which can be used to fortify other cereal flours to make high energy dense thin and thick porridges. Sunflower seeds exhibited high contents of Na (19 mg/100 g) while the pumpkin seeds exhibited high P levels (845 mg/100 g). The mineral composition of the pumpkin seeds investigated in the present study was comparable to the values reported for pumpkin Cucurbita pepo (Ca, 130 mg/100 g; Fe, 10.9 mg/100 g; Mg, 483 mg/100 g; Na, 38 mg/100 g; P, 1090 mg/100 g; Zn, 8.2 mg/100 g) grown in Shibin El-Kom, Egypt (El-Adawy&Taha, 2001). Among the vegetables, amaranth leaves were high in Ca (264 mg/100 g), Fe (46 m/100 g), Mg (1320 mg/100 g), Na (17 mg/100 g) and Zn (15 mg/100 g), while the pumpkin leaves exhibited high contents of Fe (51 mg/100 g), Mg (941 mg/100 g) and P (845 mg/100 g). Similarly, high values in Ca (41-2597 mg/100 g), Zn (1.78-9.95 mg/100 g), Fe (4.30-47.3 mg/100 g), P (16-63 mg/10 g), Na (4.7 -241 mg/100 g)
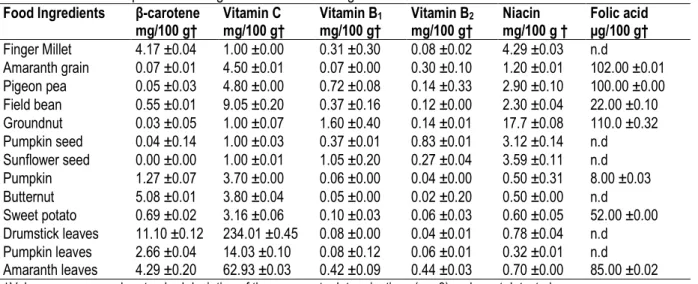
and Mg (35-253 mg/100 g) were reported in commonly consumed vegetables such as amaranth leaves, sweet gourd and pumpkin leaves grown in India and Bangladesh (Gupta et al., 2005; Hels et al., 2004). The Ca levels of finger millet and sweetpotatoes were also high (319 and 325 mg/100 g, respectively). This value was higher than the one reported (68-73.3 mg/100 g) for two sweet potato varieties (Koganesengan and Beniazuma) grown in Japan and could be attributed to varietal and geographical variations (Ishida et al., 2000). The vitamin content of indigenous food samples of the present study was shown in the Table 3. The vitamin content of the grains was generally higher in vitamin B1 and B2, niacin and folic acid when compared to the levels in vegetables, while the later contained higher β-carotene and vitamin C contents than the former. Among the grains the β-carotene content ranged from 0.0 mg/100 g in sunflower seeds to 4.1 mg/100 g in finger millet, vitamin C ranged from 1.0 mg/100 g in all the oil seeds to 9.1 mg/100 g in field bean, vitamin B1 ranged from 0.1mg/100 g in amaranth grain to 1.6mg/00 g in groundnuts, vitamin B2 ranged between 0.1 mg/100 g in finger millet to 1.0 mg/100 g in pumpkin seeds, niacin was ranged between 1.2 mg/100 g in amaranth grains to 17.7 mg/100 g in groundnuts, and folic acid ranged from 22.0 µg/100 g in field bean to 110.0 µg/100 g in groundnuts.
Table 3: Vitamin Composition of Indigenous Grains and Vegetables
Food Ingredients β-carotene Vitamin C Vitamin B1 Vitamin B2 Niacin Folic acid
mg/100 g† mg/100 g† mg/100 g† mg/100 g† mg/100 g † µg/100 g† Finger Millet 4.17 ±0.04 1.00 ±0.00 0.31 ±0.30 0.08 ±0.02 4.29 ±0.03 n.d Amaranth grain 0.07 ±0.01 4.50 ±0.01 0.07 ±0.00 0.30 ±0.10 1.20 ±0.01 102.00 ±0.01 Pigeon pea 0.05 ±0.03 4.80 ±0.00 0.72 ±0.08 0.14 ±0.33 2.90 ±0.10 100.00 ±0.00 Field bean 0.55 ±0.01 9.05 ±0.20 0.37 ±0.16 0.12 ±0.00 2.30 ±0.04 22.00 ±0.10 Groundnut 0.03 ±0.05 1.00 ±0.07 1.60 ±0.40 0.14 ±0.01 17.7 ±0.08 110.0 ±0.32 Pumpkin seed 0.04 ±0.14 1.00 ±0.03 0.37 ±0.01 0.83 ±0.01 3.12 ±0.14 n.d Sunflower seed 0.00 ±0.00 1.00 ±0.01 1.05 ±0.20 0.27 ±0.04 3.59 ±0.11 n.d Pumpkin 1.27 ±0.07 3.70 ±0.00 0.06 ±0.00 0.04 ±0.00 0.50 ±0.31 8.00 ±0.03 Butternut 5.08 ±0.01 3.80 ±0.04 0.05 ±0.00 0.02 ±0.20 0.50 ±0.00 n.d Sweet potato 0.69 ±0.02 3.16 ±0.06 0.10 ±0.03 0.06 ±0.03 0.60 ±0.05 52.00 ±0.00 Drumstick leaves 11.10 ±0.12 234.01 ±0.45 0.08 ±0.00 0.04 ±0.01 0.78 ±0.04 n.d Pumpkin leaves 2.66 ±0.04 14.03 ±0.10 0.08 ±0.12 0.06 ±0.01 0.32 ±0.01 n.d Amaranth leaves 4.29 ±0.20 62.93 ±0.03 0.42 ±0.09 0.44 ±0.03 0.70 ±0.00 85.00 ±0.02
†Values are mean and ± standard deviation of three separate determinations (n = 3). n.d = not detected Similarly, grain cereals and legumes grown in Poland
were found to be rich in thiamine (sunflower seeds, 0.55-1.05 mg/100 g; soybean, 0.91 mg/100 g; millet, 0.307 mg/100 g) and riboflavin (sunflower seeds, 0.27 mg/100 g and pumpkin seed, 0.833 mg/100 g), pyridoxine (millet,
0.46 mg/100 g; sunflower seeds, 0.69 mg/100 g; pumpkin seed, 0.17 mg/100 g and amaranth seed, 0.56 mg/100 g) and niacin (millet, 4.29 mg/100 g; sunflower seeds, 3.59 mg/100 g; pumpkin seeds, 3.12 mg/100 g and amaranth seeds, 1.02 mg/100 g) contents (Lebiedziǹska & Szefer,
2006). In addition, the ascorbic acid of 9.14 mg/100 g and 4.40 mg/100 g, and thiamine content of 0.72 mg/100 g and 0.82 mg/100 g in black beans (P. vulgaris) and pigeon pea (C.Cajanus L.) respectively, grown in Venezuela has been reported (Sangronis& Machado, 2007). Among the vegetables, the β-carotene content ranged from 0.7 mg/100 g in sweet potatoes to 5.1 mg/100 g in butternut, vitamin C ranged from 3.2 mg/100 g in sweet potatoes to 62.9 mg/100 g in amaranth leaves, vitamin B1 ranged from 0.05 mg/100 g in butternut to 0.42 mg/100 g in amaranth leaves, vitamin B2 ranged between 0.02 mg/100 g in butternut to 0.44 mg/100 g in amaranth leaves, niacin ranged between 0.3 mg/100 g in pumpkin leaves to 0.7 mg/100 g in amaranth leaves, and folic acid ranged from 8.0 µg/100 g in pumpkin to 85.0 µg/100 g in amaranth leaves. Similarly, the ascorbic acid, thiamine
and β-carotene contents of the leafy vegetables in the present was within the range of values (3.0-85 mg/100 g, 0.04-0.33 mg/100 g and 1.5-10.5 mg/100 g, respectively) reported for the same vitamins in some underutilized vegetables (Cucurbita maxima, Polygala erioptera, Amaranthus tricolor, Digera arvensis) grown in India (Gupta et al., 2005). The vitamin composition of the sweet potatoes investigated in this study was comparable to that of two Japanese sweet potatoes varieties in vitamin B1 (0.05-0.13 mg/100 g), B2 (0.04-0.06 mg/100 g), B6 (0.04-0.11 mg/100 g) and niacin (0.63-0.91 mg/100 g) contents (Ishida et al., 2000). The results of this study show that there are large differences in the vitamin composition between and within varieties of the grains and vegetables analyzed.
Table 4: Amino Acid Compositions of the Indigenous Grains Amino Acid (%) † Finger
millet Amaranth grain Pigeon peas Field bean Groundnuts Pumpkin seeds Sunflower Seeds FAO/WHO* (1991) Isoleucine 0.23 0.46 0.64 0.88 0.79 0.92 0.91 2.8 Leucine 0.55 0.74 1.38 0.83 1.58 1.85 1.47 6.6 Lysine 0.21 0.76 0.25 1.41 0.92 1.21 0.69 5.8 Cystine 0.14 0.30 0.24 0.25 0.31 0.36 0.34 Methionine 0.21 0.28 0.23 0.16 0.25 0.57 0.43
Total sulfur amino acids 0.35 0.58 0.47 0.41 0.56 0.93 0.77 2.51 Tyrosine 0.19 0.43 0.47 0.71 0.86 1.41 0.50 1.1 Phenylalanine 0.32 0.55 1.69 1.17 1.24 1.31 1.09 Total aromatic amino acids 0.51 0.98 2.16 1.88 2.10 2.72 1.59 6.32 Threonine 0.26 0.50 0.72 0.87 0.69 0.77 0.79 3.4 Tryptophan 0.09 0.20 0.15 0.21 0.25 0.41 0.31 Valine 0.45 0.72 1.09 1.29 1.41 1.58 1.30 3.5 Total essential amino acids 2.65 4.94 6.86 7.78 8.30 10.39 7.83 Histidine 0.15 0.33 0.66 0.65 0.57 0.72 0.52 1.9 Arginine 0.27 1.16 1.11 1.42 2.78 3.68 2.02 Aspartic acid 0.39 1.07 1.84 2.54 2.71 2.89 2.12 Glutamic acid 1.00 1.82 3.14 3.01 3.96 4.49 4.07 Serine 0.33 0.82 0.99 1.31 1.23 1.49 1.04 Proline 0.36 0.53 0.85 1.00 1.04 0.96 1.03 Glycine 0.24 1.01 0.69 0.88 1.47 2.28 1.27 Alanine 0.39 0.54 0.91 1.02 1.07 1.35 1.15 Total non-essential amino acid 3.13 7.28 10.19 11.83 14.83 17.86 13.22
†Values are averages of three determinations. , *Data from FAO/WHO (1991) reference pattern of essential amino acid
requirement. 1Cysteine+methionine, 2Tyrosine+phenylalanine
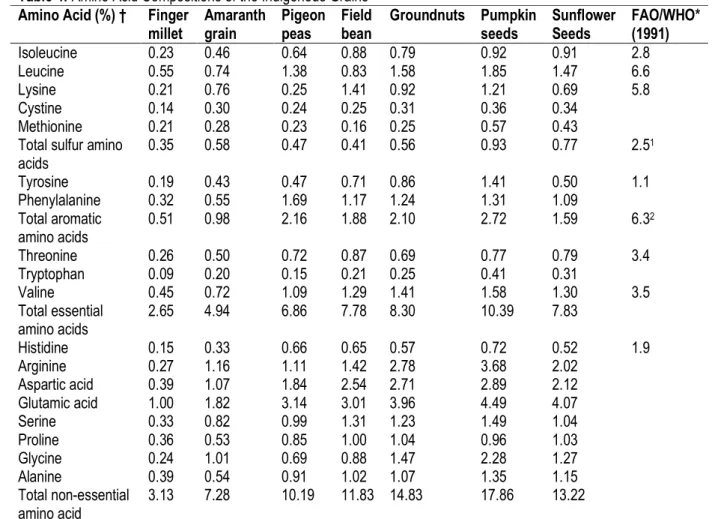
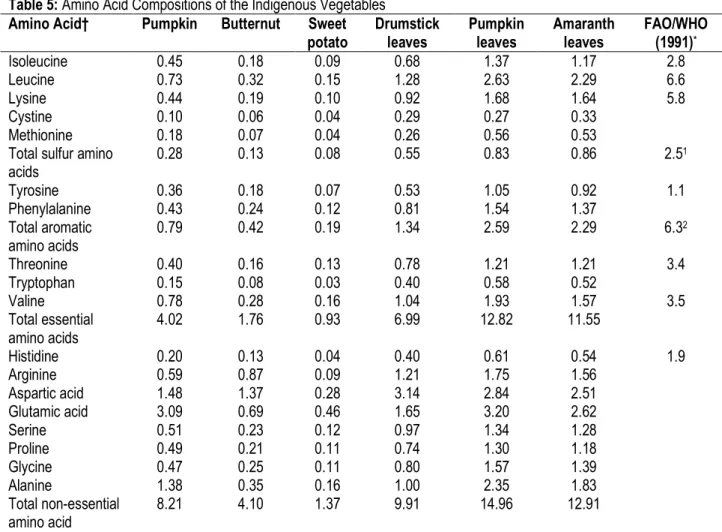
Amino acid profiles: The amino acid composition of the indigenous grains and vegetables compared with the
FAO/WHO reference pattern EAA (FAO/WHO, 1991) are given in Table 4 and 5. Amino acids, a class of
biologically active compounds present in food and beverages, are important for human nutrition and affect the quality, including taste, aroma and colour (Siddhuraju& Becker, 2005). The oils seeds (pumpkin and sunflower seeds) and ground nut had higher amino acid content as compared to the other foods. The grains exhibited appreciable amounts of the essential amino acid leucine, lysine, tyrosine and phenylalanine. The amino acid composition of the grains was higher than those of the vegetables investigated in this study. Among the grains in this study, pumpkin seeds and groundnuts had the highest total essential amino acids (10.39 and 8.30% respectively) which included 0.93 % and 0.56 % of total sulphur containing amino acids respectively. Similarly, the essential amino acid content of the groundnuts in the present study was comparable to that of edible nuts such as almonds, Brazil nut, cashew nut, hazelnut, macadamia, pecan, pine nut, pistachio, walnut and Virginia peanut growing in the U.S.A. and were also shown to be limiting in threonine and the sulphur containing amino acids (Venkatachalam & Sathe, 2006). A previous study has also showed that amaranth has high contents of lysine, arginine, tryptophan and sulphur containing amino acids (Gorinstein et al., 2007). The vegetables of the current study exhibited excellent amino acid composition with the highest essential amino acids being observed in pumpkin leaves (12.82 %) and amaranth leaves (11.55%) with the sulphur containing amino acids accounting for 0.83 % and 0.86 % respectively. The amino acid composition of the sweet potatoes investigated in this study was similar to the profile reported for two sweet potatoes varieties (Koganesengan and Beniazuma) in Japan (Ishida et al., 2000). The amino acid profile of some of the grains and vegetable ingredients investigated in the current study were excellent sources of essential amino acids and when consumed in combination would ensure that the requirements of the limiting amino acids in each are met. This is an indication of the possible role of grains and indigenous vegetables as sources of essential amino acids in the diets of the vulnerable groups hence the potential use in addressing nutrition and food security in Kenya. It is apparent that the indigenous vegetable protein can be used to complement the protein from cereals and legumes that are low in essential amino acids. However, the amino acid profiles of all the food
ingredients studied were lower than the FAO/WHO (1991) reference pattern, but these food ingredients can be used in combination to achieve the levels of the amino acids required in the diet. Fatty acid profile: The GC-MS analysis of the lipid extracts from the indigenous foods revealed 6 major fatty acids (Table 6). Palmitic acid, linoleic and α-linolenic acids were the most abundant fatty acids in most of the food ingredients. All the food ingredients had high amounts of unsaturated fatty acids which consisted mainly of linoleic and oleic acids. The presence of high amounts of the essential linoleic acid suggests that these food ingredients are highly nutritious, due to their ability to reduce serum cholesterol. The grains had substantial amounts of palmitic, oleic and linoleic acid. The profile of the grains indicates that the lipids from these foods are a good source of the nutritionally essential linoleic acid and the unsaturated oleic acid. The lipid pattern of the sunflower and pumpkin seed investigated in the current study is comparable with that of edible oils extracted from sunflower and grape seed oils (Tan &Che Man, 2000). The fatty acid profile of the legumes (field bean and pigeon pea) of the current study were comparable to legumes (soybean and lupin) grown in Turkey in their contents of palmitic acid (19.6-26.2 and 5.3-12.0 respectively), stearic acid (4-5.3 and 3.3-4.8 respectively), oleic acid (9.2-11.4 and 21.5-34.9 respectively), linoleic acid (52-54 and 37-54.7 respectively), and α-linolenic acid (4.7-10.3 and 4.2-9.2 respectively) (Uzun et al., 2007). In addition, the fatty acid content of the oil seeds was comparable to that of other oil seeds such as peanuts and sesame in their palmitic acid (5.3-10.4), stearic acid (3.7-4.4), oleic acid (36.8-5k2.8), linoleic acid (27.1-45.3) contents, while no α-linolenic acid was detected in the peanuts as also reported in our study (Uzun et al., 2007). The fatty acid profile of the pumpkin seeds of the current study is within the range of reports of other species of Cucurbita grown in the USA and Eritrea containing an average of 11.7-21.3% palmitic, 4.0-10.4% stearic, 13.5-37.2% oleic, and 40.3-59.0% linoleic acid (Applequist et al., 2006; Younis et al., 2000). The essential fatty acids (EFA), α-linolenic and palmitic acids, were found in high amount (21-60%) in the leafy vegetables. This is an indication of the significance of indigenous leafy vegetables as good supplements in human diets.
Table 5: Amino Acid Compositions of the Indigenous Vegetables Amino Acid† Pumpkin Butternut Sweet
potato Drumstick leaves Pumpkin leaves Amaranth leaves FAO/WHO (1991)* Isoleucine 0.45 0.18 0.09 0.68 1.37 1.17 2.8 Leucine 0.73 0.32 0.15 1.28 2.63 2.29 6.6 Lysine 0.44 0.19 0.10 0.92 1.68 1.64 5.8 Cystine 0.10 0.06 0.04 0.29 0.27 0.33 Methionine 0.18 0.07 0.04 0.26 0.56 0.53
Total sulfur amino acids 0.28 0.13 0.08 0.55 0.83 0.86 2.51 Tyrosine 0.36 0.18 0.07 0.53 1.05 0.92 1.1 Phenylalanine 0.43 0.24 0.12 0.81 1.54 1.37 Total aromatic amino acids 0.79 0.42 0.19 1.34 2.59 2.29 6.32 Threonine 0.40 0.16 0.13 0.78 1.21 1.21 3.4 Tryptophan 0.15 0.08 0.03 0.40 0.58 0.52 Valine 0.78 0.28 0.16 1.04 1.93 1.57 3.5 Total essential amino acids 4.02 1.76 0.93 6.99 12.82 11.55 Histidine 0.20 0.13 0.04 0.40 0.61 0.54 1.9 Arginine 0.59 0.87 0.09 1.21 1.75 1.56 Aspartic acid 1.48 1.37 0.28 3.14 2.84 2.51 Glutamic acid 3.09 0.69 0.46 1.65 3.20 2.62 Serine 0.51 0.23 0.12 0.97 1.34 1.28 Proline 0.49 0.21 0.11 0.74 1.30 1.18 Glycine 0.47 0.25 0.11 0.80 1.57 1.39 Alanine 1.38 0.35 0.16 1.00 2.35 1.83 Total non-essential amino acid 8.21 4.10 1.37 9.91 14.96 12.91
†Values are averages of three determinations. *Data from FAO/WHO (1991) reference pattern of essential amino acid
requirement.1Cysteine + methionine. 2Tyrosine + phenylalanine
Table 6: Fatty Acid Composition of the Indigenous Foods Food ingredients
Fatty acid content (%) † Palmitic acid (16:0) Stearic acid (18:0) Oleic acid (18:1) Linoleic acid (18:2) α-linolenic acid (18:3) Finger millet 20.8 ±0.01 4.8 ±0.35 38.4 ±0.09 20.3 ±0.00 3.9 ±0.00 Amaranth grain 19.4 ±0.08 3.4 ±0.01 34.3 ±0.37 36.3 ±0.03 0.9 ±0.01 Pigeon pea 26.2 ±0.00 4.0 ±0.01 9.2 ±0.01 53.7 ±0.19 4.7 ±0.44 Field bean 19.6 ±0.01 5.3 ±0.02 11.4 ±0.02 51.8 ±0.24 10.3 ±0.18 Groundnut 10.4 ±0.04 3.9 ±0.02 50.5 ±0.37 28.3 ±0.02 n.d Pumpkin seed 17.7 ±0.18 9.0 ±0.40 31.4 ±0.01 41.4 ±0.33 n.d Sunflower seed 4.8 ±0.77 5.3 ±0.06 53.9 ±0.04 34.8 ±0.00 n.d Sweet potato 33.6 ±0.00 6.7 ±0.02 8.9 ±0.06 41.1 ±0.01 7.1 ±0.00 Pumpkin 24.4 ±0.15 3.5 ±0.02 35.7 ±0.08 21.9 ±0.06 13.9 ±0.26 Butternut 19.5 ±0.02 8.6 ±0.06 29.5 ±0.01 33.5 ±0.06 8.1 ±0.02 Drumstick leaves 20.9 ±0.00 2.1 ±0.35 2.2 ±0.01 6.8 ±0.00 60.4 ±0.04 Pumpkin leaves 23.0 ±0.01 3.3 ±0.08 3.5 ±0.00 4.5 ±0.02 55.2 ±0.04 Amaranth leaves 18.6 ±0.77 1.5 ±0.54 3.0 ±0.10 13.7 ±0.54 53.3 ±0.49 †Values are mean and ± standard deviation of three separate determinations (n = 3). n.d. Not detected by GC analysis
Essential fatty acids (α-linolenic and palmitic acids) are important for brain and neural tissue development. The evidence for abnormal development of children on a low intake of essential fatty acids in the Western world is becoming clear with the establishment of more sophisticated methods of analysis (Michaelsen et al., 2009). There are two types of essential fatty acids, the n-6 and the n-3 polyunsaturated fatty acids (PUFAS), which in most diets are provided by vegetable oils in the form of linoleic acid (C18:2n-6) and α-linolenic acid (C18:3n-3), respectively. α-Linolenic acid (an omega-3 fatty acid), is a
precursor in the biosynthesis of eicosapentaenoic acid (EPA) and docosahexaenoic acid (DHA). DHA is one of the predominant fatty acids in the human brain and has been found to play an important role in brain development in infants (Erastos et al., 2007). Linoleic acid (an omega-6 fatty acid) is the metabolic precursor of eicosanoids which are a group of biologically important lipids such as prostaglandins, thromboxanes, lipoxins and leukotrienes (Erastoset al., 2007). This group of lipids plays a crucial role in immunity, inflammation and blood clotting.
CONCLUSION
The nutrient composition of the indigenous cereals, legumes, oil seeds, vegetables and fish indicated that they are good sources of essential nutrients. Therefore, they could make substantial contributions to intakes of carbohydrates, protein, fat and fibre as well as vitamins and minerals. All the indigenous food contained appreciable amount of fatty acids and amino acids which could be potentially used in combination to meet the
minimum daily requirements for these essential nutrients. Consequently, these food ingredients could help in overcoming malnutrition and hunger among the vulnerable groups in Kenya. Our previous studies on the presence of bioactive compounds and their antioxidant and antidiabetic properties also indicate that these indigenous foods contain health functionalities that are important for vulnerable groups.
ACKNOWLEDGEMENT
The authors wish to thank the German Academic Exchange Services (Deutscher Akademischer Austausch
Dienst - DAAD) for financial support, which was part of funding for PhD study of the first author.
REFERENCES
Amarteifio JO, Munthali DC, Karikari SK, Morake TK, 2002. The composition of pigeon peas (Cajanus cajan (L.) Mill sp.) grown in Botswana. Plant Foods for Human Nutrition 57:173-177. AOAC, 1990. Official methods of analysis of the
Association of Official Analytical Chemists, 15th Ed. Washington DC: AOAC.
AOAC, 2000.Official methods. Arlington, VA: Association of Official Analytical Chemists International. Applequist WL, Avula B, Schaneberg BT, WangY, Khan
IA, 2006.Comparative fatty acid content of seeds of four Cucurbita species grown in a common (shared) garden.Journal of Food Composition and Analysis 19:606-611. Ball GFM, 2005. Vitamins in foods, analysis, bioavailabity
and stability. CRC, Boca Raton.
Barba de la Rosa AP, Fomsgaard IS, Laursen B, Mortensen AG, Olvera-Martίnez L, Silva-Sánchez L, Mendoza-Herrera A, González-Castańeda J, De Leŏn-Rodriguez A, 2009. Amaranth (Amaranthus hypochondriacus) as an alternative crop for sustainable food production: Phenolic acids and flavonoids with potential
impact on its nutraceutical quality. Journal of Cereal Science 49:117-121.
Central Bureau of Statistics (CBS), Ministry of Health (MOH), and ORC Macro. 2010. Kenya Demographic Health Survey, Calverton, MD: CBS, MOH and ORC Macro, Kenya.
Dixon J, Nalley L, Kosina P, La Rovere R, Hellin J, Aquino P, 2006. Adoption and economic impact of improved wheat varieties in the developing world.Journal of Agricultural Sciences 144:489-502.
El-Adawy TA, Taha KM, 2001.Characteristics and composition of watermelon, pumpkin and paprika seed oils and flours.Journal of Agriculture and Food Chemistry 49:1253-1259. Erasto P, Grierson DS, Afolayan AJ, 2007. Evaluation of antioxidant activity and the fatty acid profile of the leaves of Vernoniaamygdalina growing in South Africa. Food Chemistry 104:636-642. FAO/WHO, 1991.Protein quality evaluation.Reports of a
Joint FAO/WHO Expert Consultation. Rome, Italy: Food and Agriculture Organization of the United Nations.
FAO, 2005.Helping to build a world without hunger.Food and Agriculture Organization of the United Nations. http://www.fao.org/spfs/.
Fasoyiro SB, Ajibade SR, Omole AJ, Adeniyan ON, Farinde EO, 2006. Proximate, minerals and antinutritional factors of some underutilized grain legumes in south-western Nigeria. Nutrition and Food Science 36(1):18-23.
Gorinstein S, Vargas OJ, Jaramillo NO, Salas IA, Ayala AL, Arancibia.Avila P, Toledo F, Katrich E, Trakhtenberg S, 2007. The total polyphenols and the antioxidant potentials of some selected cereals and pseudocereals. European Food research and Technology 225:321-328. Gupta S, Lakshmi AJ, Manjunath MN, Prakash J, 2005.
Analysis of nutrient and antinutrient content of underutilized green leafy vegetables. LWT Food Science and Technology 38(4):339-345. Hedge PS, Chandra TS, 2005. ERS spectroscopic study
reveals higher free radical quenching potential in kodo millet (Paspalum scrobiculatum) compared to other millets. Food Chemistry 92:177-182. Hels O, Larsen T, Christensen LP, Kidmose U, Hassan
N, Thilsted SH, 2004. Contents of iron, calcium, zinc and β-carotene in commonly consumed vegetables in Bangladesh. Journal of Food Composition and Analysis 17(5):587-595. Hobbs PR, 2007. Conservation agriculture: what is it and
why it is important for future sustainable food production. Journal of Agricultural Science 145:127-137.
Ishida H, Suzuno H, Sugiyama N, Innami S, Tadokoro T, Maekawa A, 2000. Nutritive evaluation on chemical components of leaves stalks and stems of sweet potatoes (Ipomoea batataspoir). Food Chemistry 68(3):359-367.
Islam S, 2006. Sweet potato (Ipomoea batatas L.) leaf: Its potential effect on human health and nutrition. Journal of Food Science 71(2):13-21. Lebiedzińska A,Szefer P, 2006. Vitamins B in grain and cereal–grain food, soy-products and seeds.Food Chemistry 95(1):116-122.
Lin P, Lai H, 2006. Bioactive compounds in legumes and their germinated products. Journal of Agriculture and Food Chemistry 54:3807-3814
Luthria DL, Pastor-Corrales MA, 2006. Phenolic acids content of fifteen dry edible bean (Phaseolus vulgaris L.) varieties. Journal of Food Composition and Analysis 19:205-211. Michaelsen KF, Hoppe C, Roos N, Kaestel P, Stougaard
M, Lauritzen L, Molgaad C, Girma T, Friis H,
2009. Choice of foods and ingredients for moderately malnourished children 6 months to 5 years of age.Food and Nutrition Bulletin 30:S344-405
Oboh G, Ademiluyi AO, Akindahunsi AA, 2009. Changes in polyphenols distribution and antioxidant activity during fermentation of some underutilized legumes.Food Science and Technology International 15(1):0041-46. Official journal of the European Union.Amino acid
analysis, 2009.Commission Regulation of the Standing Committee on the Food Chain and Animal Health. (EC) No. 152/2009
OmuetiO, 2009. Development and quality evaluation of low-cost, high-protein weaning food types, Prowena and Propalm from soybean (Glycine max), ground nut (Arachis hypogea) and Cray fish (Macrobrachium spp.). British Food Journal 111(2):196-204.
Orech FO, Christensen DL, Larsen T, Friis H, Aagaard-Hansen J, Estambale BA, 2007. Mineral content of traditional leafy vegetables from Western Kenya. International Journal of Food Sciences and Nutrition 58(8):595-602. Özogul Y,Özogul F, 2007. Fatty acid profiles of
commercially important fish species from the Mediterranean, Aegean and Black Seas. Food Chemistry 100:1634-1638.
Ragaee S, Abdel-Aal EM, Noaman M, 2006. Antioxidant activity and nutrient composition of selected cereals for food use.Food Chemistry 98:32-38. Sangronis E, Machado CJ, 2007. Influence of germination on the nutritional quality of Phaseolus vulgaris and Cajanus cajan. LWT Food Science and Technology 40:116-120. Siddhuraju P, Becker K, 2005. Nutritional and
antinutritional composition, in vitro amino acid availability, starch digestibility and predicted glycemic index of differentially processed mucuna beans (Mucuna pruriens var. utilis): an under-utilized legume. Food Chemistry 91:275-286.
Solomon M, Owolawashe H, 2007. The Analyses Of Amino Acid, Fatty Acid And Mineral In A Legume-Cereal Based Complementary Food Blend Used In Jos, Nigeria. The Internet Journal of Nutrition and Wellness Volume 4 Number 1. Tan C, Che Man YB, 2000. Differential scanning calorimetric analysis of edible oils: comparison of thermal properties and chemical composition.
Journal of American Oil Chemists Society, 77(2):143-155.
Uzun B, Arslan C, Karhan M, Toker C, 2007. Fat and fatty acids of white lupin (Lupinus albus L.) in comparison to sesame (Sesamum indicum L.).Food Chemistry 102:45-49.
UNICEF, 1998.The state of the world’s children. Oxford University press. New York.
Venkatachalam M, Sathe SK, 2006.Chemical composition of selected edible nut seeds.Journal of Agriculture and Food Chemistry 54:4705-4714.
Villegas R, Gao Y, Yang G, Li H, Elasy TA, Zheng W, Shu XO, 2008. Legume and soy food intake and the incidence of type 2 diabetes in the Shanghai Women’s Health Study.American Journal of Clinical Nutrition 87(1):162-167.
WHO/WFP/UNICEF.Joint Statement on Improving Existing Recommendations on Treatment of Moderate malnutrition in Children under 5. Volume 1, Number 3, October, 2008, Geneva Younis YM, Ghirmay S, Al-Shihry SS, 2000. African
Cucurbitapepo L.: properties of seed and variability in fatty acid composition of seed oil. Phytochemistry 54:71-75.