HAL Id: hal-02163194
https://hal.archives-ouvertes.fr/hal-02163194
Submitted on 28 Jun 2019HAL is a multi-disciplinary open access archive for the deposit and dissemination of sci-entific research documents, whether they are pub-lished or not. The documents may come from teaching and research institutions in France or abroad, or from public or private research centers.
L’archive ouverte pluridisciplinaire HAL, est destinée au dépôt et à la diffusion de documents scientifiques de niveau recherche, publiés ou non, émanant des établissements d’enseignement et de recherche français ou étrangers, des laboratoires publics ou privés.
Interleaved spatial/spectral encoding in ultrafast 2D
NMR spectroscopy
Bertrand Plainchont, Patrick Giraudeau, Jean-Nicolas Dumez
To cite this version:
Bertrand Plainchont, Patrick Giraudeau, Jean-Nicolas Dumez. Interleaved spatial/spectral en-coding in ultrafast 2D NMR spectroscopy. Journal of Magnetic Resonance, Elsevier, 2019, �10.1016/j.jmr.2019.06.010�. �hal-02163194�
1
Interleaved spatial/spectral encoding in
ultrafast 2D NMR spectroscopy
Bertrand Plainchont
a, Patrick Giraudeau
a,b,*, Jean-Nicolas Dumez
a,*
a CEISAM, CNRS UMR6230, Université de Nantes, 44300 Nantes, France b Institut Universitaire de France, 75005 Paris, France
* Corresponding authors.
E-mail addresses: [email protected] / [email protected]
Abstract
The possibility to record a full 2D spectrum in less than a second using ultrafast 2D NMR (UF2DNMR) is beneficial in many applications. However, the spatial encoding process on which UF2DNMR is based sets specific constraints on the spectral width and resolution of the resulting spectra. To overcome these limitations, a tailored encoding method using spatial/spectral pulses (SPSP) can be employed as an alternative to the traditional linear spatial encoding of interactions. Here we analyze and further develop this alternative spatial encoding strategy. We first carry out numerical simulations to describe the features of bidimensional SPSP pulses. Sidebands are identified along the spectral dimension of the excitation profile. An interleaved excitation scheme is then developed and implemented experimentally to suppress the unwanted signals that arise from these harmonic sidebands. Two examples are shown to illustrate the potential of the proposed approach. An ultrafast selective TOCSY spectrum is recorded to access sub-spectra and fully assign 1H NMR resonances of individual residues of cyclosporin A. An ultrafast HSQC spectrum of a mixture of metabolites is recorded with an optimized spectral width in the spatially encoded dimension.
Keywords
Ultrafast 2D NMR, spatial encoding, spatial/spectral pulses, excitation sidebands, interleaved excitation, TOCSY, HSQC
2
1. Introduction
Two-dimensional (2D) NMR spectroscopy is a rich source of information for structure and dynamics studies of a large variety of systems, with applications in chemistry, biology and medicine. The original and most frequently used scheme for the collection of 2D NMR data is based on an extension of Fourier transform NMR to a second dimension. The additional, indirect dimension is classically sampled in a discrete, stepwise manner, through the consecutive acquisition of 1D spectra where an additional amplitude or phase modulation of the signal is created as a function of an incremented time variable. 2D Fourier transformation of the acquired 2D time-domain data then provides a 2D frequency-domain dataset that can take multiple forms according to the large panoply of 2D correlation experiments [1]. However, this stepwise implementation results in long experiment durations, from several minutes to hours, which prevent the real-time observation of phenomena occurring in a short time scale. Many alternative methods have been developed with the motivation to perform 2D NMR experiments in a faster manner and unlock new applications or simply collect more 2D spectra in the same amount of time [2]. Ultrafast 2D NMR (UF2DNMR) is one of these methods and has been exploited during the last 15 years for a variety of applications such as reaction monitoring, complex mixture analysis or high-throughput metabolomics [3].
UF2DNMR makes it possible to record a 2D NMR spectrum in a single scan of less than one second [4, 5]. In this approach, the indirect dimension is created by spatially encoding the spin interactions along one of the sample’s dimension (typically z), i.e., imparting a phase variation of the form 𝜙(𝑧) = 𝐶 𝛺) 𝑧, where C is a spatial-encoding constant, to the spins’
magnetization. A gradient-driven readout is used to decode the information. The resulting signal consists of a series of echoes, each corresponding to a different chemical-shift offset. In the most frequent implementation of UF2DNMR, spatial encoding is achieved with a pair of adiabatic frequency-swept pulses applied with bipolar gradient pulses, resulting in a linear relationship between the positions of the echoes in k-space (where k is the gradient area) and the chemical-shift values [6]. The direct dimension is obtained with repeated bipolar gradient readout, analogous to echo planar spectroscopic imaging (EPSI) [7], that allows the development of a signal modulation that is revealed by Fourier transform. The two-dimensional data matrix acquired in the (k, t) domain yields a 2D spectrum in the (k,W) domain.
The speed of UF2DNMR experiments comes with a price. One limitation notably arises because of the use of pulsed-field gradients during acquisition: the large frequency dispersion induced by the magnetic field gradient requires a large receiver bandwidth, which results in a higher noise level than with conventional acquisition. In combination to possible diffusion effects, it causes important sensitivity penalty in the resulting spectra. This limitation can be counterbalanced with the coupling of UF2DNMR with hyperpolarization methods like dynamic nuclear polarization (DNP) [8, 9] or parahydrogen-based signal amplification by reversible exchange (SABRE) [10, 11]. This is particularly relevant for single-shot polarization methods, which are incompatible with most classic 2D NMR pulse sequences. Another limitation is due to the capabilities of gradient hardware in high-resolution NMR, which limits the accessible spectral width and resolution in both dimensions for single-scan acquisitions. Several methodological developments that address the spectral width and resolution restrictions of UF2DNMR experiments have been reported [3]. These include an interleaved acquisition method, in which multiple consecutive scans with shifted trajectories in the (k, t) domain are combined to increase the spectral width [5]. A method to shift spectral regions in the spatially
3
encoded dimension with a band-selective refocusing pulse flanked by folding gradients has been proposed by Pelupessy and coworkers [12]. An appropriate phase cycling of the selective pulse in multiple scans is used to unfold spectral regions. A so-called spatial/spectral (SPSP) encoding scheme has also been proposed by Shrot and Frydman [13]. This approach departs from the linear relation between frequency offset and echo position in k-space, and instead assigns arbitrary k-space positions to selected frequency offsets. It relies on the use of 2D selective pulses with both spatially and spectrally selective dimensions [14, 15], initially developed for MRI applications to perform water/fat signal selection/elimination [16-18], and nowadays used extensively for hyperpolarized 13C in vivo imaging [19-21]. While SPSP encoding alleviates some of the constraints that arise from the use of magnetic-field gradients during acquisition, it also comes with its own limitations. In particular, when a zig-zag trajectory is used in the (k, t) domain, the selection profile of SPSP pulses consists, in the spectral dimension, of a central band at the targeted offset, flanked by a series of harmonic excitation sidebands, as in the case of DANTE [22] or binomial [23, 24] pulses. A possible solution to avoid excitation of non-targeted resonances is to reject the sideband response towards empty spectral regions. Otherwise, without any control of the sidebands, the spectral information may be compromised by the presence of additional signals and may lead to wrong assignments and/or peak overlaps in 2D correlation spectra.
In the following sections, on the basis of a theoretical analysis and numerical simulations, we propose a method to eliminate undesirable excitation sidebands by interleaving trajectories in the excitation (k, t) domain. This approach is inspired by interleaved selection schemes developed in MRI to collect images or spectra of regions with a complex shape [25, 26]. Applied to UF2DNMR, this method is well adapted to the study of samples with high dispersion of chemical shifts. A detailed description of SPSP pulse design with a focus on important parameters is provided to introduce interleaved SPSP excitation. The principle is then exemplified experimentally with both homonuclear and heteronuclear applications using two of the most commonly employed pulse sequences. A selective UF 2D TOCSY spectrum to access individual spin systems of cyclosporin A and an UF HSQC spectrum of a mixture of metabolites are recorded as illustrations.
2. Theory
2.1. Spatial encoding
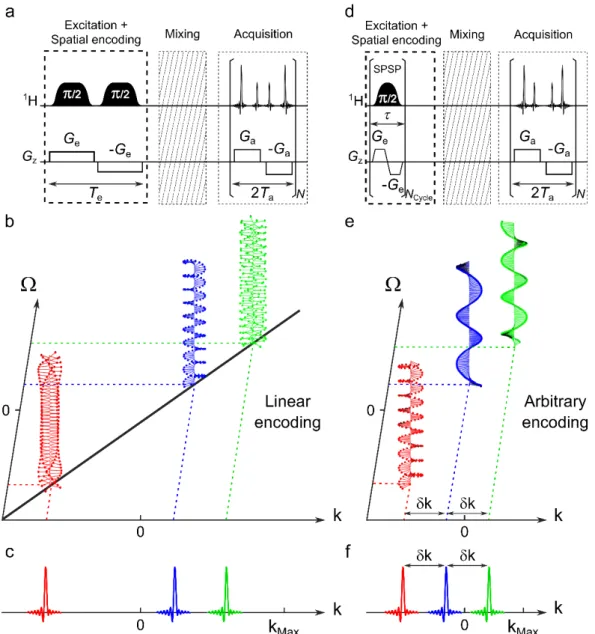
UF2DNMR experiments include an excitation and encoding step followed by a mixing sequence and acquisition. Fig. 1a shows a pulse sequence scheme for the most frequent implementation of UF2DNMR, in which the encoding step consists of a pair of adiabatic frequency-swept pulses applied with bipolar gradient pulses. The effect of this block is the creation of a position- and frequency-offset- dependent phase for the transverse spin magnetization. This spatial encoding can be viewed as a spatial winding of the spin magnetization along the z-axis under a helical form (see Fig. 1b). Each individual helix has a specific pitch proportional to the chemical shift value. The unwinding of the spin magnetization during the gradient-driven acquisition leads to the detection of an echo for each encoded resonance frequency (Fig. 1c). The acquisition is most conveniently described by using the variable
4
𝑘(𝑡) = 𝛾-. 𝐺-(𝑡′)𝑑𝑡′ 2
3
(1) that is commonly used in MRI, defining the so-called k-space. Echoes appear at positions ki in the k-space, the values of which have a linear relation with the frequency offsets Wi: 𝑘i=
−𝐶 𝛺i, where C is a constant depending on the linear encoding method [27]. Assuming square shaped gradients, the span in k-space detectable during acquisition ∆𝑘- depends on the
acquisition gradient strength Ga and duration Ta:
∆𝑘- = 𝛾-𝐺-𝑇-. (2)
This k-space detection range defines the spectral width in the encoded dimension of the UF2DNMR spectra. Because of the linear relation between k and W, this spectral width SWk can be expressed in frequency units:
𝑆𝑊: =∆;<
= =
><?<@<
= . (3)
In this spatially encoded dimension, the detected echoes have a sinc shape, with a width of the order of L-1, where L is the length of the sample detection area. In k-space, the resolution is proportional to the width of echoes. It comes that the resolution dnk, expressed in frequency units, is given by:
δ𝜈: =D=C. (4)
In all linear encoding methods, the proportionality constant C depends on the encoding duration Te. For example, for the encoding scheme shown in Fig. 1a, 𝐶 = 𝑇E/𝐿. Resolution can
thus be improved by increasing the encoding duration but at the cost of sensitivity losses due to transverse relaxation and diffusion [28, 29]. In the frequency dimension of the (k,W) domain, the spectral width SWW is simply given by the inverse of the sampling interval Δ𝑡 = 2𝑇a:
𝑆𝑊K =L@C
<. (5)
After Fourier transform, any signal whose frequency lies outside the effective spectral width appears folded in the frequency domain in a similar way to what occurs in the indirect domain of conventional 2D NMR spectra when the Nyquist condition is violated.
In UF2DNMR experiments with linear encoding, the spectral characteristics defined above are all closely related. A combination of Eqs. (3), (4) and (5) yields a relation giving an overview of the interdependence of the important parameters:
𝛾-𝐺-𝐿 = 2MNQRO MNP
O . (6)
The relation between the two spectral widths in the (k,W) domain and the resolution in the spatially encoded dimension highlights the compromise that has to be made, which depends
5
on the maximum available gradient strength. This is a key point for the setup of UF2DNMR experiments. In terms of spectral width, typical values for a single-scan experiment at 9.4 T on a conventional probe are 6 × 6 ppm for a 1H-1H COSY and 40 × 4 ppm for a 13C-1H HSQC [30]. The higher the magnetic field, the more problematic this limitation becomes. For example, at 16.4 T, single-scan spectral width values are reduced to 2.5 × 2.5 ppm for a 1H-1H COSY and 15 × 3 ppm for a 13C-1H HSQC.
Fig. 1. Spatial encoding schemes in ultrafast 2D NMR and spatial winding of the magnetization along the sample, with the corresponding echo position in the k-space dimension. After spatial encoding, each of the three chemical-shift offsets is associated to a specific helix pitch. The unwinding of each helix during the acquisition gradient Ga leads to an echo when the spatially dependent phase of the transverse spin magnetization is refocused along the sample. (a) Linear encoding with a pair of adiabatic frequency-swept pulses applied during a bipolar gradient produces a linear dependence of
k-space position versus chemical shift value (b). (c) The signal consisting in a series of echoes is decoded
in the k-space range during the acquisition gradient Ga. (d) Arbitrary encoding with spatial/spectral pulses allows arbitrary position in the space for each chemical shift (e), and an optimally reduced k-space acquisition range with equally k-spaced echoes (f).
6
2.2. Spatial/spectral encoding: concept
Spatial/spectral encoding (Fig. 1d) allows one to break away from the basic linear dependence between ki and Wi of the classic encoding scheme [13]. In this approach, multiple spin resonances are simultaneously manipulated to assign them the desired spatial windings (see Fig. 1e). In other words, the k-space position of the echo is arbitrarily chosen for each offset. This is achieved by using custom 2D spatial/spectral (SPSP) pulses to perform the encoding step (Fig. 1f). In this non-linear encoding scheme, the pseudo-frequency axis of the spatially encoded dimension does not exist anymore and signals are marked instead by k-axis indexes. The spectral width cannot be expressed in frequency units and the only relevant parameter is the maximum k-space range Dk. SPSP pulses permit to optimize the filling of the
k-space with an evenly spacing of signals by a value dk at different indexes.
SPSP pulses involve the simultaneous application of radiofrequency pulses and oscillating gradients. As is usually the case for selective pulses, their design requires a priori knowledge of the targeted 1D resonance frequencies, which can be obtained from the analysis of a 1D spectrum. For UF2DNMR, the response of the transverse spin magnetization at the end of the encoding step corresponds to a target winding pattern for each selected resonance frequency with a specific pitch of the helix (equivalent to a k-space position). Once defined from a 1D spectrum analysis, (ki, Wi) pairs are used to build a target spatial/spectral profile for transverse spin magnetization with spatial winding in the (z, W) domain which is the sum of the individual desired response to the SPSP pulse:
𝑀TUV-WXEY(𝑧, Ω) = \ 𝑒^;_` 𝑆(𝑧, Ω − Ω )) a
)bC
(7) where 𝑆(𝑧, Ω − Ω)) is the local profile whose width in the frequency dimension defines the
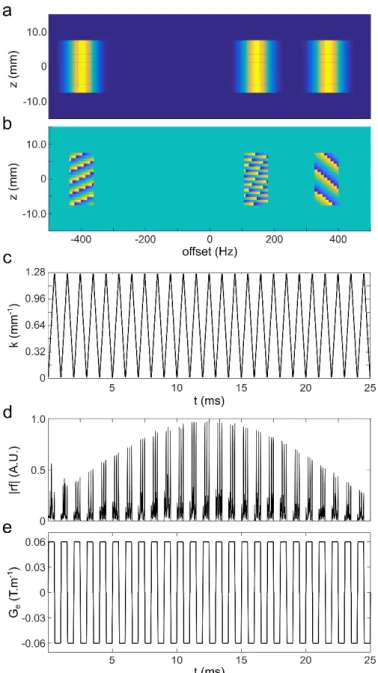
spectral resolution. Fig. 2a and b represent examples of the amplitude and phase components of a 2D target profile 𝑀TUV-WXEY for three (ki, Wi) pairs. Here, the amplitude of the profile is set with a rectangular shape in spatial dimension and a Gaussian shape in spectral dimension for each of the three selected offsets (Fig 2a).
The design of an SPSP pulse consists of finding the radiofrequency and gradient waveforms that yield, starting from equilibrium magnetization MZ, a transverse spin magnetization as close as possible to the target profile 𝑀TUV-WXEY. Many approaches to the design of SPSP pulses have been proposed in the field of MRI [14, 17, 18, 31-33]. Here we follow the approach of Refs [13, 33], by choosing a priori an encoding gradient waveform Ge(t), and relying on the small-tip-angle approximation [34] to obtain B1(t) from 𝑀TUV-WXEY. In this approximation, the transverse spin magnetization created during a total pulse duration Tpulse is: 𝑀TU(𝑧, Ω) ∝ . 𝐵C(𝑡) 𝑒^K(@efghij2) 𝑒^;(2)` @efghi 3 𝑑𝑡 (8) where 𝑘(𝑡) = ∫@efghi𝛾E𝐺E(𝑡l) 𝑑𝑡′
2 is the k-space trajectory (Fig. 2c) defined by the integral
7
the transverse magnetization at the end of the pulse and the RF waveform when seen in the (k, t) domain. In analogy with the description of EPSI as a walk in detection (k, t) domain, SPSP pulses can be seen as a walk in excitation (k, t) domain.
The B1(t) radiofrequency shape for SPSP pulses is calculated by solving an expression where the target pattern (7) is substituted into Eq. (8). In practice, the equation is discretized on a grid that corresponds to the (k, t) trajectory for the selected gradient waveform. Since the grid is not Cartesian, a non-uniform Fourier transform (nuFT) algorithm is used to retrieve
B1(t). In the example presented in Fig. 2, the radiofrequency shape (Fig. 2d) was calculated from the target profile with a nuFT algorithm based on conjugate gradients which converged within 3 iterations.
2.3. Spatial/spectral encoding: parameter relations
The relations between encoding/decoding parameters and the spectra’s properties are modified when SPSP encoding is used, and depend on the choice of SPSP pulses. Here we choose to use a gradient waveform that consists of a train of bipolar square shaped pulses, shown in Fig. 2e, resulting in a zig-zag trajectory in excitation (k, t) domain, as shown in Fig. 2c. The 2D selective pulse then consists of a train of spatially selective subpulses, corresponding to each gradient lobe, and spectral selectivity is imposed by the global envelope of the pulse. The total area of each encoding gradient lobe defines the span of k-space positions accessible during the encoding step. This is an important feature because signals acquired during detection must be resolved in the k-space dimension and thus separated by a minimum value dk (of the order of L-1). For m resonance frequencies to encode, the necessary k-space range is: Δ𝑘E = 𝑚 δ𝑘. Thus, the encoding gradient strength Ge and oscillation period t should be adjusted according to the relation: Δ𝑘E < 𝛾E𝐺E𝜏/2, assuming square shaped gradient
lobes. Here, contrary to the linear encoding, the major limiting factor is the encoding gradient strength available to encode a given number of resonance frequencies with a given resolution. As for linear encoding, for SPSP encoding the k-space range accessible during detection ∆𝑘- and the spectral width in the frequency dimension SWW are given by Eqs. (2) and (5), respectively. Compared to linear encoding, if the filling of the k-space can be optimized with adequate resolution for the same number of signals, the acquisition gradient requires less strength. Alternatively, the same acquisition gradient can be used to detect a larger number of resolved signals in a given k-space range. Indeed, the role of SPSP pulses is akin to a controlled folding of signals in empty regions of the detectable k-space range. During acquisition, m signals with a width of the order of L-1 can be detected given the relation: ∆𝑘
- =
8
Fig. 2. Spatial/spectral pulse design example. Three frequency offsets and the associated k-space positions define the target transverse spin magnetization profile 𝑀TUV-WXEY in the (z, W) domain. The amplitude profile (a) is set with Gaussian shape in the spectral dimension and rectangular shape in the spatial dimension and the phase profile (b) is set according to Eq. (7). The k-space trajectory (c) corresponds to the integral of the encoding gradient Ge (e) whose oscillation period t is 1 ms and strength is 0.06 T.m-1. A number of 25 zig-zag oscillating cycles are used to build the gradient shape leading to a total SPSP pulse duration of 25 ms. The radiofrequency shape (d) is calculated by non-uniform Fourier transform from the (z, W) to the (k, t) domain.
The encoding gradient oscillation period t plays a central role in SPSP encoding. The type of pulse chosen here, which consists of a train of small-tip-angle subpulses separated by delays, shares properties of DANTE [22] or binomial [23, 24] sequences. Specifically, the use of a discrete train of small-angle rotation, instead of a continuous rotation, results in the excitation of harmonic sidebands in addition to the targeted spectral region. Numerical spin simulations are helpful to characterize the excitation profile of SPSP pulses and in this case to detect and understand the occurrence of excitation sidebands. Fig.3f shows the simulated
9
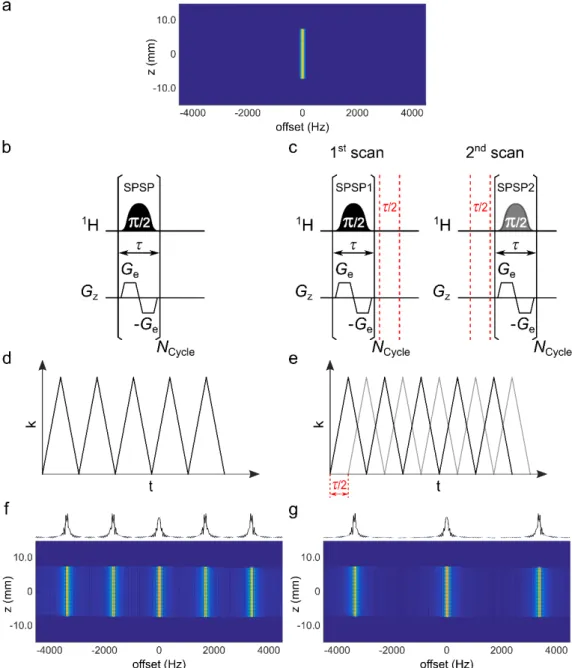
transverse spin magnetization response |MXY(z, W)| to a single SPSP excitation (Fig. 3b), associated to a given k-space trajectory (Fig. 3d), and designed from the target profile 𝑀TUV-WXEY depicted in Fig. 3a to select on-resonance frequency. In the spectral dimension of the excitation profile, harmonic excitation sidebands arise with a periodicity of 1/t. In this case, the radiofrequency pulse is applied only during the positive gradient lobes. If the radiofrequency pulse were applied during both the positive and negative gradient lobes, main harmonics would appear at period 2/t and secondary harmonics at 1/t [15], but this is difficult to achieve in a robust manner with high-resolution NMR hardware and is not considered here. Because of these excitation sidebands, care has to be taken when setting up the target profile to avoid the unintended excitation of harmonic resonance frequencies. As mentioned by Shrot and Frydman [13], the encoding gradient oscillation period can be slightly modified to make sidebands coincide with empty regions of the spectra. Nevertheless, the implementation of SPSP encoding can be difficult for crowded spectra with large spectral widths and limited empty regions.
Excitation sidebands are detrimental and the question is how to increase the “excitation bandwidth” accessible without the presence of harmonic excitation. Intuitively, a parallel can be done with the problem of the maximum detection spectral width accessible in the frequency dimension of the (k, W) domain that constitutes an UF2DNMR spectrum. It is conveniently solved by an interleaved acquisition where N successive scans are recorded to sample interleaved (k, t) trajectories. In practice, this interleaving is achieved by adding a pre-acquisition delay incremented by 2Ta/N. In the combined dataset, the effective dwell time is divided by a factor N, resulting in a multiplication of the spectral width by the same factor. By analogy, a multi-scan solution to suppress excitation sidebands would be to interleave
N segments in excitation (k, t) domain. This is the solution explored in this paper, which is
expected to work in the regime where the small-tip-angle approximation is valid, and relies on the linear relationship expressed in Eq. (8) [25, 26].
Note that the properties of excitation sidebands can also be modified by adding a phase shift of p between subpulses during the design [17, 18]. The resulting excitation profile appears shifted along the frequency axis and the central band is suppressed. This method is well adapted for selection/suppression in MRI but is not appropriate for UF2DNMR spectroscopy, where the central band is the targeted one.
10
Fig. 3. (a) Amplitude of the target (z, W) domain profile 𝑀TUV-WXEY with only one on-resonance selection in the spectral dimension. (f, g) Amplitude of the simulated response of transverse spin magnetization to SPSP encoding with gradient oscillation period t = 600 µs and radiofrequency pulse applied during only the positive gradient lobes. (left) After the application of a single SPSP excitation (b) corresponding to a given k-space trajectory (d), excitation sidebands occur every 1667 Hz (1/t) on the simulated |MXY(z, W)| profile (f). (right) With two interleaved scans (c), each SPSP pulse is designed to match two interleaved k-space trajectories with a time offset equal to t/2 (e), and the sum of the two scans leads to the elimination of half of the excitation sidebands in the simulated |MXY(z, W)| profile (g). With two interleaved SPSP excitations, the apparent excitation sideband periodicity is doubled (every 3333 Hz in this example).
2.4. Interleaved spatial/spectral encoding
Interleaved SPSP encoding may be described as the linear combination of data obtained from different segmented trajectories in excitation (k, t) domain. The combined grid has a finer time sampling and results in a larger excitation bandwidth. Interleaved SPSP encoding
11
can also be described as a form of phase cycling, in which excitation sideband signals in the spectral dimension of the (k, W) domain are suppressed through the combination of
N successive scans. When interleaved excitations are performed with a time offset Dt between
shifted trajectories in excitation (k, t) domain, the phase difference between scans Df for a resonance frequency n in the rotating frame is:
Δ𝜙 = 2𝜋 𝜈 Δ𝑡. (9)
As excitation sidebands appear with a period 1/t when the radiofrequency pulse is applied only during the positive encoding gradient lobes (with t oscillation period), the phase difference for the jth frequency harmonic is:
Δ𝜙 = 2𝜋 𝑗CrΔ𝑡. (10)
When N interleaved excitations are used, trajectories in excitation (k, t) domain are shifted by a time offset Dt set to t/N to obtain:
Δ𝜙 = 2𝜋 𝑗/𝑁. (11)
As a consequence, the principal band (j = 0) undergoes no phase difference between scans as well as all the jth band multiple of N. All other frequency harmonics undergo a phase cycling among Eq. (11). At the end, the sum of all N scans leads to the cancellation of all but one out of N sidebands in the spectral dimension of the (k, W) domain. This multi-scan approach requires an adaptation of the pulse design to take into account time shifts used for interleaving. In practice, the N scans are recorded with N different SPSP pulses with interleaving delays before and after the pulse. The pulses are designed with the same target profile but with different interleaved (k, t) trajectories time shifted by multiple of t/N. For the
nth scan, the delays di and di’ respectively placed before and after the pulse are set according to:
𝛿) = (𝑛 − 1) 𝜏/𝑁, (12)
and
𝛿)l = (𝑁 − 𝑛) 𝜏/𝑁. (13)
This principle is presented in Fig. 3c with two interleaved SPSP excitations. In this particular case, the time offset of the (k, t) trajectories between the two scans is t/2. Two different SPSP pulses are designed to match the two interleaved (k, t) trajectories in Fig. 3e. Here, the phase difference of the jth sideband between the two scans is Δ𝜙 = 𝑗𝜋. In the simulated response profile of transverse spin magnetization |MXY(z, W)| obtained after the sum of the two scans (see Fig. 3g), the signals of the principal band (j = 0) and of all jth bands multiple of 2 interfere in a constructive manner. All other jth sideband signals undergo a phase cycling with p steps and interfere in a destructive manner. The sum of the two scans leads to the cancellation of one out of two harmonics in the spectral dimension of the (k, W) domain.
12
In applying this principle with the appropriate number of interleaved scans, a selective excitation of signals over a large spectral width can be performed with an efficient removal of periodic excitation sidebands. The pulse sequence in Fig. 4a shows the implementation of the interleaved SPSP encoding. The role of this basic pulse sequence is to perform a single excitation without mixing to yield a 2D spectrum with only diagonal peaks. Since the SPSP pulse is applied directly at the beginning of the pulse sequence, the interleaving delay di before the SPSP pulse is unnecessary. To put interleaved SPSP encoding into practice, one just has to replace the classical encoding scheme used in UF2DNMR experiments by a series of custom designed SPSP pulses, with associated interleaving delays. The use of a p/2 angle for SPSP pulses is preferred to a p angle. In the latter case, the small-tip-angle regime is no longer valid, leading to a degradation of the encoding efficiency. In theory, any UF2DNMR sequence can be modified with this logic.
Fig. 4. Pulse sequences for ultrafast 2D with interleaved SPSP encoding. (a) Basic ultrafast mixingless sequence. (b) Ultrafast TOCSY sequence. (c) Ultrafast HSQC sequence. The variable interleaving delay di’ is set according to Eq. (13). The narrow and wide black rectangles stand for hard p/2 and p
13
pulses. Black shaped pulses represent the RF part of p/2 SPSP pulses. The associated SPSP encoding gradient strength Ge, oscillation period t and number of cycles NCycle are provided in captions of Figs. 5-7 as well as EPSI acquisition parameters (acquisition gradient strength Ga and duration Ta, and number of repetitions NLoop).
3. Results and discussion
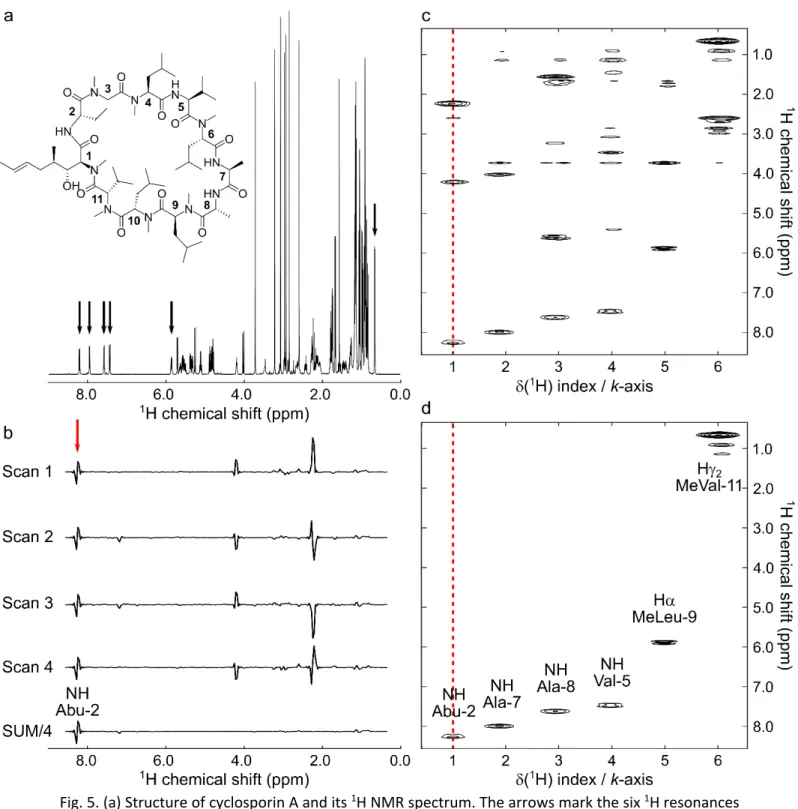
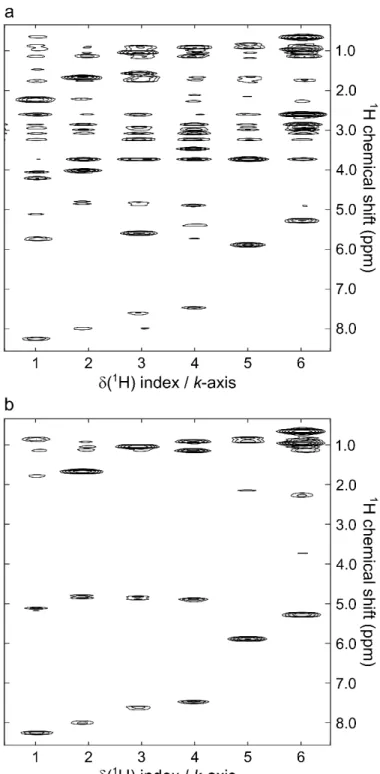
Interleaved SPSP excitation was first exemplified with cyclosporin A whose 1H spectrum, shown in Fig. 5a, has a large frequency dispersion over 8 ppm. An SPSP pulse was designed to select and encode six resonances distributed along the spectrum at six different positions on the k-axis. The pulse sequence in Fig. 4a was used to perform a single-scan mixingless correlation experiment. Fig. 5c shows the resulting cross-peak-free spectrum where the targeted signals appear at targeted k-axis indexes in the spatially encoded dimension, together with signals whose frequency coincides with excitation sidebands of the SPSP pulse. Weak signals also arise from the intense methyl singlets that are partially excited even if they lie outside of the targeted spectral regions.
For this experiment, an encoding gradient with 1 ms oscillation period was used, yielding excitation sidebands every 1000 Hz. Gradient hardware instabilities did not permit to reduce the period under a value of 1 ms. In these conditions, to cover the whole 4000 Hz spectral width, a total of four interleaved scans were necessary to eliminate unwanted excitation sidebands. The sum of all scans yielded the spectrum in Fig. 5d, totally free of sidebands, with only signals targeted by the SPSP encoding with (k-space position/offset) pairs. In the four different interleaved scans, sidebands were phase cycled as shown in Fig. 5b for the signal at
k-axis index 1 in the spatially encoded dimension. This signal close to 8 ppm corresponding to
the principal band kept a constant phase in the four scans. The first frequency harmonic coincided with an empty region of the spectrum close to 6 ppm. The second one close to 4 ppm was phase cycled with p steps and the third one close to 2 ppm was phase cycled with 3p/2 steps as expected theoretically. All k-axis index traces extracted from the 2D spectra presented in Fig. 5 are provided as supplementary information (Fig. S1). Note that artefactual signals were observed experimentally at k = 0 in the spatially encoded dimension. For this reason, targeted peaks were all assigned to positive values of k and rephasing gradient following SPSP pulse and prephasing gradient before acquisition were omitted.
14
Fig. 5. (a) Structure of cyclosporin A and its 1H NMR spectrum. The arrows mark the six 1H resonances selected to design the SPSP pulse. (b) Traces extracted at k-axis index 1 (selection of NH signal of Abu-2 residue) from the individual scans and from the sum of four interleaved scans before magnitude treatment. (c) Single-scan SPSP encoded ultrafast selective spectrum of cyclosporin A with selection of six 1H resonances, without sideband suppression. (d) SPSP encoded ultrafast selective spectrum of cyclosporin A obtained with the sum of four interleaved scans with selection of six 1H resonances. The ultrafast spectra were obtained with sequence in Fig. 4a. Ge = 16, t = 1 ms, NCycle = 35. Ga = 40,
Ta = 223.2 µs, NLoop = 128, with 2 interleaved acquisitions.
After the interleaved excitation was validated, the principle was extended to a selective UF TOCSY sequence (Fig. 4b). The goal of this pulse sequence was to transfer, by isotropic
15
mixing, the spatially encoded spin magnetizations of all the nuclei initially excited by the SPSP pulse within the entire spin systems to which they belong. The TOCSY experiment was a particularly relevant case study to test the performance of the interleaving excitation scheme because a large number of signals resulted from the use of isotropic mixing. The pulse sequence in Fig. 4b yielded the spectrum in Fig. 6a within a single scan using the previously defined SPSP encoding conditions. For each k-axis index in the spatially encoded dimension, a mix of the selective TOCSY spectrum from signal of interest and selective TOCSY spectra from all excitation sidebands was observed. The sum of the four interleaved scans yielded the spectrum in Fig. 6b, containing only the individual sub-spectra of six residues of cyclosporin A. The result was equivalent to a set of selective 1D-TOCSY experiments [35], but with the UF2DNMR SPSP encoded approach all experiments were recorded at the same time. All k-axis index traces extracted from Fig. 6b are provided as supplementary information (Fig. S2) with full assignment of 1H resonances. The best alternative selective strategy in terms of signal-to-noise ratio is Hadamard spectroscopy [36] which is based on the multiplexed recording of selective experiments [37-40].
16
Fig. 6. (a) Single-scan SPSP encoded ultrafast selective TOCSY spectrum of cyclosporin A with selection of six 1H resonances, without sideband suppression. (b) SPSP encoded ultrafast selective TOCSY spectrum of cyclosporin A obtained with the sum of four interleaved scans with selection of six 1H resonances. The spectra were obtained with the pulse sequence in Fig. 4b and the same signals of interest as in Fig. 5 were selected by SPSP encoding. MLEV-16 duration is 70 ms with 6 kHz intensity.
Ge = 16, t = 1 ms, NCycle = 35. Ga = 40, Ta = 223.2 µs, NLoop = 128, with 2 interleaved acquisitions. G1/G2 = 80/-80 (1 ms).
After the demonstration of the use of interleaved SPSP encoding for 1H-1H correlation experiments, it was exemplified in a heteronuclear UF HSQC experiment with a mixture of metabolites. In the pulse sequence in Fig. 4c, the SPSP pulse was applied on the 13C nuclei and
17
substituted the p/2 pulse responsible for the coherence transfer in the INEPT block. The interleaving delay di before the SPSP pulse was not necessary in the absence of transversal magnetization before the pulse. An SPSP pulse was designed to select the eight signals of the 13C spectrum at seven different positions in the k-axis. The two C613C resonances of a and b forms of D-glucose were not distinguished due to poor separation (20 Hz). The pulse sequence in Fig. 4c yielded the spectrum in Fig. 7a within a single scan. Each 1H resonance correlated with multiple carbon k-axis indexes. The reason is that the encoding gradient oscillation period was 1 ms, thus excitation sidebands occurred every 1000 Hz and coincided with almost every 13C resonances. The interleaved SPSP encoding of 13C resonances required a total of eight scans to cover the frequency dispersion of 8000 Hz with complete suppression of unwanted excitation harmonics. The sum of all scans yielded the spectrum in Fig. 7b, with only one 13C resonance assigned to each k-axis index according to the (k-space position/offset) pairs used to design the SPSP pulse, resulting in one HSQC correlation per k-axis index. The SPSP encoding of carbon nuclei required more gradient power because of the lower g value. In this example, 78% of the maximum gradient strength was used to encode seven offsets. It follows that this method has a limitation in the number of resonances to encode while keeping a sufficient resolution of signals in the spatially encoded dimension.
18
Fig. 7. (a) Single-scan SPSP encoded ultrafast HSQC spectrum of a metabolite mixture with selection of seven 13C resonances, without sideband suppression. (b) SPSP encoded ultrafast HSQC spectrum of the same metabolite mixture obtained with the sum of eight interleaved scans with selection of seven 13C resonances. The spectra were obtained with sequence in Fig. 4c. Ge = 78, t = 1 ms, NCycle = 25. Ga = 30,
Ta = 389.6 µs, NLoop = 128. G1/G2/G3/G4 = 70/80/70/-20 (1 ms).
4. Conclusions
Spatial/spectral encoding is a potential solution to address the spectral width and resolution limitations that are inherent to the linear encoding approach typically used in UF2DNMR experiments. Single-scan 2D spectra obtained using SPSP encoding may however
19
display artefactual signals because of the excitation sidebands of SPSP pulses. We have carried out a theoretical and numerical analysis to develop a method to efficiently eliminate unwanted sidebands. We propose a multi-scan interleaving strategy in the excitation (k, t) domain, using a set of custom designed SPSP pulses. The proposed scheme is illustrated with a UF selective TOCSY strategy to assign the 1H NMR resonances of some individual residues of the cyclosporin A peptide, and a UF HSQC spectrum of a metabolite mixture. The interleaved SPSP encoding procedure can benefit to the analysis of samples with large chemical shift dispersion, the use of UF2DNMR at high magnetic fields and the structural analysis of individual components of small molecule mixtures.
5. Experimental
All numerical simulations were performed with the Spinach package [41, 42] for MATLAB.
The magnetic field was set to 11.7 T. The sample dimension was fixed to 15 mm in the spatial dimension using a linear grid of 500 points. A spectral region of 15652 Hz was considered in the spectral dimension, using a linear grid of 500 points (in practice, this was implemented using a second spatial dimension, with a length of 4 mm and a constant gradient of 0.091 T.m -1). The SPSP encoding pulse was designed with the following parameters: Ge = 0.195 T.m-1, t = 600 µs and NCycle = 25. Each radiofrequency subpulse was defined with 100 points and applied during only the positive gradient lobes.
The cyclosporin A sample was prepared by dissolution in C6D6 at a 25 mM concentration. The metabolite mixture was prepared with [2-13C] Glycine, [2-13C] L-alanine, [1-13C] D-glucose, [2-13C] D-glucose and [6-13C] D-glucose dissolved in D2O at a 200 mM concentration.
All spectra were recorded at 303 K on a 500 MHz Avance III Bruker spectrometer equipped with a cryogenic 1H/13C probe with a z-axis gradient coil. UF pulse sequence details are given in captions of Figs. 4-7. All gradient values are expressed as percents of the hardware maximum intensity (65 G.cm-1). SPSP pulses were designed with a MATLAB script performing a non-uniform Fourier transform from a target pattern with an algorithm based on conjugate gradients which converged within 3 iterations [13]. Radiofrequency and gradient pulses were exported in the Bruker file format.
The processing of UF spectra was performed with a MATLAB script. A spatial Gaussian
apodization was applied in the spatially encoded dimension [43]. A sinusoidal apodization was applied in the frequency dimension. Zero-filling was applied in both dimensions.
Acknowledgments
This work was supported by the French National Research Agency (grant ANR-17-ERC2-0011), the French CNRS, the Université de Nantes, the European Research Council (ERC) under the European Union’s Horizon 2020 research and innovation program (grant agreement No 801774), and the Région Pays de la Loire (Connect Talent).
20
[1] R.R. Ernst, G. Bodenhausen, A. Wokaun, Principles of Nuclear Magnetic Resonance in One and Two Dimensions, Clarendon Press, Oxford, 1987.
[2] L. Rouger, B. Gouilleux, P. Giraudeau, Fast n-Dimensional Data Acquisition Methods, in: J.C. Lindon, G.E. Tranter, D.W. Koppenaal (Eds.) Encyclopedia of Spectroscopy and Spectrometry (Third Edition), Academic Press, Oxford, 2017, pp. 588-596.
[3] B. Gouilleux, L. Rouger, P. Giraudeau, Chapter Two - Ultrafast 2D NMR: Methods and Applications, in: G.A. Webb (Ed.) Annual Reports on NMR Spectroscopy, Academic Press, 2018, pp. 75-144.
[4] L. Frydman, T. Scherf, A. Lupulescu, The acquisition of multidimensional NMR spectra within a single scan, Proceedings of the National Academy of Sciences, 99 (2002) 15858-15862.
[5] L. Frydman, A. Lupulescu, T. Scherf, Principles and Features of Single-Scan Two-Dimensional NMR Spectroscopy, Journal of the American Chemical Society, 125 (2003) 9204-9217.
[6] P. Pelupessy, Adiabatic Single Scan Two-Dimensional NMR Spectrocopy, Journal of the American Chemical Society, 125 (2003) 12345-12350.
[7] P. Mansfield, Multi-planar image formation using NMR spin echoes, Journal of Physics C: Solid State Physics, 10 (1977) L55-L58.
[8] L. Frydman, D. Blazina, Ultrafast two-dimensional nuclear magnetic resonance spectroscopy of hyperpolarized solutions, Nature Physics, 3 (2007) 415-419.
[9] M. Mishkovsky, L. Frydman, Progress in Hyperpolarized Ultrafast 2D NMR Spectroscopy, ChemPhysChem, 9 (2008) 2340-2348.
[10] L.S. Lloyd, R.W. Adams, M. Bernstein, S. Coombes, S.B. Duckett, G.G.R. Green, R.J. Lewis, R.E. Mewis, C.J. Sleigh, Utilization of SABRE-Derived Hyperpolarization To Detect Low-Concentration Analytes via 1D and 2D NMR Methods, Journal of the American Chemical Society, 134 (2012) 12904-12907.
[11] V. Daniele, F.-X. Legrand, P. Berthault, J.-N. Dumez, G. Huber, Single-Scan Multidimensional NMR Analysis of Mixtures at Sub-Millimolar Concentrations by using SABRE Hyperpolarization,
ChemPhysChem, 16 (2015) 3413-3417.
[12] P. Pelupessy, L. Duma, G. Bodenhausen, Improving resolution in single-scan 2D spectroscopy, Journal of Magnetic Resonance, 194 (2008) 169-174.
[13] Y. Shrot, L. Frydman, Spatial/spectral encoding of the spin interactions in ultrafast multidimensional NMR, The Journal of Chemical Physics, 131 (2009) 224516.
[14] C.H. Meyer, J.M. Pauly, A. Macovski, D.G. Nishimura, Simultaneous spatial and spectral selective excitation, Magnetic Resonance in Medicine, 15 (1990) 287-304.
[15] M.A. Bernstein, K.F. King, X.J. Zhou, CHAPTER 5 - SPATIAL RADIOFREQUENCY PULSES, in: Handbook of MRI Pulse Sequences, Academic Press, Burlington, 2004, pp. 125-176.
[16] W. Block, J. Pauly, A. Kerr, D. Nishimura, Consistent fat suppression with compensated spectral-spatial pulses, Magnetic Resonance in Medicine, 38 (1997) 198-206.
[17] F. Schick, Simultaneous highly selective MR water and fat imaging using a simple new type of spectral-spatial excitation, Magnetic Resonance in Medicine, 40 (1998) 194-202.
[18] Y. Zur, Design of improved spectral-spatial pulses for routine clinical use, Magnetic Resonance in Medicine, 43 (2000) 410-420.
[19] P.E.Z. Larson, A.B. Kerr, A.P. Chen, M.S. Lustig, M.L. Zierhut, S. Hu, C.H. Cunningham, J.M. Pauly, J. Kurhanewicz, D.B. Vigneron, Multiband excitation pulses for hyperpolarized 13C dynamic chemical-shift imaging, Journal of Magnetic Resonance, 194 (2008) 121-127.
[20] P.E.Z. Larson, R. Bok, A.B. Kerr, M. Lustig, S. Hu, A.P. Chen, S.J. Nelson, J.M. Pauly, J.
Kurhanewicz, D.B. Vigneron, Investigation of tumor hyperpolarized [1-13C]-pyruvate dynamics using time-resolved multiband RF excitation echo-planar MRSI, Magnetic Resonance in Medicine, 63 (2010) 582-591.
[21] A.Z. Lau, A.P. Chen, R.E. Hurd, C.H. Cunningham, Spectral–spatial excitation for rapid imaging of DNP compounds, NMR in Biomedicine, 24 (2011) 988-996.
[22] G.A. Morris, R. Freeman, Selective excitation in Fourier transform nuclear magnetic resonance, Journal of Magnetic Resonance (1969), 29 (1978) 433-462.
21
[23] P.J. Hore, A new method for water suppression in the proton NMR spectra of aqueous solutions, Journal of Magnetic Resonance (1969), 54 (1983) 539-542.
[24] D.L. Turner, Binomial solvent suppression, Journal of Magnetic Resonance (1969), 54 (1983) 146-148.
[25] C.J. Hardy, P.A. Bottomley, 31P Spectroscopic localization using pinwheel NMR excitation pulses, Magnetic Resonance in Medicine, 17 (1991) 315-327.
[26] L.P. Panych, K. Oshio, Selection of high-definition 2D virtual profiles with multiple RF pulse excitations along interleaved echo-planar k-space trajectories, Magnetic Resonance in Medicine, 41 (1999) 224-229.
[27] A. Tal, L. Frydman, Single-scan multidimensional magnetic resonance, Progress in Nuclear Magnetic Resonance Spectroscopy, 57 (2010) 241-292.
[28] P. Giraudeau, S. Akoka, Sources of sensitivity losses in ultrafast 2D NMR, Journal of Magnetic Resonance, 192 (2008) 151-158.
[29] P. Giraudeau, S. Akoka, Resolution and sensitivity aspects of ultrafast J-resolved 2D NMR spectra, Journal of Magnetic Resonance, 190 (2008) 339-345.
[30] B. Gouilleux, L. Rouger, P. Giraudeau, Ultrafast Multi-dimensional NMR: Principles and Recent Applications, in: eMagRes, John Wiley & Sons, Ltd, 2016.
[31] S. Rieseberg, J. Frahm, J. Finsterbusch, Two-dimensional spatially-selective RF excitation pulses in echo-planar imaging, Magnetic Resonance in Medicine, 47 (2002) 1186-1193.
[32] W.A. Grissom, A.B. Kerr, A.B. Holbrook, J.M. Pauly, K. Butts-Pauly, Maximum linear-phase spectral-spatial radiofrequency pulses for fat-suppressed proton resonance frequency–shift MR Thermometry, Magnetic Resonance in Medicine, 62 (2009) 1242-1250.
[33] R.F. Schulte, F. Wiesinger, Direct design of 2D RF pulses using matrix inversion, Journal of Magnetic Resonance, 235 (2013) 115-120.
[34] J. Pauly, D. Nishimura, A. Macovski, A k-space analysis of small-tip-angle excitation, Journal of Magnetic Resonance, 81 (1989) 43-56.
[35] H. Kessler, S. Mronga, G. Gemmecker, Multi-dimensional NMR experiments using selective pulses, Magnetic Resonance in Chemistry, 29 (1991) 527-557.
[36] E. Kupče, T. Nishida, R. Freeman, Hadamard NMR spectroscopy, Progress in Nuclear Magnetic Resonance Spectroscopy, 42 (2003) 95-122.
[37] H. Bircher, C. Müller, P. Bigler, Improved sensitivity for the 2D analogue of the 3D HOHAHA-COSY experiment, Magnetic Resonance in Chemistry, 29 (1991) 726-729.
[38] V. Blechta, R. Freeman, Multi-site Hadamard NMR spectroscopy, Chemical Physics Letters, 215 (1993) 341-346.
[39] J. Schraml, H. van Halbeek, A. De Bruyn, R. Contreras, M. Maras, P. Herdewijn, Hadamard 1D 1H TOCSY and its application to oligosaccharides, Magnetic Resonance in Chemistry, 35 (1997) 883-888. [40] B. Plainchont, A. Martinez, S. Tisse, J.P. Bouillon, J.M. Wieruszeski, G. Lippens, D. Jeannerat, J.M. Nuzillard, An alternative scheme for the multiplexed acquisition of 1D and 2D NMR spectra, Journal of Magnetic Resonance, 206 (2010) 68-73.
[41] H.J. Hogben, M. Krzystyniak, G.T.P. Charnock, P.J. Hore, I. Kuprov, Spinach – A software library for simulation of spin dynamics in large spin systems, Journal of Magnetic Resonance, 208 (2011) 179-194.
[42] I. Kuprov, Large-scale NMR simulations in liquid state: A tutorial, Magnetic Resonance in Chemistry, 56 (2018) 415-437.
[43] P. Giraudeau, S. Akoka, Sensitivity and lineshape improvement in ultrafast 2D NMR by optimized apodization in the spatially encoded dimension, Magnetic Resonance in Chemistry, 49 (2011) 307-313.