HAL Id: hal-01184883
https://hal.archives-ouvertes.fr/hal-01184883
Submitted on 3 Jun 2020
HAL is a multi-disciplinary open access
archive for the deposit and dissemination of
sci-entific research documents, whether they are
pub-lished or not. The documents may come from
teaching and research institutions in France or
abroad, or from public or private research centers.
L’archive ouverte pluridisciplinaire HAL, est
destinée au dépôt et à la diffusion de documents
scientifiques de niveau recherche, publiés ou non,
émanant des établissements d’enseignement et de
recherche français ou étrangers, des laboratoires
publics ou privés.
microclimate within an idealized homogeneous urban
canopy
R. Tavares, I. Calmet, Samuel Dupont
To cite this version:
R. Tavares, I. Calmet, Samuel Dupont. Modelling the impact of green infrastructures on local
mi-croclimate within an idealized homogeneous urban canopy. 9th International Conference on Urban
Climate (ICUC9), Jul 2015, Toulouse, France. 6 p. �hal-01184883�
Modelling the impact of green infrastructures on local
microclimate within an idealized homogeneous urban
canopy
Richard Tavares1,3, Isabelle Calmet2,3, Sylvain Dupont4,5
1 LUNAM, CNRS, LHEEA UMR CNRS 6598, Nantes, France, tavaresram@gmail.com
2 LUNAM, Ecole Centrale de Nantes, LHEEA UMR CNRS 6598, Nantes, France, isabelle.calmet@ec-nantes.fr 3 IRSTV, FR CNRS2488, Nantes, France
4INRA, UMR 1391, ISPA, F-33140 Villenave d’Ornon, France, sylvain.dupont@bordeaux.inra.fr
5 Bordeaux Sciences Agro, UMR 1391, ISPA, F-33170 Gradignan, France
Abstract
Aiming to overcome some of well-known limitations of existing models when applied to analyse the impact of green infrastructures in urban areas, we propose the ARPS-VUC model, a new urbanized version of the APRS model, applicable from neighbourhood to city scales. It results from the integration of the Vegetated Urban Canopy (VUC) model in the ARPS meteorological code. The novelty is the integration of an intermediate multi-layer canopy modelling approach, where meteorological fields are solved within and above the canopy, and the canopy elements (building and high vegetation) are represented through a drag force approach. The ARPS-VUC model is also able to account for buildings’ green roofs and/or walls.
This work presents the first use of ARPS-VUC model to evaluate the impact of vegetation on the local microclimate of an idealized homogeneous urban canopy. To that purpose, we defined different canopy configurations, with different types of vegetation devices (small and high vegetation, green facades and roofs). Complete diurnal cycles were simulated for meteorological conditions corresponding to a sunny summer day and results obtained for each configuration were compared. Generally, the results show that vegetation cooling effects change in amplitude and during the day according to the type of vegetation device. When analysed individually, trees induce a larger air cooling, especially in the bottom part of the canopy, than small vegetation (ground level and/or building wall/roof surfaces), due to the tree shading effect along the daytime period. On the other hand, green buildings impact is also visible after midday and at night. The main cooling impact is observed when high vegetation is associated with vegetation on buildings. These first results are in agreement with recent studies and show that greening urban areas can be, in fact, an efficient way to regulate air temperature, particularly at the pedestrian level for both day and night. They further demonstrate the potentiality of our model to evaluate the impact of vegetation on local microclimate.
Keywords: Microclimate modelling, urban areas, vegetated canopy
1. Introduction
It is nowadays well established that green infrastructures are key instruments of urban sustainable development and planning strategies to reduce and control local urban heat islands (UHIs) and improve comfort in urban areas (Wong, 2002; Argiro and Marialena, 2003; Bowler et al., 2010; Grimmond et al., 2010, Mackey et al., 2012). However, there is still a lack of the overall understanding of its implications for urban meteorology at a neighbourhood scale, i.e. between the local and city scales.
Quantifying the impact of greening urban areas on urban microclimate, and thus on human comfort and energy consumption, is difficult due to the complex interaction between the energy fluxes coming from the various urban surfaces and the meteorological fields. Models give the opportunity to investigate this impact up to regional scales (Gill et al., 2008). On a one hand, most of the models used from regional scale to city scale, using single- or multi-layer canopy models, only assume vertical transfers between the canopy and the atmosphere. On the other hand, complex 3D building descriptions are used at a local scale, making these tools computationally too expensive for studying the interactions between urban neighbourhoods. To overcome these limitations, the ARPS-VUC model has been developed in the framework of the VegDUD project (Musy et al., 2012). This new model results from the development and integration of the Vegetated Urban Canopy (VUC) model in the Large-Eddy Simulation (LES) Advanced Regional Prediction System ARPS (Xue et al., 2000, 2001). The VUC model is based on a multi-layer canopy modelling approach, where meteorological fields are solved by LES within and above the canopy and where the canopy elements (building, vegetation) are represented through an averaged morphological description. The new model is also able to account for green devices on building roofs and wall surfaces, in addition to trees in the canopy. After briefly describing the ARPS-VUC model, a first application is presented for an idealized homogeneous urban canopy in order to evaluate the impact of vegetation on the local microclimate.
Different canopy configurations were defined to check the model efficiency and to compare the influence of various ways and strategies to re-introduce different vegetation devices in cities.
2. Methodology
2.1 ARPS-VUC Model
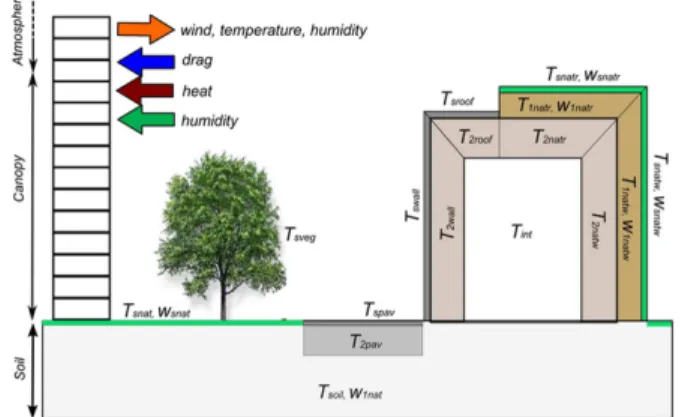
The so-called ARPS-VUC model results from the development and integration of the Vegetated Urban Canopy (VUC) model (Dupont et al., 2013) into the LES atmospheric boundary layer model ARPS. The urbanised version of ARPS includes a multi-layer canopy model, which allows to solve all meteorological fields (wind velocity, air temperature and humidity) within (and above) the canopy with a complete interaction (two-way coupling) between these meteorological fields and the momentum, heat and humidity fluxes from the canopy elements which are internally computed by the VUC model. A drag force term is added into the momentum equations to represent the influence of a group of obstacles on the flow dynamics (Maché, 2012). To consider the influence of the canopy elements on heat and moisture, the source or sink contributions of natural and artificial surfaces on building envelop and of high vegetation were introduced into the air temperature and air humidity conservation equations (Figure 1).
Fig. 1 Schematic representation of the urban vegetated canopy as considered in VUC model, with indication of temperature (T) and humidity (W) variables associated to canopy elements. (from Dupont et al, 2013).
The ground surface is partitioned between natural surface (bare soil and small vegetation), pavement (roads, side walk) and buildings, with ground area densities fnat, fpav and fbat respectively and fnat + fbat + fpav = 1. High
vegetation (trees, shrubs) inside the urban canopy is characterized through the vertical distributions of the frontal (Afveg) and horizontal (Ahveg) area densities. Buildings are characterized by their height and by the vertical
distributions of the frontal (walls) (Afbat) and horizontal (roofs) (Ahbat) area densities. Heat fluxes from buildings are
further partitioned between walls and roofs, which can be partially covered with natural surfaces and small vegetation.
Ground natural surfaces are represented by a thin surface layer acting as a buffer for the evaporation from the surface and a root-zone layer containing the available water for vegetation transpiration. This approach is similar as in the ISBA model (Noilhan and Planton, 1989) except that the root-zone layer extends here under the other surface types. Each artificial cover (pavement, wall and roof) is represented by two layers as in the SM2-U model (Dupont and Mestayer, 2006). A superficial layer allows the model to respond quickly to the environmental forcing variations, and a second, inner layer, allows the artificial materials to store heat. When natural surfaces are present on buildings, two soil layers are added above the building inner layer (Figure 1). These two additional layers have a similar role as the two soil layers of the ground natural surface.
The surface temperature of natural ground and natural soil on buildings is calculated by means of a force-restore type equation for the surface layer heat, which assumes that the layer is sufficiently thin to be at a uniform temperature. The deep soil temperature is determined by a return-to-equilibrium equation towards an average temperature of all surfaces in contact with the soil. Artificial cover temperatures are determined through the energy budget by taking into account the conduction flux between the surface and the soil layer, for the pavement, or the building’s air interior, through the different considered layers. Specific parameterisations of the inverse heat capacity coefficients for each canopy element are detailed in Dupont et al.(2013). The evolution of high vegetation surface temperature is deduced from the surface heat budget. Currently the conduction heat flux within the plant is neglected.
Water vapour fluxes from natural surfaces (on the ground or on buildings) resulting from the water budget in the various soil layers, take into account the evaporation from the bare soil between vegetation and the vegetation transpiration. The stomatal resistance of high vegetation is modelled following Noilhan and Planton (1989), and depends on the total leaf area index (LAI) of the vegetation, on atmospheric factors (e.g., solar radiation) and on available water in the soil.
vegetation and buildings). It is assumed that the net radiation flux exponentially decays towards the ground as a function of z (height from the ground), of the canopy density of both vegetation and buildings, and of the time of day (Tavares et al., 2014). The incoming solar radiation for building wall and roof surfaces are considered differently depending on the direct solar exposure.
Precipitation conditions, the water storage of canopy elements, anthropogenic heat fluxes and humidity fluxes from the pavement and non-vegetated roofs and walls are not considered in the actual version of the model.
2.2 Definition of study case scenarios
To demonstrate ARPS-VUC feasibility to evaluate the impact of vegetation on the local microclimate, the model was used for an idealized homogeneous urban canopy, where buildings are characterized by cubical elements (to represent the urban canopy). To that purpose, the set of canopy configurations with different vegetation devices (small and high vegetation, green facades and roofs) (U1-U8), listed in Table 1 was defined.
Table 1: Parameters of simplified homogeneous canopy configurations
Scenario Ground surface occupation fraction [%] Vegetation
f
natf
artf
batf
veg Treef
veg_rooff
veg_wallU1 10 65 25 - - - - U2 10 65 25 75 - - - U3 10 65 25 - - - U4 10 65 25 75 - - U5 10 65 25 75 - 50* - U6 10 65 25 75 - - 50* U7 10 65 25 75 - 50* 50* U8 10 65 25 75 50* 50*
* It is assumed that 50 % of buildings surface has a natural soil layer with 100% small vegetation cover.
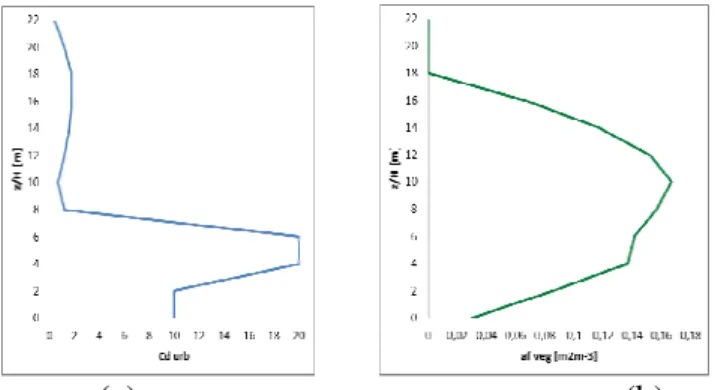
In all scenarios the buildings canopy height is H = 20 m with a built density (or building fraction) fbat = 25 %. The
corresponding frontal density Afbat at each computational level inside the canopy is 0.167 m
2
.m-3, whereas the drag coefficient Cdbat is described by the profile shown in Figure 2a (Maché, 2012).The fraction of artificial surface
composed of asphalt (as pavement) is fart = 65 % and the natural surface fraction is fnat = 10 %.
Different configurations of green devices are considered in scenarios U2 to U8. The presence of small vegetation (fveg= 75 %) homogeneously covering the fnat permeable bare soil is assumed in scenarios U2, U4, U5,
U6, U7 and U8. High vegetation inside the canopy volume (trees of 18 m high) is considered in U3, U4 and U8. The vertical distribution of vegetation is defined and represented through the Afveg profile presented in Figure 2b,
based on the work of Dupont and Brunet (2008).The maximum foliage density of trees is defined at 10 m above the ground, corresponding to a projected ground surface occupation of ~14 % and a leaf area index LAI = 2.
(a) (b)
Fig. 2 Vertical profile of (a) Cdbat for buildings and (b) Afveg for the high vegetation in U3, U4 and U8.
The vegetation on buildings surfaces is also considered in scenarios U5 to U8. Small vegetation covering 50% of the building roofs (fveg_roof = 50 %) is assumed in U5, U7 and U8, whereas green facades/walls (fveg_wall = 50 %)
are assumed in U6, U7 and U8.
Physical characteristics of ground, natural surfaces and vegetation are defined using database included in ARPS model. Parameters of each surface type were defined as from Dupont et al. (2013). The computational domain size (for all scenarios) is 960 m x 960 m x 2000 m, with 51x51x59 grids. Horizontal grid size is 20 m, whereas the vertical grid size is 2 m within the canopy layer up to 23 m. Vertical mesh stretching is imposed above 23 m high, with a mean ∆z value of 20.8 m. A Rayleigh damping layer extends from 1500 m above the ground surface to the top of the domain. Time step is fixed at 0.1 s. A complete diurnal cycle (of 24 h) was simulated with meteorological conditions corresponding to a sunny summer day (1st June 2012).
Lateral boundary conditions applied to the flow are defined as periodic, while top and bottom boundary conditions are defined as zero gradient and rigid walls, respectively. Turbulent Kinetic Energy (TKE) equation is solved in order to model the sub-grid scale fluxes, taking into account the grid anisotropy. Fourth order horizontal
and second order vertical advection schemes were used for momentum and scalar (humidity and temperature) equations. Surface fluxes are calculated from the stability-dependent surface drag coefficients, and the predicted temperature and moisture of surfaces and air. Meteorological variables are initialized to simulate an idealized cloudiness daytime with near-neutral atmospheric stability conditions.
3. Results
To evaluate the impact of the different types of urban vegetation on microclimate, different key variables such as air temperature and energy fluxes are compared for the various scenarios. The different quantities result from a horizontal averaging of the instantaneous fields provided by the LES code, at each level inside the homogeneous canopy. Figure 3 illustrates the general influence of vegetation devices as accounted for in our model, focussing on the air temperature (Tair) at the pedestrian level and at the top of the urban canopy. The
results are presented in average for three periods of six hours, the first one beginning about one hour after sunrise.
Fig 3 Air temperature averaged over six hours periods of the diurnal cycle (a) inside the canopy at 2 m above the ground and (b) at the roofs level (20 m).
At the lowest level of the canopy (Figure 3a) the higher Tair values are found, during the whole diurnal cycle, for
urban canopies without vegetation (U1) or with only a small fraction of grass on the ground surface (U2). Between 6h and 12h, the vegetation on buildings seems to have only little influence on Tair at this level as seen for U5, U6
and U7. The influence of this type of vegetation device is much more visible for the two other periods (12h-18h and 18h-24h) and particularly in U7 where both walls and roofs are partly covered by vegetation. On the contrary,
Tair is always lowered when trees are present inside the urban canopy (U3, U4, U8). The main impact is found
when trees are associated with green buildings (U8). In this case, Tair is reduced by 2.6, 3.4 and 3 °C during the
morning (06h-12h), afternoon (12h-18h) and evening (18h-24h) periods, respectively, in comparison with U1 (without any green device).
At the roof level (Figure 3b) weaker differences on Tair are observed between the various scenarios. The
maximum difference between the scenarios is only 0.5, 1.8 and 0.8°C during the morning, afternoon and evening periods, respectively. However, two groups of scenarios can be distinguished during the afternoon. The air is slightly warmer when buildings envelop is exclusively made of artificial materials (U1-U4) than when the walls and/or roofs are covered with vegetation (U5-U8). This can be explained by the fact that trees have no more direct influence on the solar radiation received by the surfaces, but only on the air temperature at the low levels, which might be mixed with the air above.
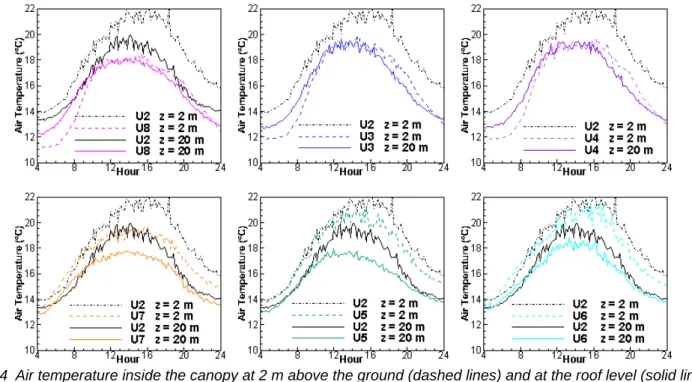
The diurnal evolution of Tair at those levels is presented on Figure 4 for the set of green scenarios (U3 to U8).
The results from U2 are also presented as reference. In the absence of trees (U5, U6, U7 and U2), Tair is higher in
the bottom part of the canopy than at the top all along the diurnal cycle (as also observed for U1). This is due to the ground surfaces that directly contribute to air warming only at the lowest level of the canopy. On the contrary, when trees are present (U3, U4, U8), Tair is nearly the same at both levels in the middle of the day, but remain
higher for a longer period of time at the bottom of the canopy than at the top. The reversed trend is observed during the night and morning periods, when the air is coolest near the ground. The combination of trees and green buildings (U8) induces the maximum air cooling at the pedestrian level for both night and day. Covering walls and roofs with vegetation (U7) is also an efficient way to regulate air temperature. As expected, green roofs (U5) are more efficient than green walls (U6) to lower Tair at the canopy top, but the difference at midday is less
than 1°C. Comparison of these two scenarios for the bottom of the canopy lead to the surprising conclusion that vegetated walls could be less efficient than vegetated roofs in regulating Tair at the low levels of the canopy. In the
early morning, the modification of wall properties induces faster air warming by vegetated walls, which store less energy than artificial ones. From 9h the air heating rate is slightly weaker in presence of green walls, but last nearly the same time than with only artificial walls. On the contrary, the heating rate is nearly the same in U5 as in U2 until 11h, but then it slows down in U5, probably due to the mixing of warm air at the bottom with the cooler air from the top provided by green roofs. This results in slightly warmer air, in average between 12h and 24h, in U6 than in U5, as also shown on Figure 3a.
The results on air temperature may be explained by examining the energy fluxes from the surfaces at various levels, as shown on Figure 5 where some of the scenarios have been selected for that purpose.
Fig. 4 Air temperature inside the canopy at 2 m above the ground (dashed lines) and at the roof level (solid lines) for the green scenarios.
The comparison of energy fluxes at the roof level, accounting for the proportion of contributing surfaces, is presented in Figure 5a for scenarios U2 (artificial walls and roofs) and U7 (50% of green walls and roofs). Although the net radiation flux (Rn) is quite the same in both simulations, the presence of vegetation on buildings induces evapotranspiration (LE) which reduces sensible heat flux (Hs) and heat storage flux (Gs). At this canopy level, the same fluxes partition is found in U7 and in U8 where trees were considered (not shown). The influence of vegetation inside the canopy (in the volume or onto the walls) on Hs is illustrated on Figure 5b at a height where trees may attenuate the incoming solar radiation received by the walls. The shading induced by trees actually reduces Hs for both walls. As previously stated by Maché et al. (2012), the sensible heat flux from vertical facades presents two maxima, in the morning and in the afternoon, and a local minimum around 13h, due to the solar angle. For artificial walls (U2 and U4) the diurnal profile of Hs is not symmetrical with respect to the minimum, due to the heat storage which prevails just after the sun rise. The time delay usually observed between Gs and Hs processes for horizontal surfaces (Figure 5a) combines here with a renewal of walls heating in the late afternoon. For green walls (U7 and U8), Hs diurnal profiles are much more symmetrical due to the vegetation properties that reduce Gs in the morning and the heat release at midday. The sensible heat flux is generally higher for artificial walls (U2 and U4) than for vegetated walls (U7 and U8), because of the latent heat flux LE (Figure 5c) that regulates the surface warming, except in the early morning (without trees). This is in accordance with Tair profile previously observed for U6 (Figure 4). As seen on Figures 5b and 5c, the hour when the maxima
of LE and Hs occur roughly coincides, showing that our vegetated walls react quite instantaneously to solar radiation for both evaporation and air warming.
Fig. 5 Comparison of simulated energy fluxes: a) Rn (red), Hs (black), LE (green) and Gs (blue) for scenarios U2 (dashed line) and U7 (solid line) at the roof level; b) Hs from artificial (dashed lines) and vegetated (solid lines)
walls at middle height of the canopy; c) LE from green walls (same level as in b)
4. Conclusions
The ARPS-VUC model was developed to support the analysis of the implications on urban meteorology at neighbourhood scale from using vegetation as an instrument of planning strategies to reduce and control local UHI and improve human comfort within urban areas. This new urbanized version of ARPS model uses a
drag-force approach, enabling to solve all meteorological fields (wind velocity, air temperature and humidity) within and above the canopy with a complete interaction (two-way coupling) between these meteorological fields and the momentum, heat and humidity fluxes from the canopy elements as internally computed by the VUC model. The presence of high vegetation (trees) between buildings and vegetation on building roof and wall surfaces is taken into account, in addition to natural, pavement, and buildings ground coverage. Furthermore, this model is designed for characterizing both homogeneous and heterogeneous spatial (horizontal and vertical) distribution of vegetation and buildings as for real urban canopies.
The first application to homogeneous urban canopies demonstrates the model’s feasibility to simulate the impact of green infrastructures on urban microclimate and thus, on pedestrians comfort. Complete diurnal cycles were simulated with meteorological conditions corresponding to a sunny summer day and the results were compared for each configuration. Generally, the results show that vegetation cooling effects change in amplitude and during the day according to the type of vegetation. The cooling phenomenon is more accentuated when trees are associated with small vegetation on buildings surfaces. In our scenarios, the impact of trees at the low levels of the canopy is notable along the diurnal cycle, due to the shading effect during the daytime, whereas the evapotranspiration phenomenon from small vegetation on the ground has a minor impact on air temperature. The first results are in agreement with recent studies and show that greening urban areas is in fact an efficient way to regulate air temperature, particularly at the pedestrian level for both night and day. In order to confirm our first conclusions, other scenarios should be considered by varying built density and building height, vegetation fractions on roofs, walls and ground, and soil water content. However, the results presented here demonstrate the potentiality of our model to evaluate the impact of vegetation on local microclimate at the neighbourhood scale.
Acknowledgment
This work was supported by the HPC resources of IDRIS (Institut de Développement et de Recherche pour l’Informatique Scientifique) under the allocation i2014010132 made by GENCI. The authors also thank ANR and ADEME the Post-Doc fellowship of R. Tavares in the frame of the of the VegDUD and EVA projects.
References
Argiro D., Marialena N., 2003: Vegetation in the urban environment: microclimatic analysis and benefits. Energy and
Buildings 35, 69–76.
Bowler D.E., Buyung-Ali L., Knight T.M., Pullin, A.S., 2010: Urban greening to cool towns and cities: a systematic review of the empirical evidence. Landscape and Urban Planning 97, 147–155.
Dupont S., Mestayer P., 2006: Parameterization of the urban energy budget with the submesoscale soil model. Journal of
Applied Meteorology and Climatology 45, 1744–1765.
Dupont S., Brunet Y., 2008: Influence of foliar density profile on canopy flow: a large-eddy simulation study. Agricultural and
Forest Meteorology 148, 976–990.
Dupont S., Calmet I., Tavares R., Maché M., 2013: Vegetated Urban Canopy Model. VegDUD MODE Deliverable, April 2013. Gill S., Handley J., Ennos A.R., Pauleit S., Theuray N., Lindley S., 2008: Characterising the urban environment of UK cities and towns: a template for landscape planning. Landscape and Urban Planning 87 (3), 210–222.
Grimmond S., Roth M., Oke T.R., Au Y.C. Best M., Betts R., Carmichael G., Cleugh H., Dabberdt W., Emmanuel R., Freitas E., Fortuniak K., Hanna S., Klein P., Kalkstein L.S., Liu C.H., Nickson A., Pearlmutter D., Sailor D., Voogt J., 2010 : Climate and more sustainable cities: climate information for improved planning and management of cities (producers/capabilities perspective). Procedia Environmental Sciences 1, 247–274.
Maché M., 2012 : Représentation multi-échelle des transferts entre couche de canopée urbaine et atmosphère à l’échelle de la ville. PhD thesis, Thèse de doctorat de l’École Centrale de Nantes, Nantes, France.
Maché M., I. Calmet, J.-F. Sini, J.-M. Rosant, 2012: Large-eddy simulations of urban microclimate using multi-layer canopy model, 8th International Conference on Urban Climates (ICUC8), Dublin, Ireland, 6-10 August 2012, paper 151, 4p.
Mackey C.W., Lee X.H., Smith R.B., 2012: Remotely sensing the cooling effects of city scale efforts to reduce urban heat island. Building and Environment 49, 348–358.
Musy M., Gutleben C., Inard C., Long N., Mestayer P., Rodriguez F., Rosant J.-M., 2012: VegDUD project: role of vegetation in sustainable urban development, 8th International Conference on Urban Climate (ICUC8), Dublin, Ireland, 4p.. Noilhan J., Planton S. 1989: A simple parameterization of land surface processes for meteorological models. Monthly
Weather Review 117, 536–549.
Wong N H., 2002: Urban heat island effect: sinking the heat. Innovation 3, 16–18.
Tavares R., Calmet I., Dupont S., 2014: ARPS-VUC Model: development and first application to homogeneous canopies. Post-Doc Report, LHEEA, ECN, Nantes, France.
Xue M., Droegemeier K.K., Wong V., 2000: The advanced regional prediction system (ARPS) – a multi-scale nonhydrostatic atmospheric simulation and prediction model. Part I: model dynamics and verification. Meteorology and Atmospheric Physics 75, 161–193.
Xue M., Droegemeier K.K., Wong V., Shapiro A., Brewster K., Carr F., Weber D., Liu Y., Wang D., 2001: The advanced regional prediction system (ARPS) – a multi-scale nonhydrostatic atmospheric simulation and prediction tool. Part II: model physics and applications. Meteorology and Atmospheric Physics 76, 143–165.