Titre:
Title:
Who's right, Marshall or Jacobs? The localization versus urbanization debate
Auteurs:
Authors: Catherine Beaudry et Andrea Schiffauerova
Date: 2009 Référence:
Citation:
Beaudry, Catherine et Schiffauerova, Andrea (2009). Who's right, Marshall or Jacobs? The localization versus urbanization debate. Research Policy, 38(2), p. 318-337. doi:10.1016/j.respol.2008.11.010
Document en libre accès dans PolyPublie
Open Access document in PolyPublie
URL de PolyPublie:
PolyPublie URL: http://publications.polymtl.ca/2298/
Version: Version finale avant publication / Accepted versionRévisé par les pairs / Refereed Conditions d’utilisation:
Terms of Use: CC BY-NC-ND
Document publié chez l’éditeur commercial Document issued by the commercial publisher
Titre de la revue:
Journal Title: Research Policy Maison d’édition:
Publisher: Elsevier URL officiel:
Official URL: http://dx.doi.org/10.1016/j.respol.2008.11.010 Mention légale:
Legal notice: In all cases accepted manuscripts should link to the formal publication via its DOI
Ce fichier a été téléchargé à partir de PolyPublie, le dépôt institutionnel de Polytechnique Montréal
This file has been downloaded from PolyPublie, the institutional repository of Polytechnique Montréal
Who’s right, Marshall or Jacobs? The Localisation
versus Urbanisation Debate
*Catherine Beaudry
†and Andrea Schiffauerova
École Polytechnique de MontréalAbstract
A large amount of literature provides empirical evidence in support of Marshall or Jacobs theories regarding the specialisation or diversity effects on the economic performance of regions. This paper surveys these scholarly contributions and summarises their results according to their similarities and differences. The reviewed empirical work presents a diverse picture of possible conditions and circumstances under which each kind of externalities could be at work. The wide breadth of findings is generally not explained by differences in the strength of agglomeration forces across industries, countries or time periods, but by measurement and methodological issues. The levels of industrial and geographical aggregation together with the choice of performance measures, specialisation and diversity indicators are the main causes for the lack of resolution in the debate. The three-digit industrial classification seems to be the level at which MAR and Jacobs effects are undistinguishable from one another, and this is often exacerbated by a high level of geographical aggregation.
Keywords: agglomeration externalities, industrial classification, geographical aggregation, growth, innovation
JEL classification: O30, R11, R12
* Beaudry acknowledges financial support of the Social Science and Humanities Research Council of Canada.
We acknowledge helpful comments from Jorge Niosi and Nathalie de Marcellis-Warin, Walter W. Powell, the editor, as well as three anonymous referees. None of these, however, are responsible for any remaining errors.
† Corresponding author: Département de mathématiques et de génie industriel, École Polytechnique de
Montréal, C.P. 6079, succ. Centre-ville, Montréal (Québec) Canada, H3C 3A7, [email protected]
1. Introduction
For about twenty years now there has been a resurgence of interest in the economics of industrial clustering. While initially fuelled by the work of Porter (1990), growth and industrial economists have resurrected the traditional agglomeration forces that urban and regional economists have long taken for granted. The observation that innovative activities are strongly geographically agglomerated both in Europe (Cäniels, 1999; Breschi, 1999) and the US (Jaffe, 1989; Feldman, 1994; Audretsch and Feldman, 1996) has thus led many researchers to investigate the likely causes of this phenomenon.
The nature and utility of knowledge is at the heart of R&D economics, innovation and technological change. Two types of externalities are usually recognised to play a major role in the process of knowledge creation and diffusion (Glaeser et al., 1992): specialisation externalities, which operate mainly within a specific industry and diversity externalities which work across sectors. Marshall (1890) observes that industries specialise geographically, because proximity favours the intra-industry transmission of knowledge, reduces transport costs of inputs and outputs, and allows firms to benefit from a more efficient labour market. Jacobs (1969) believes in diversity as the major engine for fruitful innovations, because “the greater the sheer number of and variety of division of labour, the greater the economy’s inherent capacity for adding still more kinds of goods and services” (Jacobs, 1969, p. 59)3. A closely related debate concerns competition externalities (Porter, 1990). Porter argues that local competition rather than monopoly favours growth and the transmission of knowledge in specialised geographically concentrated industries.
On the one hand, Marshall (1890), Arrow (1962), and Romer (1986) put forward a concept, which was later formalized by the seminal work of Glaeser et al. (1992) and
became known as the Marshall-Arrow-Romer (MAR) model. This model claims that the concentration of an industry in a region promotes knowledge spillovers between firms
3 Jacobs refers to the sheer number and division of labour which is related to, but in some studies
considered different from, what is generally known as urbanisation economies measured by urban size and density. Since large cities are more likely to include universities and other public research institutions,
and facilitates innovation in that particular industry within that region. This specialisation encourages the transmission and exchange of knowledge, of ideas and information, whether tacit or codified, of products and processes through imitation, business interactions, inter-firm circulation of skilled workers, without monetary transactions (Saxenian, 1994). Knowledge externalities between firms, however, only occur among firms of the same or similar industry, and thus can only be supported by regional concentrations of the same or similar industries. It is consequently also assumed that there cannot be any transmission of knowledge spillovers across industries. These localisation externalities are likely to arise when the industry to which a firm’s main activity belongs is relatively large (Frenken et al., 2005). Workers are consequently better
protected from business uncertainty and demand shocks if located in a region with a large local base in their own industry (Mukkala, 2004). Glaeser et al. (1992, p. 1127) further
argue that “local monopoly is better for growth than local competition, because local monopoly restricts the flow of ideas to others and so allows externalities to be internalized by the innovator.” The MAR model therefore perceives monopoly as better than competition as it protects ideas and allows the rents from innovation to be appropriated. Such interactions can thus positively influence firm productivity and growth. These intra-industry spillovers are known as localisation (specialisation) externalities, Marshall or MAR externalities. In this paper we will use Marshall or MAR indistinctively.
Marshall mentioned two other benefits of geographic concentration: labour market pooling and transport cost savings. Economies of scale emanating from shared inputs in the form of labour equipment and infrastructure between large concentrations of firms from the same industry are another important source of localisation economies (Krugman, 1991). Firms generally locate close to their suppliers to reduce transportation costs and close to their customers to reduce distribution costs (Le Blanc, 2000). The labour market pooling argument rises from the fact that in many industries, workers are often victim of fluctuating demand (this is particularly true for aerospace contracts for instance). The local concentration of firms within the same industry gives rise to a greater number of employment opportunities to dismissed workers. The migration of these workers from firm to firm also contributes to knowledge spillovers.
Jacobs (1969), on the other hand, argues that the most important sources of knowledge spillovers are external to the industry within which the firm operates. Since the diversity of these knowledge sources is greatest in cities, she also claims that cities are the source of innovation. Her theory emphasizes that the variety of industries within a geographic region promotes knowledge externalities and ultimately innovative activity and economic growth. A more diverse industrial fabric in close proximity fosters opportunities to imitate, share and recombine ideas and practices across industries. A science base, which facilitates the exchange and cross-fertilisation of existing ideas and the generation of new ones across disparate but complementary industries, represents the common basis for interaction. The exchange of complementary knowledge across diverse firms and economic agents thus facilitates search and experimentation in innovation. A more diverse economy is conducive to the exchange of skills necessary to the emergence of new fields (Harrisson et al., 1996). Combes (2000a) specifies that this presupposes that
sectors are close technologically, in other words that inventions in one sector can be incorporated in the production of another industry. In addition, a well functioning infrastructure of transportation and communication, the proximity of markets, and better access to specialised services are additional sources of urbanisation externalities which facilitate the operation of firms. Jacobs sees diversity rather than specialisation as a mechanism leading to economic growth. Therefore, a diversified local production structure gives rise to urbanisation (diversification) externalities or Jacobs externalities. A further argument in her thesis concerns competition which is more desirable for growth of cities and firms as it serves as a strong incentive for firms to innovate and hence speeds up technology adoption.
The third type of externality refers to Porter’s (1990) argument, also associated with Jacobs4, that competition is better for growth. Strong competition in the same market provides significant incentives to innovate which in turn accelerate the rate of technical progress of hence of productivity growth. Combes (2000a) highlights the fact that high competition acts as a strong incentive to R&D spending, since firms are forced to be
innovative in order to survive (van Oort and Stam, 2006). The Schumpeterian model however also states that if innovation occurs at too fast a pace, the returns on R&D investment are too low hence counterbalancing the incentive for further spending. Porter also argues that knowledge spillovers occur mainly within a vertically integrated industry, thus agreeing with the Marshallian specialisation hypothesis in identifying intra-industry spillovers as the main source of knowledge externality.
MAR, Jacobs and Porter agree that there are geographical effects of the agglomeration of firms, but that is as far as it goes. They disagree on the effect of industry concentration, MAR (and Porter) arguing that knowledge spills over from firms of the same industry, while Jacobs makes the case for variety of industries. The two schools of thoughts also disagree on the effect of diversity, Jacobs arguing that knowledge spills over across industries while MAR (and Porter) specifically argue against this. MAR and Jacobs hypotheses also differ in the effect that local competition has on knowledge spillovers and growth, Jacobs (and Porter) favour a more competitive environment as conducive to growth while MAR would argue that such an environment is not conducive to innovation as the risks of idea leakages to others are too high.
As a consequence, the question as to which of the Marshall-Arrow-Romer (MAR) or Jacobs externalities is the most beneficial to growth or innovation is rather complex5. Whether diversity or specialisation of economic activities better promotes technological change has been the subject of a heated debate in the economic literature. The answer seems to be “it depends”, which of course is probably the most common answer in economics! It depends on the way it is measured, where it is measured, on which industries, at which level of aggregation. Our contribution to the literature is therefore twofold. First, our aim is to provide a census of the papers that have dealt with the MAR-Jacobs dichotomy (i.e. the regression-based studies providing direct answers in the urbanisation versus localisation debate). Second, our goal is to identify the threshold at which either theory becomes dominant from the point of view of the level of industrial
5 As will be explained later in the paper, less than half of the articles surveyed include competition or Porter
externalities in their analyses, as a consequence, the main focus of the paper will remain MAR and Jacobs externalities.
aggregation, of spatial agglomeration, and so on. It is not the aim of this article to try to determine which one of the two concepts provides a more favourable environment for innovation and economic development, but to investigate why it is that the literature still remains relatively inconclusive. This paper therefore attempts to find the similarities between the various studies in order to draw conclusions on the question.
The remainder of the paper is organised as follows: Section 2 briefly describes knowledge externalities and their role in economic growth and innovation, and presents a summary of the main scholarly articles that provide some empirical evidence in favour or against the MAR and Jacobs theories. The reasons behind the great divergences of opinions within the academic community are explored in section 3, which focuses on indicators for MAR and Jacobs externalities. The possible conditions and circumstances under which each kind of externalities could be at work are reviewed and discussed in sections 4 (industrial classification and aggregation) and 5 (geographical aggregation). The various sources of discrepancies and their impact on three types of performance measures are evaluated in section 6. Finally, section 7 concludes.
2. Knowledge externalities
In general, an externality is defined as an effect emanating from one activity that has consequences for another activity, but is not directly reflected in market prices. Knowledge externalities can positively affect a firm’s innovativeness. The firm usually cannot fully appropriate the new knowledge it creates, and this knowledge thus spills over to other firms or organisations. By “working on similar things and hence benefiting much from each others’ research” (Griliches, 1992, p. S36-37), knowledge spillovers increase the stock of knowledge available for each individual firm.
These spillovers involve tacit knowledge, and their transmission thus depends on distance. Tacit knowledge is ill-documented, uncodified and can only be acquired through the process of social interaction. Consequently, knowledge spillovers are geographically bounded to the region in which the new economic knowledge is created (Anselin et al., 1997; Autant-Bernard, 2001; Feldman and Audretsch, 1999). This
(Feldman, 1994). Bathelt et al. (2004) examine the process of knowledge creation within clusters (local buzz) in addition to the part played by inter-cluster knowledge diffusion and generation. The two main hypotheses on the nature of these externalities and the consequent composition of industrial activity are MAR and Jacobs externalities.
The phenomenon of knowledge externalities and their impact on economic growth and innovation have attracted a great deal of attention in academic circles. Nevertheless, it seems that the exact spillover mechanism is not yet fully understood and documented. In fact, there is no direct proof of the existence of knowledge spillovers and there probably never will be. A large amount of literature provides empirical evidence in support of the Marshall and Jacobs theories; however, the results of these studies are often inconsistent with one another. This section provides a brief survey of these studies and discusses their basic results. The sample of studies is by no means exhaustive. Many other studies have dealt with similar issues. For example, Rigby and Essletzbichler (2002) note the deficiencies of the most common studies which represent agglomeration economies with very vague proxies (e.g. city size) and suggest to precisely measure three kinds of agglomeration economies: input-output linkages, labour pooling and technological spillovers (following Marshall, 1890). They claim that these agglomeration economies are more precise in their meaning than localisation and urbanisation economies. Duranton and Puga (2004), however, do not regard the Marshall’s classification of agglomeration economies as a particularly useful basis for the taxonomy of theoretical mechanisms, since these agglomeration economies are in fact three sources capturing the same mechanism. They suggest distinguishing theories by the mechanism driving them and propose another formulation based on the notions of sharing, matching and learning, which brings the analysis down to a more basic set of variables.6
The majority of theories put forward in the surveyed papers suggests that either MAR or Jacobs externalities are at play, but not both simultaneously, others include Porter or competition externalities in their models of agglomeration economies (see for
6 These are very interesting studies, but since the focus of the paper is on a rather narrower concept (i.e. the
regression-based studies providing direct answers in the urbanisation versus localisation debate), we do not include them in our sample of papers and leave them for further discussion.
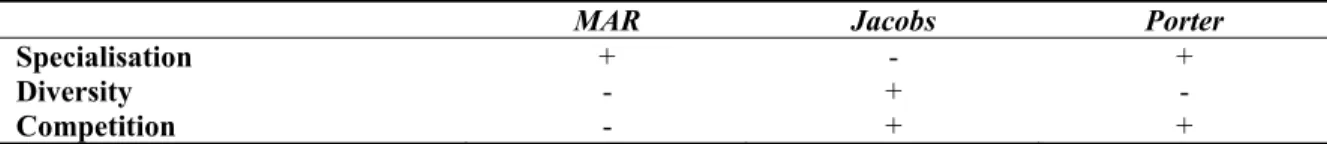
instance, Baptista and Swann, 1999; Lee et al., 2005; Van Oort , 2002; Van Oort and Stam, 2006). Table 1 presents the sources of spillovers according to these theories. Yet, this apparent segregation with regards to MAR and Jacobs theories is not reflected from all these findings as almost half of the studies examined have reported both MAR and Jacobs externalities. In most models therefore, the positive effects of both kinds of externalities are not mutually exclusive. Thus, quite a balanced support for both theories is provided by the surveyed studies, hence sufficient evidence exists to claim that both specialized and diversified local industrial structures may promote economic performance of regions. Duranton and Puga (2000, p. 553) indeed state that “there appears to be a need for both large and diversified cities and smaller and more specialised cities”. Their theoretical model shows that while diversified cities play a crucial role in the development of innovation, specialised cities are more conducive to further growth.
Table 1: Sources of spillovers
MAR Jacobs Porter
Specialisation + - +
Diversity - + -
Competition - + +
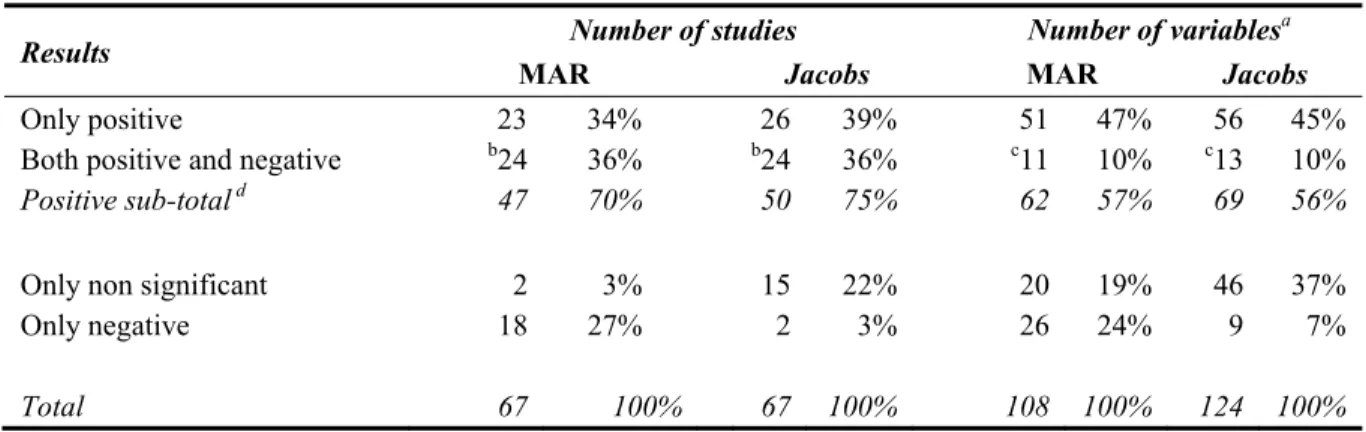
Table 2 summarizes the results from the 67 reviewed articles7, the evidence therein having shown to be partly in conflict with one another. Around 70% of these studies claim to have found some proof of existence of Marshall externalities and their positive impact on economic growth or innovative output, while a comparable proportion of the studies (75%) confirm Jacobs’ thesis of a favourable influence of diversification of economic activities in a region. Around half of the studies providing support for each theory found uniquely positive results; the other half, however, reported concurrently positive and negative or non-significant results for various industries, time periods, countries or dependent variables. The situation is similar if we compare the results summary counted by number of variables8. Here, as in the remainder of the paper, each
7 An unpublished appendix available from the authors contains the summary of the main characteristics,
variables, indicators and results from the studies that we have examined.
‘variable’ used in the models examined to measure externalities (MAR or Jacobs) will be counted and linked with each indicator used as a dependent variable. A comparable percentage of MAR and Jacobs variables (57% and 56%) show a positive impact. For most of these variables, the results are uniquely positive, however, 10% of all variables are found to have both positive and negative or non significant results for different time periods, industries and countries.
Table 2: Results summary
Results Number of studies Number of variablesa
MAR Jacobs MAR Jacobs
Only positive 23 34% 26 39% 51 47% 56 45%
Both positive and negative b24 36% b24 36% c11 10% c13 10%
Positive sub-total d 47 70% 50 75% 62 57% 69 56%
Only non significant 2 3% 15 22% 20 19% 46 37%
Only negative 18 27% 2 3% 26 24% 9 7%
Total 67 100% 67 100% 108 100% 124 100%
Notes:
a Each variable used to measure MAR externalities with each indicator used as a dependent variable is
counted as a single variable.
b Both positive and negative (or non significant) results found for various dependent variables, time
periods, industries or countries within one study.
c Both positive and negative (or non significant) results found for various time periods, industries or
countries are counted as one variable.
d At least one variable is positive (the sum of only positive and both positive and negative).
Although positive evidence for both types of externalities is measured, many of these studies have also detected negative impacts. The score is much less balanced here, because the solely negative influence is observed much more often for Marshall externalities than for Jacobs externalities (only in 3% of all the studies). These findings suggest that if regional specialisation may hinder economic growth, diversification is much less likely to induce this negative effect. This may be first related to the lower flexibility of the specialized regions and consequently to their decreased capacity to adjust to exogenous changes, which may prove critical if the main industry in the region declines. In a diversified environment endowed with a wider technological scale, the chances that some new industry will spring out and take the lead is greater. Second, specialized regions may be more vulnerable to lock-in, i.e. closing upon themselves,
becoming insular and impermeable, and preventing knowledge and fresh innovative ideas from outside to flow in. The specialized regions tend to become more specialized with time, and thus experience increasingly less external relations than the diversified regions.
Only 25 studies have attempted to detect the three types of externalities: specialization, diversity and competition. Two cases are generally considered, the Marshallian model where specialization externalities are positive and competition has a negative effect (i.e. market power is better for growth), and the Jacobian model where both diversity and local competition have a positive effect (van der Panne, 2004; and van der Panne and van Beers, 2006). The results of Porter or competition externalities are found in Table 3.
Table 3: Results for the Porter externalities found in conjunction with Marshall and Jacobs positive results
Porter externalities results Number of dependent variables with positive results
MAR only Jacobs only Botha Noneb Total
Positive 4 11 6 5 26
Negative 2 3 5
Non significant 3 2 5
Total 9 14 8 5 36
Notes:
a Number of dependent variables for which both MAR and Jacobs externalities are found.
b Number of dependent variables for which neither MAR nor Jacobs externalities are found.
Porter’s views on competition were most often supported in conjunction with Jacobs’ theory, which is consistent with the Jacobian model described above. Porter however also agrees with the MAR specialization hypothesis regarding intra-industry spillovers and the two theories were simultaneously supported in 9 regressions, which goes against the Marshallian model presented above. Only, 6 regressions have showed a concurrent support for all the MAR, Jacobs and Porter theses. Since most of the studies did not include the Porter externalities our main focus for the rest of the paper will remain on MAR and Jacobs externalities. We will refer to these results throughout the paper, but they do not constitute the main argument here.
The empirical evidence regarding the nature and magnitude of externalities yields mixed results. This is not surprising, considering that knowledge spillovers are invisible
and “leave no paper trail by which they may be measured or tracked” (Krugman, 1991, p. 53). The results can be explained mainly by measurement and methodological issues and to some extent also by differences in the strength of agglomeration forces across industries, countries or time periods. The remainder of the paper discusses these specific factors and tries to determine the influence of data and the way it is analysed on the likelihood of detecting MAR or Jacobs externalities.
3. Indicators of MAR and Jacobs externalities
The most obvious differences among the studies are the ones associated with the choice of independent and dependent variables. Frenken et al. (2005, p. 22) suggests that this “ambiguity in results is probably due, at least in part, to problems of […] definitions of variety, economic performance, spatial scale and spatial and sectoral linkages…”. Out of the many independent variables present in the regressions, this paper will only focus on two categories: local specialisation as evidence of MAR economies and local diversity to detect the presence of Jacobs externalities. Some studies, probably constrained by data availability, utilize the same index to measure the impact of both specialization and diversity in the same variable (for example the Hirschmann-Herfindahl index in Loikkanen and Susiluoto, 2002). Authors then may interpret a positive sign (or high values) on the coefficient as evidence of prevailing Marshall externalities and a negative sign (or low values) as a proof of Jacobs economies. This methodology, however, may not be appropriate in some industries because both kinds of economies could be present simultaneously9. The two externalities are obviously not mutually exclusive, since specialisation is a particular characteristic of a certain sector within a local system, whereas diversity is a property characterising the whole area. This suggests that testing the two hypotheses separately with different indicators is more appropriate.
3.1 MAR externalities
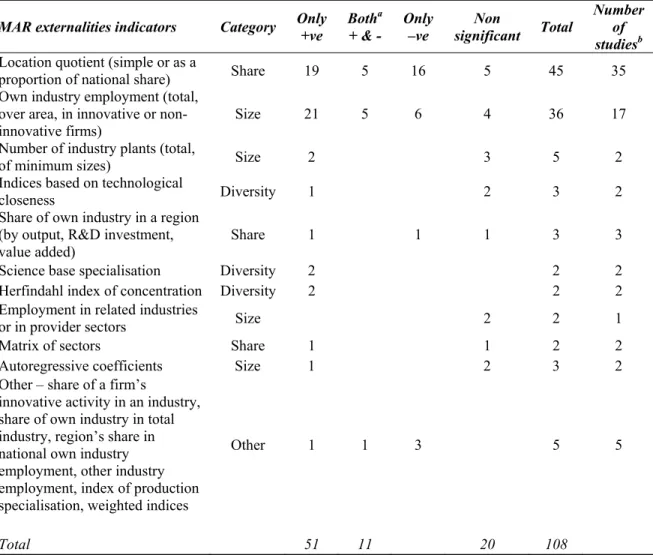
The location quotient and own industry employment, which together account for 75% of independent variables used in these studies, are the most common Marshall externalities indicators utilised. Other measures encountered are the number of industry
9 According to the tables in Appendix B, about a third of the dependent variables find evidence of both
plants, several indices based on technological closeness of sectors, measures indicating the share of own industry in a region (measured either by output, R&D investment or industry value added) and other indicators listed in Table 4. These indicators are divided into four categories according to what they measure: Share represents indicators based on the relative sizes of the industry, where the proportion a particular industry within the same or other industries in the country, region, and so on, are calculated; Size are indicators considering absolute sizes of the industry expressed by employment, number of plants, and so on; Diversity represents indicators based on industrial diversity using technological closeness of industries, specialisation of the science base, and so on; and
Other indicators are those not allocated within any of the categories above. This
categorisation will be used throughout the article in order to designate which kind of indicator shows a greater number of positive results for Marshall externalities.
Glaeser et al. (1992) first expressed the idea that the degree of specialisation may
better represent the potential for Marshall externalities than current size of an industry, because it better captures intensity and density of interaction among firms. The location quotient has become widely used for this purpose; it is the most frequently used indicator in the studies reviewed. The location quotient belongs to the category of indicators based on industrial share, since it represents the fraction of industry employment in a region relative to the national share. The results produced by the regressions that utilised this measure are mostly uniquely positive for the Marshall indicator, however a large number of cases showing negative impacts of specialisation is found as well10. In a number of studies, however, a simpler location quotient is used to measure MAR externalities as a share of a region’s employment in an industry. Van Soest et al. (2002) have compared the results of the two indices for the same data and concluded that, at least in case of the Netherlands, the relative location quotient (relative to the national share) better captures the impact of Marshall externalities than its simpler version - industry proportion in the region. The relative indicator of specialisation controls for the size of industries at the
10 The more complex relative location quotient comparing to the national share provides the vast majority
national level, whereas the simpler indicator does not. Simpler measures of MAR externalities are more likely to yield positive results.
Table 4: Number of indicators (independent variables) of MAR externalities
MAR externalities indicators Category Only +ve Both+ & -a Only –ve significant Total Non Number of studiesb
Location quotient (simple or as a
proportion of national share) Share 19 5 16 5 45 35
Own industry employment (total, over area, in innovative or
non-innovative firms) Size 21 5 6 4 36 17
Number of industry plants (total,
of minimum sizes) Size 2 3 5 2
Indices based on technological
closeness Diversity 1 2 3 2
Share of own industry in a region (by output, R&D investment,
value added) Share 1 1 1 3 3
Science base specialisation Diversity 2 2 2
Herfindahl index of concentration Diversity 2 2 2
Employment in related industries
or in provider sectors Size 2 2 1
Matrix of sectors Share 1 1 2 2
Autoregressive coefficients Size 1 2 3 2
Other – share of a firm’s
innovative activity in an industry, share of own industry in total industry, region’s share in national own industry employment, other industry employment, index of production specialisation, weighted indices
Other 1 1 3 5 5
Total 51 11 20 108
Notes:
a Both positive and negative (or non significant) results found for various time periods, industries or
countries are counted as one variable.
bSome studies have used more than one type of indicator, the number of studies is therefore included as a
point of reference only.
The location quotient has been criticized as an indicator of local specialisation. Ejermo (2005) observed that this measure is very sensitive to the size of the region. Combes (2000b) shows the flaws in the calculation of the location quotient and his corrections of this measure significantly reverse the sign of the relative concentration effect on local growth.
A much simpler measure of the level of local specialisation is own industry employment, the most frequently encountered indicator of the category based on the absolute size of the industry. Own industry employment is sometimes suggested to be a better proxy for localisation economies than the location quotient, because the localisation economies arise from the absolute and not the relative size of the industry (for instance Marshall’s size of the skilled labour pool). A region might represent a strong cluster in a certain industry, even if this industry accounts for a negligible share of the region’s overall range of activities. It has also been suggested to distinguish between employment in innovative and non-innovative firms in a given industry, because not all employees generate spillovers (Beaudry and Breschi, 2000, 2003) and spillovers are more
likely to emanate from firms that also innovate. Henderson (2003) decomposes own industry employment in a region into the number of plants and the average employment in those plants to discover that it is the number of plants in a region that produces the strongest results. He suggests that localisation externalities derive from the existence of companies per se, where these companies could be interpreted as separate sources of
information spillovers.
3.2 Jacobs externalities
Measures of Jacobs externalities encountered in the reviewed studies are of an even greater variety: Hirschman-Herfindahl index (the most common), other industry employment, Gini index, total local population, total local employment and others. The full list of the diversity indicators and their associated results are presented in Table 5. Indicators of Jacobs externalities are also divided into categories according to the different focus of the measures. The category based on diversity covers different measures of industrial diversity and specialisation, while the one based on market size represents the scale of urbanisation economies and includes various employment or population measures (for instance in Viladecans-Marsal, 2000, 2004). The category other indicators is used for those which are not allocated to the previously mentioned groups.
Table 5: Number of indicators (independent variables) of Jacobs externalities
Jacobs externalities indicators Category Only +ve Both+ & - a Only -ve significant Total Non Number of studiesb
Hirschman-Herfindahl index (employment, patent, industry
value added) Diversity 21 6 1 21 49 38
Other industry employment (total, in innovative or non-innovative firms)
Size 2 3 6 8 19 10 Gini index of diversity
(employment, patent, science
base) Diversity 10 3 13 7
Total urban area population Size 6 2 8 6
Total local employment (employment, in manufacturing
and in services) Size 3 2 2 7 6
Share of other industry employment (5 largest, 11
largest) Size 4 2 6 3
number of active industries in a
region Size 2 2 1
Ellison-Glaeser index Other 2 2 1
Share of innovations or industries
with the same science base Diversity 2 2 1
Indices based on technological
closeness (patents, sectors) Diversity 1 1 2 2
Related variety Diversity 1 1 2 1
Share of other industry output Other 1 1 1
Weighted indices of several
elements Other 1 1 2 1
Other – indices of specialisation, diversification, urbanisation, Theil index, urban to rural continuum codes, matrix of sectors and other based on expected population, weighted own industry employment and region’s employment share
Other 5 1 3 9 10
Total 56 13 9 46 124
Notes:
a Both positive and negative (or non significant) results found for various time periods, industries or
countries are counted as one variable.
b Some studies have used more than one type of indicator, the number of studies is therefore included as a
point of reference only.
The Hirschman-Herfindahl index is a diversity-based measure and in all of its forms it is the most commonly used indicator. The results are split approximately half and half between positive and neutral effects and almost no negative results are obtained. The basic form of Hirschman-Herfindahl index is expressed as the sum of the squared shares
of employment in a given region and sector with respect to total or all other industry employment (Callejon and Costa, 1996; de Lucio et al., 1996; or Henderson, 1997), or weighted by the same measure at the national level (Cota, 2002). Other variations frequently encountered are the innovation diversity index based on patent data (Beaudry and Beschi, 2003) or the industry diversity index based on industry value added data (Batisse, 2002). This Hirschman-Herfindahl index is also presented in modified forms, as inversed Hirschman-Herfindahl index (Monseny, 2005; Usai and Paci, 2003) or 1 minus the Hirschman-Herfindahl index (Kameyama, 2003; Mano and Otsuka, 2000). The main drawback of this index is that diversity is measured symmetrically, implying that it does not consider how different or complementary the industrial sectors are, but assumes them to be equally close to one another. Forni and Paba (2002) clearly show that this is not the case and in particular that inter-industry spillovers influence the growth of innovative and mature sectors. The second diversity-based measure of Jacobs externalities is the reciprocal Gini index, encountered in 13 cases, 10 of which yield uniquely positive signs on the coefficients, suggesting the presence of Jacobs economies. The Gini index of diversity is generally used with employment or with patent data.
Other industry employment, the second most popular indicator of Jacobs externalities, does not measure diversity per se but the size of the urbanisation
externality. Diversity is implied by the larger size of the employment base in all other industrial sectors. In many of the studies that employ this technique, a measure of diversity is also put in place, so as to account for both the scale and diversity of the urbanisation economies. As a proxy for measuring regional diversity, total employment in the region (also total manufacturing employment or total employment in services) or total population in the region are used as well. In these models, it is assumed that regions with higher population or employment are the ones with more diversified economic structures. These indicators, however, capture rather global urbanisation externalities, which are related to local market size, but not to the diversity implied by Jacobs externalities per se, because they derive from the specific industrial composition of the region.
The choice of diversity measure seems to be important for the result regarding the presence of Jacobs externalities. While the use of other industry employment usually
shows negative (what is generally referred to as congestion effects) or no effects from a large diversified region, the Gini index of diversity provides positive findings and the selection of Hirschman-Herfindahl index yields an equal number of positive or neutral results on Jacobs economies. These result discrepancies hint towards methodological issues, here the choice of independent variables, as the main cause as to why the debate remains unresolved.
4. Industrial classification
4.1 Level of aggregation
An industry could appear as a statistically homogenous entity if a 1-digit or 2-digit industrial classification is used, whereas the same industry will present a wide variety of different activities if the analysis is based on a 6-digit breakdown11. Frenken at al. (2005) expect diversity measured at the lowest level of aggregation to be positively correlated with economic growth and employment growth. We have therefore analysed the results by industrial aggregation level, where we distinguish broad (1-digit and 2-digit), medium (3-digit) and detailed (4-digit and more) levels of classification. Not all the studies have indicated which industrial classifications scheme was employed. We made an educated guess for the articles where the classification level seemed apparent but not mentioned, and set aside those for which the level could not be determined from the information provided in the paper12.
According to Table 6, the probability to detect Jacobs externalities increases with the level of detail of industry classification, whereas it does not have such tendency for MAR externalities. For specialisation externalities, the highest probability of detection of positive (and the lowest for negative) results is for the medium level of industrial classification, but is somewhat lower for broad or detailed industrial classification schemes. It has been suggested that completely different indicators may need to be selected to identify the MAR externalities precisely (see Rigby and Essletzbichler, 2002 or Duranton and Puga, 2004 mentioned earlier). Their arguments are based on the fact
11 As justifiably pointed out by an anonymous reviewer.
that agglomeration externalities do not operate directly on economic growth, productivity or innovation, but are expressions of deeper forces, i.e. output-input linkages, labour pooling effects or localized innovation effects.13 Furthermore, de Lucio et al. (2002) argue that a single measure of MAR externalities does not allow to identify its various effects. Introducing four measures of specialisation in his analysis, such as within-province specialisation, within-industry specialisation, their squared versions divided by the number of firms to account for non linearity, overshadows diversity (Jacobs) and competition (Porter) effects on productivity growth. King et al. (2002, p. 30) distinguish the location quotient into buyer and supplier based employment and show that in “accord with the argument of Porter (1990) […] clusters of local buyers and suppliers create knowledge spillovers that foster growth even after accounting for pecuniary externalities…”.
Table 6: Number of positive results per industry class by category of independent variable
Industry aggregation level Indicators (+ve) MARSHALL EXTERNALITIES Total %b Share Size Diversa Total +ve -ve
Broad (1-digit and 2-digit) 15 19 2 36 53% 24%
Medium (3-digit) 7 4 2 13 68% 11%
Detailed (4-digit and more) 4 5 9 56% 31%
Total 26 28 4 58 56% 22%
Industry aggregation level Indicators (+ve) JACOBS EXTERNALITIES Total %b Divers Size Other Total +ve -ve
Broad (1-digit and 2-digit) 21 14 2 37 45% 10%
Medium (3-digit) 11 2 1 14 64% 0%
Detailed (4-digit and more) 9 3 2 14 74% 16%
Total 41 19 5 65 52% 9%
Notes:
a Diversity indicators were grouped with Other indicators described in Table 4.
b Percentage of the total number of indicators (independent variables) which showed positive or negative
significant results.
As a rough rule of thumb from the evidence presented in the table, we can infer that at the broad level of detail, MAR effects are slightly more prone to show up than Jacobs externalities, the probabilities of detecting MAR or Jacobs effects are quite comparable at
the medium level and Jacobs effects will decidedly appear more often when a more detailed classification is used. As mentioned earlier, the broad industrial level, and to a certain extent the medium industrial classification as well, include a relatively wide variety of firms classified in various subsectors. As such, the variables used to detect MAR externalities probably also detect part of the size of urbanisation externalities. This would contribute to inflate the importance of MAR externalities at the broad and to a lesser extent at the medium level. Frenken et al. (2005), measure the related
entropy/variety by calculating the marginal increase in variety when moving from
two-digit to five-two-digit industrial classification and the unrelated entropy/variety index at the
two-digit level. The former reflects variety within the same 2-digit industry while the latter the variety between very different types of activities. While related variety does have a strong effect, unrelated variety does not. The majority of studies examined measure diversity in terms of what Frenken et al. refer to as unrelated variety. It is
therefore possible that in doing so, many studies may in fact inflate the importance of MAR externalities (measured by size indicators) because of the embedded related variety
within two-digit or even three-digit industries and underestimate Jacobs externalities because they are measured as unrelated variety. Hence at these levels of aggregation,
MAR and Jacob externalities would tend not to be perfectly distinguishable. The three-digit level of industrial classification could thus be considered as a threshold at which specialisation and diversity are less distinguishable from one another, before which “specialisation” is more likely to be detected. Throughout the paper, we will therefore keep this distinction of broad, medium and detailed industry classifications in order to determine more precisely its combined influence with that of other study characteristics (types of dependent and independent variables).
4.2 Industrial sectors
An important difference in these studies lies in the selected industries. Analyzed data may come from only one industry (as in Beaudry, 2001; or Baptista and Swann, 1999). The analysis may also consider all the range of industries including non-manufacturing services such as wholesale and retail trade (as in Glaeser et al., 1992, Beaudry and Swann 2001, 2007; Combes, 2000a; Combes et al., 2004), but it is also common to completely
productivity estimation in services. Furthermore, the methodology may involve an analysis of one manufacturing industry at a time (as in Henderson et al., 1995), which allows to distinguish the roles of either type of externalities in each industry. This approach, however, may not be applicable to all countries, especially in small countries with only a relatively small number of locations where the selected industries can flourish (van Soest et al., 2002). An alternative approach here is to consider only a number of the largest industries of all types in each region (for example the 6 largest industries in each city as in Glaeser et al., 1992, and the 5 largest industries as in King et al., 2002), which may de facto automatically increase concentration levels in each city. The selected range
of industries used for the sample may yield further differences.
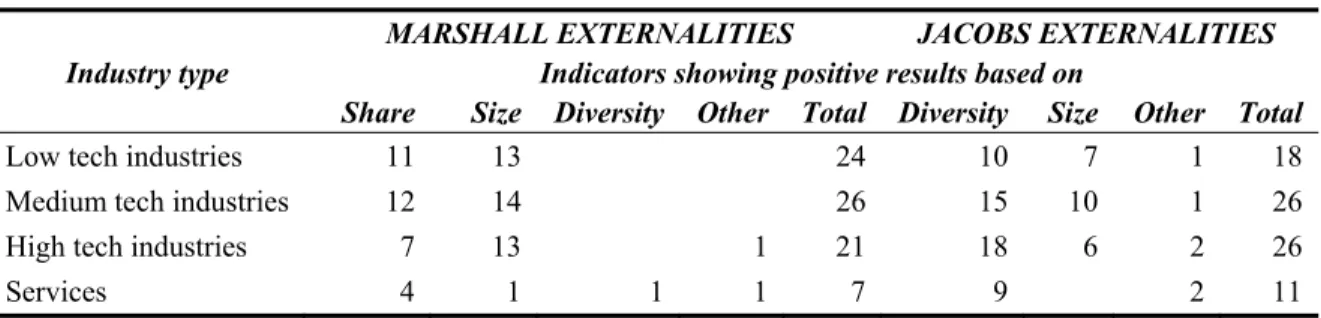
In order to determine the factors that may influence the particular suitability of the specialized or diversified region, a more detailed analysis of industrial sectors is carried out. Industries are grouped into four categories: high tech industries, medium tech industries, low tech industries14 and services. Summary counts of positive results according to industry types are presented in Table 7. Surprisingly, the differences among
the sectors in regards to the effects that both types of externalities have on regional performance are not striking. We can still say that externalities probably do play different roles in different industries, and that the effects of specialisation and diversification economies thus slightly differ across industrial sectors.
We expect that low technology, low R&D intensity companies with traditional, more standardized production probably benefit more from the decentralized location in specialized regions, which bears cost advantages and therefore we expected to detect mainly MAR externalities in low tech sectors. Although not overwhelming, there is some evidence that in low tech sectors, Marshall externalities are slightly more frequent than
14 We distinguished the industrial categories according to R&D intensity: high tech relates to aerospace,
consumer electronics, office and computing machinery, semiconductors, pharmaceuticals, biotechnology,
nanotechnology, optical and precision instruments; medium tech includes electrical and non-electrical
machinery, fabricated metal products, motor vehicles, railroad transport equipment, shipbuilding, chemical
products, instruments; and low tech consists of wood products, furniture, textile and clothing, leather,
apparel, food, beverage and tobacco, paper, printing, non-metallic mineral products. Two unpublished appendices available upon request from the authors present the list of all the industries compiled according
Jacobs externalities. The positive results of medium tech sectors are quite balanced for both Marshall and Jacobs externalities. Henderson et al. (1995) found that standardized manufacturing activities are in vast majority located in small specialized metropolitan areas. Henderson et al. (2001) found similar results regarding the importance of MAR externalities in Korea. In this later study, diversity or urbanisation economies were however only found for the high tech sectors. High technology, R&D intensive companies probably prefer to locate in large diversified urban areas, where the cross-fertilisation of knowledge and ideas from outside the core industry, which is so crucial for the high tech breakthroughs, is possible and easily available. The results indeed show that the high tech sectors slightly favour more diversified regions, while the effects of Marshall externalities are less numerous.
Table 7: Number of positive results (dependent variables) by industry sector type15
Industry type MARSHALL EXTERNALITIES Indicators showing positive results based on JACOBS EXTERNALITIES Share Size Diversity Other Total Diversity Size Other Total
Low tech industries 11 13 24 10 7 1 18
Medium tech industries 12 14 26 15 10 1 26
High tech industries 7 13 1 21 18 6 2 26
Services 4 1 1 1 7 9 2 11
The role of externalities also varies according to the nature of the sector, whether manufacturing or services. Consumer service sectors provide non-tradable goods, which should be produced and consumed in the close proximity of customers. This results in spreading the service activities around and among the customers rather than the concentration of these activities. Business services, on the other hand, greatly benefit from the presence of other sectors located around and are thus concentrated near the firms to which they sell their products. In both cases the location of services should be more
15 Not all studies have measured the effects or provided details about separate industrial sectors, and
therefore some references are not included in this table. Some studies, however, analysed the data for several industries and the positive results are therefore included in each category. Moreover, results will not be presented here in terms of independent variables as the number of industries covered is as vast as the number of papers and would need to be compared in terms of specific sectors to be meaningful. This is beyond the scope of this paper. The results presented here are therefore an aggregation of the number of dependent variables for which a positive influence of MAR and Jacobs economies were found in general for low, medium, high technology manufacturing industries, and for services.
suitable in cities (or diversified regions). In accordance with the findings presented in Table 7, diversification indeed appears to be the main growth promoter in services (these positive coefficients came mainly from diversity-based independent variables).
To summarise, it seems that economic performance in both specialized and diversified regions is promoted for all three groups of industry types. The effects of Marshall externalities are nevertheless slightly stronger in low tech sectors, while the positive impact of Jacobs externalities on regional performance increases with increasing technological intensity. Cross-fertilisations and spillovers may therefore be more useful in high technology sectors. Both relative and absolute sizes of a given industry influence the presence of Marshall externalities for low and medium tech industries, while in high tech sectors, it is mainly the absolute size of the industry which matters. In the case where Jacobs externalities are observed, for all industrial types it is uniquely the diversity of the industrial base, and not the size of the local market, that promotes the regional growth. The size of the industrial base more often than not reflects congestion effects which are detrimental to growth.
The findings of some authors show that the role of externalities of each kind varies in accordance with the maturity of an industry, since old industries might benefit from a different industrial structure than new ones. Henderson et al. (1995), for example, find
evidence of only Marshall externalities for mature capital goods industries, however, for new high-tech industries, they observe positive effects of both Jacobs and Marshall externalities. They put forward the concept of urban product cycles where Jacobs externalities are necessary to attract new industries while MAR externalities are important for retaining them. These findings are also consistent with the industry life cycle model of Duranton and Puga (2001) who show that new industries prosper in diversified metropolitan areas but, when they mature, the production will decentralize to more specialized regions. It also agrees with the results of Boschma et al. (2005), who observe that Jacobs externalities are predominant in the early stages of the industry life cycle, whereas Marshall externalities appear at a later point, and in the end, the specialisation will in fact hinder economic growth. Separating 16 manufacturing sectors into high, medium-high, medium-low and low technology categories, Greunz (2004)
finds MAR externalities to be highest for innovation in medium-low tech sectors while the impact of Jacob externalities is highest for high tech sectors and decreases with the level of technological sophistication. Forni and Paba (2002), however find that mature industries and research intensive industries benefit from inter-industry spillovers. The differences in the impacts of the various local industrial compositions during the industry life cycle could be explained by the different needs of the firms during the innovative process. In the initial stage of the innovative process an increased diversity and variety propels the creation of novelty, inventive ideas, creative concepts and radically new designs. When the industry matures and the design reaches a critical mass on the market, the product becomes standardized and the knowledge involved in the innovation process highly specialized. Firms then may greatly benefit from learning from the solutions and mistakes of other firms in the same industry in a region with high concentration of their own industry. Finally, it is the high concentration of the mature industry, which decreases the region’s ability to innovate, rejuvenate and restructure, and which inevitably leads the region into a lock-in. Including the sectoral employment in the country at the start of the sample allows Cainelli et al. (2001) to control for the starting conditions of each industry
and to measure the various degrees of maturity of industry-regions. They argue that the growth of the manufacturing sector depends on the history and on the economic performance of the region where it is located. Including the extent of innovative efforts (R&D and patents) in their analysis allows them to evaluate the catching up of regions, and the technological science base is found to be crucial at determining the growth potential of a region (especially for the medium and low tech sectors). This would seem to indicate that mature industries would do better in prospering and innovative regions. Porter (2003) argues that states that are getting more specialized have a higher performance (measured by wage growth). Moreover, more mature clusters within which the proportion of employment in strong clusters has increased are also increasingly concentrated, while the other clusters are getting more dispersed. Porter (2003, p. 569) however warns that “reliance on a few clusters [~industries]16 is dangerous for regional economic development because it exposes a region to shocks and business cycles”.
5. Geographical considerations
5.1 Geographical unit
The selected level of geographical aggregation and the division of the observed territory into regions for the study of geographical specificities is yet another source of possible discrepancy in the results. Baldwin and Brown (2004) argue that when testing for diversity, the geographic unit of analysis should not oversize labour market regions as it is on that level that product variety has an influence. Table 8 presents the summary of
the studies and group them according to the selected geographical unit. Five different classes of geographical units are observed, Class 1 being the largest (state or provincial) units and Class 5, the smallest (highly populated areas and cities). Classes 1 and 2 are administrative units, which usually remain unchanged over time and contain the relevant economic market. Class 3 contains all the labour zones, which are the groupings of municipalities, characterised by a high degree of self-contained flows of commuting workers. This makes labour zones economically more homogenous than administrative units. Class 4 represents the smallest postal code level areas, which are usually arbitrary administrative units, not functional economic areas. All these four classes have in common a full coverage of the territory of the country or a selected region, while the areas in Class 5 do not cover the whole surface, but focus only on highly populated areas and cities. Proximity and frequent interactions makes externalities particularly large in a city but, by considering only selected densely populated areas, a large part of the economy is missed.
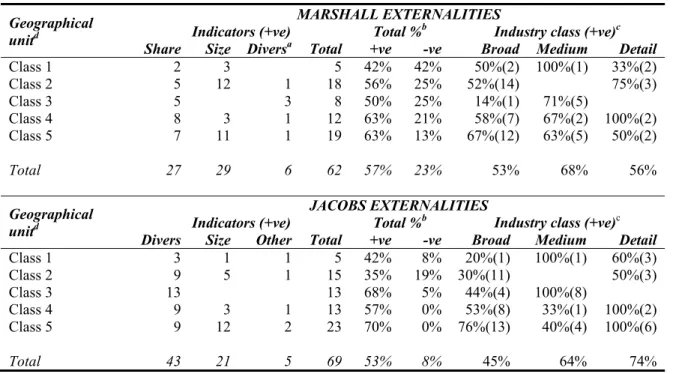
This part of analysis had the initial objective of finding out whether different kinds of externalities are associated with different geographical classes. The results in Table 8 are quite balanced and show that the effects of Marshall and Jacobs externalities are more often present as the level of geographical aggregation decreases. It seems, however, that the smaller the selected geographical unit is, the stronger and more frequent are the effects encountered. Moreover, Table 13 in Appendix B shows that with smaller geographical unit, there are more of Marshall and Jacobs simultaneous positive results and less of non significant or negative results. This is also observed by Glaeser et al.
(1992), who notice that the magnitude of external effects increases as the geographical unit becomes smaller. When comparing classes 4 and 5, van Soest et al. (2002) report that the only factor that increases in magnitude is the number of establishments per employee in the cluster (city and zip-code) industry relative to establishments per employee in the industry (i.e. a measure of competition). MAR externalities are becoming less negative and Jacobs externalities very slightly less pronounced. Porter (2003) however finds that US states are becoming more specialized, while Economic Areas, which are smaller, are becoming less specialized. This would seem to go against the evidence presented in Table 8.
As mentioned before, the theory would tend to predict that as the geographical level becomes more detailed, MAR and Jacobs externalities should have a better chance of being measured. While in general this is what we observe, for the medium industrial level the evidence is the opposite of what we would expect. Let us therefore take a magnifying glass and examine in greater details the studies that constitute these results.
Only one study constitutes the medium-level industry class/Class 1 geographical unit: Kelley and Helper (1997) measure the likelihood of adoption of computer-numerical-controlled technology among establishments in 21 3-digit industries. The MAR indicator used in this study is the location quotient of an aggregation of the machine products industries in the BEA economic areas. As such, it is more akin to a broad definition of industry level. Beaudry’s (2001) aerospace study is the only one in the detailed industrial aggregation in geographical class 2 category. Similarly, in the detailed industrial aggregation/geographical class 4, the ICT study of van Oort and Stam (2006) explains 100% of the positive MAR externalities. In the same column also, the two variables that yield positive specialisation externalities are studies of biotechnology and the computer industry. It would therefore seem that papers that focus on very specific industries (aerospace, biotech, ICT and computers) tend to strongly support MAR externalities.
Table 8: Number of positive results per geographical unit by category of independent variable and industry classification level
Geographical unitd
MARSHALL EXTERNALITIES
Indicators (+ve) Total %b Industry class (+ve)c Share Size Diversa Total +ve -ve Broad Medium Detail
Class 1 2 3 5 42% 42% 50%(2) 100%(1) 33%(2) Class 2 5 12 1 18 56% 25% 52%(14) 75%(3) Class 3 5 3 8 50% 25% 14%(1) 71%(5) Class 4 8 3 1 12 63% 21% 58%(7) 67%(2) 100%(2) Class 5 7 11 1 19 63% 13% 67%(12) 63%(5) 50%(2) Total 27 29 6 62 57% 23% 53% 68% 56% Geographical unitd JACOBS EXTERNALITIES
Indicators (+ve) Total %b Industry class (+ve)c
Divers Size Other Total +ve -ve Broad Medium Detail
Class 1 3 1 1 5 42% 8% 20%(1) 100%(1) 60%(3) Class 2 9 5 1 15 35% 19% 30%(11) 50%(3) Class 3 13 13 68% 5% 44%(4) 100%(8) Class 4 9 3 1 13 57% 0% 53%(8) 33%(1) 100%(2) Class 5 9 12 2 23 70% 0% 76%(13) 40%(4) 100%(6) Total 43 21 5 69 53% 8% 45% 64% 74% Notes:
a Diversity indicators were grouped with Other indicators described in Table 4.
b Percentage of the total number of indicators which show positive or negative significant results.
c Percentage of the number of positive results per each industry classification level: broad (2-digits or less),
medium (3-digits), detailed (4-digits or more). The numbers in parentheses represent the total number of positive results per independent variable.
d Classes of geographical units:
• Class 1: state (US, Mexico), province (China), CSO region (UK), BEA area (US), region NUTS 2 (full
coverage)
• Class 2: county (UK), province (Italy, Spain), prefecture (Japan), department (France), COROP
(Netherlands), region (Israel), CSO region (UK), region NUTS 3 (full coverage)
• Class 3: labour zones: local labour systems (Italy), zones d’emploi (France), local labour market
(Sweden) (full coverage)
• Class 4: Zip-code (Netherlands, Spain), district LAU 1, region NUTS 4 (full coverage)
• Class 5: SMA or MSA (USA), city, urban area (partial coverage)
In the medium-level industry class/Class 3 geographical unit, 3 studies yield positive MAR coefficients: Paci and Usai (1999 and 2000) which are very similar studies on the same dataset, as well as Forni and Paba (2002). This last study examines the intra-industry and inter-intra-industry growth linkages using 2x3-digit and 3x3-digit matrices to find evidence of MAR externalities. It clearly shows that as the level of aggregation of the industry decreases, the percentage of positive and significant results in favour of MAR effects on employment growth decreases (from 68% in the 2x3-digit matrix to 51% in the 3x3-digit matrix).
The four broad industrial level studies in the 3rd geographical class all include some measure of average firm size and only show 14% of positive MAR effects (for productivity, while the other studies are in the economic growth category). These studies would therefore favour the Jacobian model where specialisation is detrimental to growth, but diversity and competition make a more favourable environment in which firms strive.
Examining a bit more closely the combination of results, we find that in 43% of cases, when competition or Porter externalities are included, evidence of MAR externalities disappear. In their study on productivity growth, Lee et al. (2005) show that competition (Porter) and diversity (Jacobs) yield positive effects while specialisation (MAR) are negative (or non significant when diversity is included, the two measures being correlated at -0.68). They also find that competition has a positive effect on productivity growth for technologically oriented industries and that Jacobs’ model better suits the traditional light industry and the heavy industry in Korea (which partially contrast the results of Nakamura (1985) who finds positive specialisation externalities in heavy industries). However, when Porter externalities are not detected (not significative), MAR externalities are always positive. When competition externalities are negative, MAR variables have a negative effect on wage growth and R&D intensity, but a positive effect on the number of new inventions and the number of innovators. It is when Porter externalities are positive that the results are less obvious. In many of these studies (9 out of 11) which use as a proxy for competition the relative number of firms per employee17 (as in Glaeser et al., 1992), MAR externalities disappear as a positive factor of
employment growth. Either Jacobs’ is the true model for employment growth, or the combination of an employment based left hand side variable, with a relative location quotient (share of industry employees in the cluster divided by the share of the industry in the country) as a measure of specialisation, and the number of firms per employee in cluster-industry divided by the number of firms per employee in the industry as a
17Glaeser et al. (1992) interpret the number of firms per worker as a measure of the degree of local
competition. Competition would be better measured by a concentration ratio and relatively few studies at the regional level possess the necessary data (employment of the individual firm) to calculate such a competition indicator. Greunz (2004, p. 567) justifiably points out that this measure is far from perfect as a city with one firm that hires 10 employees would yield the same level of competition as a city with 1 000 firms that hire 10 000 workers, despite the fact that the first city is a monopoly.
measure of competition diminishes the importance of the measure of specialisation. In contrast, when measures of competition include individual firm employment or a concentration ratio, specialisation externalities are also detected hence favouring Porter’s theory. These results hint towards a methodological bias that favours either theory depending on the independent variables included in the regression analysis.
On the fact that his results show that competition negatively affect regional innovativeness (50% of our sample), van der Panne (2004, p.602) writes “as the competition index […] merely measures local average firm size, this result is consistent with what has come to be called the ‘Schumpeter Mark II’ assertion: large firms are expected to have advantages over small firms in the innovation process as they have at their disposal substantial means to engage in R&D and exploit economies of scale and scope in the innovation process”.
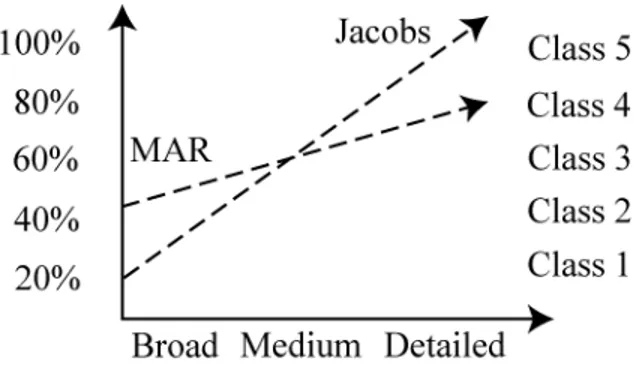
The selection of a geographical unit therefore plays a role. The studies which used larger geographical units such as states or provinces and a broadly grained industrial data usually ended up detecting MAR more than Jacobs externalities, whereas the studies based on the city level (SMA or MSA in the US) which used detailed industrial data found most commonly evidence of the Jacobs effects and to a lesser extent of the specialisation effects. This further confirms the existence of the threshold at the medium classification level and hints at a threshold between geographical classes 2 and 3. The agglomeration effects in conjunction with the level of industrial classification can therefore be summarized in Figure 1.
Figure 1: General tendency of the detection of Mar and Jacobs effects by geographical classification and industrial aggregation
The two dashed lines represent the percentage of positive results obtained for both MAR and Jacobs externalities. The threshold would therefore appear to be where the two lines cross each other, to the left of which distinguishing the two effects being rather difficult.
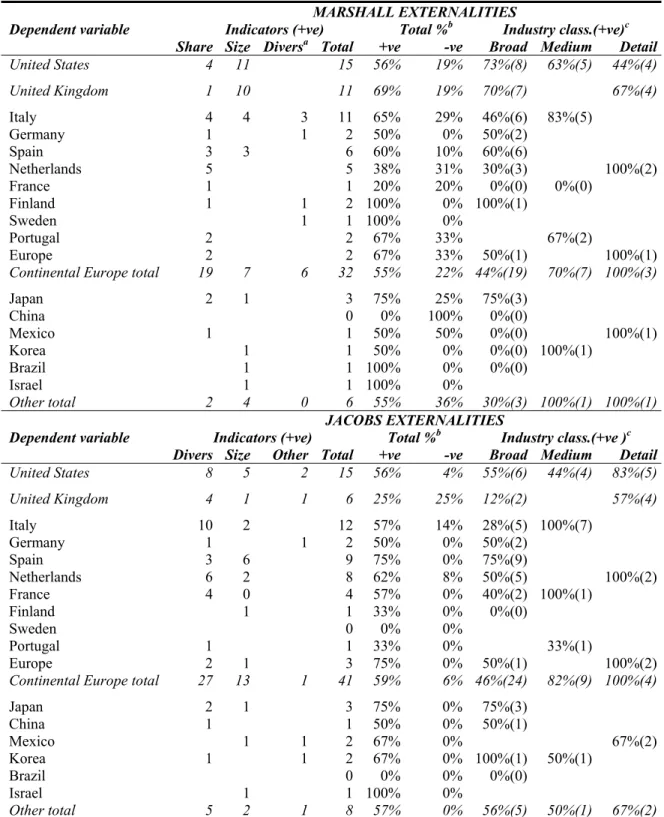
5.2 Countries and regions
As the economic environment and the dispersion of population vary from one country to the next, we expect some differences to arise in the effects of agglomeration economies in various countries. The differences in the impact of Marshall and Jacobs externalities on regional performance according to the country where the research is undertaken are presented in Table 918. The results do not vary markedly from one country to another. The exceptions are the United Kingdom, where the overwhelming majority of studies observed positive Marshall economies (mainly through own-industry employment) and to a certain extent Spain, France and the Netherlands, where Jacobs theory is mostly supported. Otherwise, the studies in all the other countries seem to find an even distribution of evidence for both specialisation and diversity effects.
Some authors have carried out simultaneous studies of several countries and found quite comparable results, as Henderson (1986) for the US and Brazil. Other researchers have encountered distinct effects of the two externalities for different countries, as Beaudry and Breschi (2000, 2003) for the UK and Italy or Beaudry et al. (2001) for
several European countries. In fact, the industrial and economic compositions of the studied countries differ and the spillover mechanisms may actually work quite differently. For example, Cingano and Schivardi (2004) note that Italy has quite a distinct productive system, which is characterized by areas with a substantial presence of small and medium enterprises in the traditional sectors, and which could be particularly conducive to interaction-induced externalities of the Marshall type.
18 Table 14 in Appendix B group the studies according to the different countries examined and shows the