To link to this article :
doi: 10.1063/1.4904975
URL :
http://dx.doi.org/10.1063/1.4904975
O
pen
A
rchive
T
OULOUSE
A
rchive
O
uverte (
OATAO
)
OATAO is an open access repository that collects the work of Toulouse researchers and
makes it freely available over the web where possible.
This is an author-deposited version published in :
http://oatao.univ-toulouse.fr/
Eprints ID : 13569
To cite this version :
Zhao, Jisheng and Leontini, Justin S. and Lo
Jacono, David and Sheridan, John Chaotic vortex induced
vibrations. (2014) Physics of Fluids, vol. 26 (n° 2). pp. 1-7. ISSN
1070-6631
Any correspondance concerning this service should be sent to the repository
administrator:
[email protected]
Chaotic vortex induced vibrations
J. Zhao,1J. S. Leontini,2D. Lo Jacono,3and J. Sheridan1
1Fluids Laboratory for Aeronautical and Industrial Research (FLAIR), Department
of Mechanical and Aerospace Engineering, Monash University, Melbourne, Victoria 3800, Australia
2Department of Mechanical and Product Design Engineering, Swinburne University
of Technology, Hawthorn, Victoria 3122, Australia
3Institut de Mécanique des Fluides de Toulouse (IMFT), CNRS, UPS and Université de
Toulouse, 31400 Toulouse, France
This study investigates the nature of the dynamic response of an elastically mounted cylinder immersed in a free stream. A novel method is utilized, where the motion of the body during a free vibration experiment is accurately recorded, and then a second experiment is conducted where the cylinder is externally forced to follow this recorded trajectory. Generally, the flow response during both experiments is identical. However, particular regimes exist where the flow response is significantly different. This is taken as evidence of chaos in these regimes.
[http://dx.doi.org/10.1063/1.4904975]
This letter presents the results of an investigation of the dynamic response of an elastically mounted cylinder immersed in a free stream. In particular, the focus is on the identification of low-dimensional chaos in the upper branch flow regime1,2of vortex-induced vibration (VIV). For
the dynamically more complicated case of a flexible cylinder, chaos has been identified as a generic feature of the response,3Hover, Techet, and Triantafyllou4and Hover5show experimental evidence
of low spanwise correlation and high levels of disorder in the upper branch, and three-dimensional simulations from Lucor, Foo, and Karniadakis6show a variation in the organization of the vortices
along the span.
Morse and Williamson7 used data from experiments on an externally controlled sinusoidally oscillating cylinder to construct a low-order model of the interaction between the body and flow in the upper branch. It was concluded that the upper branch could consist of slow variation between the 2S and 2Povortex shedding modes or intermittent switching between the 2Poand 2P modes. The
mode naming follows the convention outlined in Williamson and Roshko.8The 2S mode consists of two single vortices shed per oscillation cycle, the 2P mode consists of two pairs of vortices shed per oscillation cycle, and the 2Pomode consists of two pairs of vortices per oscillation cycle where
the second vortex of each pair is much weaker than the first. A map of the occurrence of these modes produced by Morse and Williamson,7along with results from fully coupled experiments, is
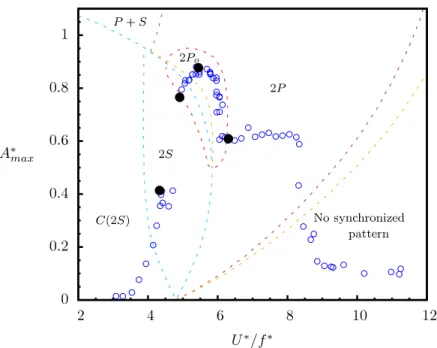
shown in Figure1. The results of the current study augment and extend the conclusions of Morse and Williamson7regarding the interaction of these modes in the upper branch.
A defining feature of low-dimensional chaos is the rapid divergence of trajectories in phase space that initially start close together. For an elastically mounted circular cylinder, it is often useful to consider the system as two coupled oscillators; one is the elastically mounted body, the other is the wake. The body motion is one phase space parameter, and a scalar representing the wake (often the lift force) can be used as another. If low-dimensional chaos is present, small perturbations to one parameter (the body motion) should result in large deviations of the other (the lift force).
In this system, the fluid and the structure are coupled by the fact that the fluid velocity must be equal to the velocity of the cylinder at its surface. The cylinder motion is driven by the fluid forcing on the body, which comes from integrating the pressure and shear stresses of the fluid on the cylinder surface.
The dependence of the lift force on the cylinder velocity ˙y, and therefore the cylinder displace-ment y, means that whether y follows a trajectory governed by the coupled system or is somehow
FIG. 1. Plot of the amplitude response of a freely vibrating circular cylinder with m∗ = 2.66, with an overlay of the
map of the wake regimes by Morse and Williamson.7The open circles represent the maximum amplitude at each normalized
wavelength value of λ∗= U∗/ f∗, where f∗is the normalized frequency close to the natural frequency of the system. The black
solid symbols represent the locations where controlled motion experiments are conducted for comparison. The boundaries between the wake modes of Morse and Williamson7are indicated by the dashed lines.
externally controlled, is unimportant. A particular trajectory y will result in a particular flow and lift force history. However if the flow is chaotic, even infinitesimally small perturbations to this trajectory y will result in large changes in the lift force history.
Here, this relationship is tested explicitly. Free vibration experiments have been conducted and the trajectory y accurately recorded at a sampling frequency of 1000 Hz. Following these, a second set of experiments has been conducted, where the motion recorded during the free vibration experi-ments has been fed back to a highly accurate motion control system, forcing the cylinder to follow the same trajectory as during the free vibration experiments. The results show that generally, the forces recorded during the free vibration and controlled motion experiments are very similar. How-ever, for a case where the cylinder response is in the upper branch, a major deviation is recorded. This deviation is indicative of the presence of chaos, as any error in the y trajectory from the free vibration experiment in the controlled motion experiment results in diverging trajectories.
The experiments were conducted in a free-surface recirculating water channel with a test section of 4000 mm in length, 600 mm in width and, 800 mm in depth.
For the free vibration experiments, a test rigid circular cylinder was vertically mounted on a low-friction air bearing system which was placed on top of the water channel, allowing linear oscillatory movement of the cylinder transverse to the free-stream. Full details of this air bearing setup, control of end conditions, and the facility in general can be found in Nemes et al.9and Zhao
et al.10
The test cylinder used was a carbon fibre tube having an outside diameter of D= 25 mm and a wall thickness of 1.5 mm. The immersed length of the body was L= 620 mm, giving an aspect ratio of L/D= 24.8 and a displaced water mass of md= πD2L/4 = 306.2 g. The total mass of the
oscillating system was m= 813.2 g, resulting in a mass ratio of m∗= m/md= 2.66. Such a low
mass ratio is required for the upper branch to occur.11
Free decay tests were conducted individually in air and quiescent water to measure the natu-ral frequencies of the system, fna= 0.874 Hz in air and fn w= 0.740 Hz in quiescent water. The
(2 k(m + mA)) = 2.74 × 10⁻³, where c is the structural damping coefficient, resulting in a low
mass-damping ratio of m∗ζ = 7.28 × 10⁻³, where m
A= md. The independent parameter of the reduced
velocity was defined as U∗= U/( f
n wD), where U is the freestream velocity. The dynamic response
of free VIV was investigated over a range of 2.5 < U∗< 15 (1450 < Re < 7500).
Shown in Figure1is the amplitude response of the free vibration tests plotted in an amplitude-wavelength plane overlaid on the map of wake regimes from Morse and Williamson7for a cylinder
undergoing sinusoidal forced oscillations. For comparison, the wavelength of free vibration is given by λ∗= U∗/ f∗, where f∗is the normalized predominant oscillation frequency. The classic feature delimiting the upper and lower branches is the high and (relatively) low amplitudes of the oscillation in each branch, and this difference is clearly shown in Figure1.
Four cases were selected for comparison with controlled motion experiments, and they are marked by the black solid symbols on Figure1. These cases were selected to test the response in each of the major response regimes of VIV. One case is on the initial branch (U∗= 4.09), one at the very beginning of the upper branch (U∗= 4.93), one in the middle of the upper branch close to where the maximum amplitude is recorded (U∗= 5.91), and one at the beginning of the lower
branch (U∗= 6.10).
In the controlled motion experiments, a real-time feedback closed-loop motion control sys-tem was employed to drive the test cylinder. This control syssys-tem consisted of a hardware-in-the-loop (HIL) control board (model: Q4, Quanser, Inc., Canada) embedded in a personal computer (PC) desktop, running on a combined software platform of MATLAB R2010a & Simulink and Real-Time Windows Target (MathWorks), and QUARC 2.1 (Quanser, Inc., Canada). The motion plant consisted of a digital servo drive (model: DPRANIE-015A400, Advanced Motion Controls, USA), a brushless DC rotary motor (model: SM231AL-NMSN, Parker Hannifin, USA) with high resolution incremental encoder feedback device (5000 pulses per revolution or 20 000 counts per revolution post quadrature) attached to a linear ball-screw actuator (12.7 mm in lead and 150 mm in stroke, model: ERS50-B02LA20-FSR150-A, Parker Hannifin, USA). The feedback control algo-rithm used was a Proportional-Integral-Derivative (PID) method,12which resulted in motion track-ing errors within ±5 µm (0.0002D). Errors in the velocity and acceleration could be momentarily large (around 30% of the intended instantaneous value), particularly when the actuator changed direction. However, the error in the velocity was typically less than 5% of the intended instan-taneous value, while the error in the acceleration was typically less than 10% of the intended instantaneous value.
Full details of the measurement techniques employed for the cylinder displacement, the trans-verse lift force, and the flow vorticity fields in the near wake of the body can be found in Zhao et al.10
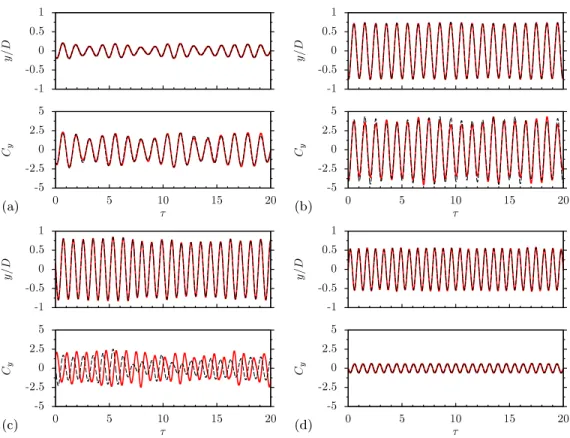
Figure 2 shows time histories of the cylinder trajectory and the lift force for both the free vibration and controlled motion experiments for each of the four test cases. The most pertinent result shown in Figure2is the time history of the lift force for U∗= 5.91. While all the other cases
show a near-perfect match between the force history of the free vibration and controlled motion experiments, this one shows a significant deviation. The magnitude and frequency are similar, how-ever there is a clear difference in the phase of the two signals. This mismatch leads to the conclusion that the flow is chaotic in the middle of the upper branch.
It should also be noted that the case at the beginning of the upper branch (U∗= 4.93) shows no evidence of chaos. In fact, this case oscillates periodically, with a 2S wake mode. This periodic oscillation in the 2S mode in the upper branch is in contrast to the results presented in Govard-han and Williamson2that show a 2Po mode over the entire branch. Morse and Williamson7also
concluded from controlled sinusoidal motion experiments that the 2S mode should only occur in competition with the 2Po mode in the upper branch. It is possible that this stable regime of the
2S mode occurs over a very small range of U∗, or that the fully coupled oscillation departs (even very slightly) from purely sinusoidal, allowing the 2S mode to become stable.
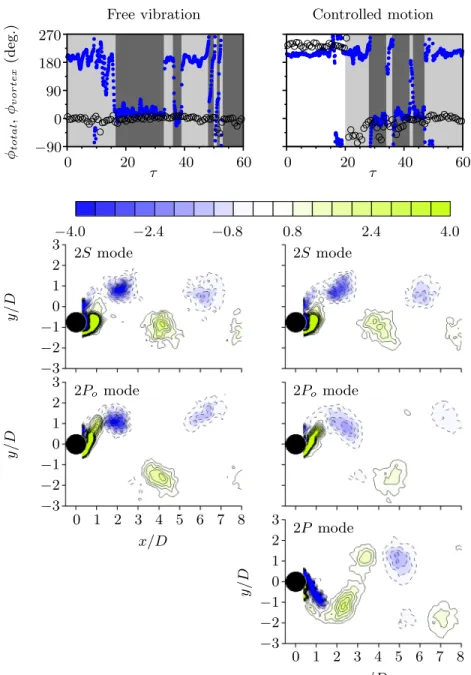
To further investigate the apparent chaos in the middle of the upper branch, Figure3presents portions of the time histories of the total phase φtotaland the vortex phase φvortexfor the free
vibra-tion and controlled movibra-tion experiments for the case in the middle of the upper branch (U∗= 5.93).
FIG. 2. Time histories in terms of periods of oscillation (τ) of cylinder displacement y/D for free vibration (black dashed line) and controlled motion (red solid line) and the lift coefficient Cyfor free vibration (black dashed line) and controlled motion (red solid line), for (a) U∗= 4.09 (initial branch), (b) U∗= 4.93 (beginning of upper branch), (c) U∗= 5.91 (middle of upper branch) and (d) U∗= 6.10 (lower branch). Only the case in the middle of the upper branch (figure (c)) shows a
discrepancy between the lift force of the free vibration and controlled motion experiments.
displacement, whereas the vortex phase φvortexis defined as the phase between the vortex lift force
and the cylinder displacement. The vortex force is defined using the method of Lighthill13and can
be thought of as the force due to vortex shedding. The instantaneous values of φtotaland φvortexwere
found by finding the instantaneous value of phase of the force and displacement signals using a Hilbert transform and subtracting the phase of the force from the phase of the displacement.
Govardhan and Williamson,2Carberry, Sheridan, and Rockwell,14and Morse and Williamson7
have shown that the values of φtotaland φvortexare linked to the wake mode present. The 2S mode
has φtotal≃φvortex≃ 0◦, the 2Po mode has φtotal≃ 0◦ and φvortex≃ 180◦, and the 2P mode has
φtotal≃φvortex≃ 180◦.
Using these definitions, the phase history presented in Figure3shows that the free vibration case in the middle of the upper branch switches between the 2S and 2Powake modes, as suggested
by Morse and Williamson.7However during the controlled motion experiment, the flow switches
between the 2S, 2Po, and 2P wake modes. Phase averaged PIV images of these wake modes are
also presented in Figure3. The PIV images were obtained on a plane z/D= 4.5 from the cylinder free end. Previous results from Hover, Techet, and Triantafyllou4and Hover5have shown that the
wake mode can be different at the same instant at different points along the cylinder. It is possible that this occurred during the current experiments. However, sampling at z/D= 4.5 from the cylin-der end (where a platform technique was used to mitigate the impact of the channel boundary layer) should provide a clear picture of the modes present and the amount of time the flow spends in each mode. The snapshots used to construct each image were selected based on the phase history, e.g., the images for the 2S mode were selected from instants where φtotal≃φvortex≃ 0. The similarities
between the 2S and 2Pomodes from both the free vibration and controlled motion experiments are
FIG. 3. Upper: total phase φtotal(black open circles) and vortex phase φvortex(blue solid circles) for the free vibration and
controlled motion case in the middle of the upper branch (U∗= 5.91). Evidence of switching between two wake modes (2S
and 2Pomodes) is found during free vibration, while evidence of switching between three wake modes (2S, 2Po, and 2P
modes) is found in the corresponding controlled motion experiment. The background of segments of each mode are shaded: 2S (dark grey), 2Po(light grey), 2P (white). Lower panes show images of the wake modes constructed via phase averaging.
The vorticity contour levels shown are normalized by ω∗
z= ωzD/U .
clear. These distinct modes and the apparent sudden switching between them illustrated by the time histories of φtotaland φvortexare evidence of chaos via mode competition. The competition between
these modes for oscillations of the typical amplitude and frequency experienced in the upper branch is consistent with the data from the wake mode map presented by Morse and Williamson7 and
shown in Figure1.
Further evidence of chaos via mode competition is found by looking at the time the flow spends in each mode. The presence of each mode at a given instant can be determined using the relationship between the instantaneous total and vortex phases outlined above. To further simplify, the phases
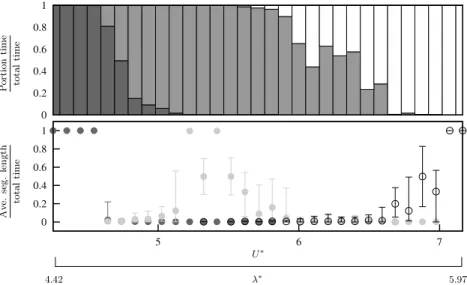
FIG. 4. (a) A histogram of the portion of time spent in each of the modes 2S( ), 2Po( ), and 2P ( ) in the upper branch
during free vibration experiments. The flow moves from a 2S mode, to a mix of 2S and 2Po, to a mix of 2Poand 2P, to
a 2P mode in the lower branch. (b) Mean (marked by points), minimum, and maximum segment lengths (marked by range bars) of the modes 2S( ), 2Po( ), and 2P(◦). For cases in the middle of the upper branch that spend almost all of their time
in the 2Pomode, the flow does not settle to a stable periodic oscillation.
have been binned into two classes, i.e., a phase in the range −90◦< φ ≤ 90◦is treated as φ= 0◦and a phase in the range 90◦< φ ≤ 270◦is treated as φ= 180◦. Each instant can then be classified as belonging to the 2S, 2Po, or 2P mode, as indicated by the shaded regions in the example time series
presented in Figure3.
Figure4presents data from 300s-long segments of time histories for free vibration cases over a range of U∗in the upper branch. Figure4(a)presents a stacked histogram of the time spent in each mode as a fraction of the total length of the 300s segment as a function of U∗. The plot shows that initially the flow is in the 2S mode practically all the time. Increasing U∗sees a regime where the flow switches between the 2S and 2Pomodes, with the proportion of time in the 2Pomode
increas-ing with increasincreas-ing U∗. Around the middle of the upper branch, the flow remains in the 2Pomode
practically all the time. Further increasing U∗sees a regime where the flow switches between the 2Poand 2P modes, with the proportion of time in the 2P mode increasing with increasing U∗. With
the transition to the lower branch, the flow remains permanently in the 2P mode.
Figure4(b)shows the mean, minimum, and maximum segment lengths as a proportion of the total time for each mode as a function of U∗. As expected from Figure4(a), initially the average segment length of the 2S mode is the whole measurement time. At high values of U∗in the lower branch, the average segment length of the 2P mode is practically the whole measurement time. However, in the middle of the upper branch which is dominated by the 2Pomode, the 2Posegment
lengths can still be quite variable, indicated by an average segment length of less than 1 and a significant variation between the minimum and maximum segment lengths. This indicates that the 2Pomode is never seen as a completely stable periodic state.
The overall picture presented by Figure4 is that at the beginning of the upper branch, the dynamics are governed by a competition between the 2S and 2Pomodes. At the end of the upper
branch, the dynamics are governed by a competition between the 2Poand 2P modes. This may go
some way to explaining why all three modes are found in the controlled motion experiment—small deviations from the free vibration trajectory cause the flow to visit some regions of parameter space where there is 2S-2Pocompetition and others where there is 2Po-2P competition.
To conclude, the argument for the appearance of chaos in the middle of the upper branch is summarized. Experiments were performed where the recreated trajectory matched the free vibration trajectory to within ±5 µm (0.0002D). Only for the case in the middle of the upper branch were differences in the force recorded, the large change due to a small perturbation indicative of chaos.
Further evidence for chaos due to mode competition is that in the middle of the upper branch the flow switches between at least two distinct wake modes. Mode competition and switching were implied by Morse and Williamson.7Here, it has been shown there are two competitions in the upper
branch (2S-2Pocompetition at the beginning of the branch and 2Po-2P competition at the end) and
the statistics of this competition presented. Consistent with this finding, it has also been shown that a stable, periodic 2S wake mode exists at the very beginning of the upper branch, which has not been predicted by any previous analysis.
The authors would like to acknowledge the financial support of the Australian Research Coun-cil (ARC) through Grant No. DP110102141 under the Discovery program, and the Centre National de la Recherche Scientifique (CNRS) through Grant No. PICS161793 under the Projet International de Coopération Scientifique.
1A. Khalak and C. H. K. Williamson, “Fluid forces and dynamics of a hydroelastic structure with very low mass and damping,”
J. Fluids Struct.11, 973–982 (1997).
2R. Govardhan and C. H. K. Williamson, “Modes of vortex formation and frequency response of a freely vibrating cylinder,”
J. Fluid Mech.420, 85–130 (2000).
3Y. Modarres-Sadeghi, F. Chasparis, M. S. Triantafyllou, M. Tognarelli, and P. Beynet, “Chaotic response is a generic feature
of vortex-induced vibrations of flexible risers,”J. Sound Vib.330, 2565–2579 (2011).
4F. S. Hover, A. H. Techet, and M. S. Triantafyllou, “Forces on oscillating uniform and tapered cylinders in crossflow,”
J. Fluid Mech.363, 97–114 (1998).
5F. S. Hover, “Three-dimensionality of mode transition in vortex-induced vibrations of a circular cylinder,”Eur. J. Mech.
B/Fluid23, 29–40 (2004).
6D. Lucor, G. Foo, and G. Karniadakis, “Vortex mode selection of a rigid cylinder subject to VIV at low mass-damping,”
J. Fluids Struct.20, 483–503 (2005).
7T. L. Morse and C. H. K. Williamson, “Fluid forcing, wake modes, and transitions for a cylinder undergoing controlled
oscillations,”J. Fluids Struct.25, 697–712 (2009).
8C. H. K. Williamson and A. Roshko, “Vortex formation in the wake of an oscillating cylinder,”J. Fluids Struct.2, 355–381
(1988).
9A. Nemes, J. Zhao, D. Lo Jacono, and J. Sheridan, “The interaction between flow-induced vibration mechanisms of a square
cylinder with varying angles of attack,”J. Fluid Mech.710, 102 (2012).
10J. Zhao, J. Leontini, D. Lo Jacono, and J. Sheridan, “Fluid structure interaction of a square cylinder at different angles of
attack,”J. Fluid Mech.747, 688–721 (2014).
11C. H. K. Williamson and R. Govardhan, “Vortex-induced vibration,”Annu. Rev. Fluid Mech.36, 413–455 (2004). 12A. Callender, D. Hartree, and A. Porter, “Time-lag in a control system,”Philos. Trans. R. Soc. London Ser. A, Math. Phys.
Sci.235, 415 (1936).
13J. Lighthill, “Fundamentals concerning wave loading on offshore structures,”J. Fluid Mech.173, 667–681 (1986). 14J. Carberry, J. Sheridan, and D. Rockwell, “Controlled oscillations of a cylinder: forces and wake modes,”J. Fluid Mech.