This article has been published in a revised form in Canadian
Journal on Aging / La Revue canadienne du vieillissement
http://dx.doi.org/10.1017/S071498081400004X
. This version is
free to view and download for private research and study only.
Not for re-distribution, re-sale or use in derivative works. ©
Cambridge University Press.
Please cite as :
Légaré, Jacques, Yann Décarie, and Alain Bélanger. 2014. "Using
microsimulation to reassess aging trends in Canada." Canadian
Journal on Aging/La Revue canadienne du vieillissement 33
(2):208-219. doi: 10.1017/S071498081400004X.
1
Using microsimulation to reassess aging trends in Canada
Abstract
Although a consensus exists about the future importance of population aging in many countries, discussions about the level and pace of these trends are less unanimous. In
Science (2010), Sanderson and Scherbov suggested improvements to the measure of
elderly dependency ratio. They have identified several limitations to the use of chronological age as the main variable and proposed the use of a new index, the adult disability dependency ratio defined as the number of adults at least 20 years old with disabilities divided by the number of adults at least 20 years old without any, to better measure potential impacts of population aging. They used the Sullivan method, a prevalence based method, by multiplying derived disability rates with macro population projections. They show results for a certain number of ECE and OECD countries; results for Canada, presented in an online Annex, were derived using coefficients of Italy.
However, it has been shown (Carrière et al. 2007; Légaré and Décarie 2011) that disability is a complex multidimensional process and we believe that microsimulation can take into account its implied complexity. In this paper, we present results for Canada that go beyond those presented in the Science article to show how more sophisticated projections of disabled elderly can improve the analysis. We use LifePaths, a microsimulation model developed at Statistics Canada, to provide a new perspective of the phenomena that cannot be obtained when using the prevalence based methods.
Key words: Aging, Canada, Future Trends, LifePaths, Microsimulation, Population Policies
Introduction
Although a consensus exists about the future importance of population aging in many countries, discussions about the level and pace of these trends are less unanimous. For example, Canada’s population of 65 years and over is projected by Statistics Canada to increase from 14 percent in 2010 to 23 percent of the population in 2031 using medium growth scenario (Statistics Canada, 2010). Another way to describe the aging process is to calculate and project the Old Age Dependency Ratio (OADR) by dividing the population 65 years and over by the working age’s population 20-64. When using the same source, this index moves from .22 to .42. In both cases, Canada would face, according to this information, almost a doubling of the aging of its population. For laypeople, that could means doubling the dependency burden, mainly financial, in terms of pensions and health care cost that an ageing population is facing. Should these indices be taken at their face value by policy makers?
2
The Science Study Context
Many observers contest such an alarmist opinion by confronting the real value of such indices based only on chronological ages when used for setting up retirement and health policies for the elderly.
Among others, Sanderson and Scherbov suggested, in Science (2010), improvements to the measure of the aging process. They have identified several limitations to the use of chronological age as the main variable and proposed the use of a new index that take into account changes in disability status over time. That index is the adult disability dependency ratio (ADDR) defined as the number of adults at least 20 years old with disabilities divided by the number of adults at least 20 years old without any disability, to better measure potential impacts of population aging trends. They use the Sullivan method, a prevalence based method, by multiplying derived disability rates with macro population projections.
They have shown results for a certain number of the United Nations Economic Commission for Europe (UNECE) and the Organisation for Economic Co-operation and Development (OECD) countries. The results – both levels and trends - for the 17 countries who have participated in the European Union Statistics on Income and Living Conditions (EU-SILC) survey have been calculated using observed country specific disability prevalence’s and they are no doubt more robust than some shown in previous studies. However, as a limited number of countries have participated in EU-SILC, they have developed indirect methods, using coefficients derived from Italian data to calculate the new index for a larger number of countries as it was the case for Canada, for which the results were presented in an online Annex. The Canadian results were computed by using the ratio between Disability Free Life Expectancy (DFLE) and Life Expectancy (LE) calculated for Italy and applied to LE for Canada but we have to question the methodology. For them, disability rates were computed by applying the ratio between DFLE and LE for Italy to their LE, without any information on the disability level in the specific country. The hypothesis beyond that application implies that the relation between DLFE and LE is unequivocal and universal and that given knowledge of the level of life expectancy, we can deduce the disability level for that country. This hypothesis is not validated by empirical data as shown in Robine (2005) and Robine and Cambois (2013)
Research objectives
The objectives of this research are twofold. First, we validate the findings presented by Sanderson and Scherbov regarding Canada using a microsimulation model and observed Canadian measures of disability. Second, we propose an extension of the ADDR as a new indictor, namely the Elderly disability dependency ratio (EDDR) and suggest that for population aging policy purposes, it is a better indicator.
3
We have shown in previous studies (Carrière et al. 2007; Légaré and Décarie 2011) that disability is a complex multidimensional process and we believe that microsimulation can take into account its implied complexity. In the present study, we use LifePaths, a microsimulation model developed at Statistics Canada and its disability module, based on national data on disability. This allows us to take into account numerous determinants of healthy aging in the calculation of what we believe, when the data are available, is a better index of the potential future impact of Canadian population aging on future health care needs. Taking into account numerous determinants of healthy aging and integrating many explanatory variables that make projections more plausible are great strengths of the microsimulation method.
Methods
The core the methodological issue in the present study is based on the use of microsimulation, an idea developed in the late fifties by Orcutt (1957). Microsimulation models are computer models that contain a representation of individual behaviour. Microsimulation is used to estimate how demographic, behavioural, and policy changes might affect individual outcomes, and to better understand the effects of current policies. Examples of microsimulation range over such topics as urban traffic flow, demographic kinship networks, household waste management, the spread of AIDS, greenhouse gases and climate change, biological pest control, the geographic distribution of air pollution, prehistoric migration between Pacific islands and government tax-transfer systems. The ‘individuals’ represented in these examples are as disparate as car drivers, families, consumers, insects, industrial plants and farms. The common thread running through these examples is that the model can trace the influences of myriad decisions or events. Such models simulate large representative sample populations of individuals in order to draw conclusions that apply to higher levels of aggregation such as an entire country (Statistics Canada 2011).
Microsimulation models are more and more used in social science. During the past 20 years, they have become firmly established as vital tools for analysis of the distributional impact of changes in government programmes (Troitzsch et al., 1996; Gilbert and Troitzsch, 2005) Across Europe, the United States, Canada and Australia, microsimulation models are used extensively to assess who are the winners and losers from proposed policy reforms. Encouraged by the ever-increasing complexity of social and economic programmes, microsimulation models have become an essential part of the policy reform process, allowing identification of the magnitude of gains and losses from policy changes in such areas as taxation, social security, pensions and social services (Zaidi et al., 2009).
4
Microsimulation model are considered as a most valuable tool when three conditions are met (Spielauer, 2009):
1) Individuals are different, differences matter, and there are too many possible
combinations of considered characteristics to split the population into a manageable number of groups
2) Behaviours are complex at the macro level but better understood at the micro level 3) Individual histories matter, i.e. when processes possess memory.
In our research, as we are working on population ageing and particularly on disability, we are in a situation where those three conditions are met and therefore a microsimulation models, like LifePaths, is appropriate.
LifePaths Microsimulation Model
The results in this paper are generated with a Canadian dynamic longitudinal microsimulation model called LifePaths. This model has been developed for several years by Statistics Canada in a programming language named Modgen. The model was used several times for many political matters like aging and inter-generational fairness, retirement system, economic welfare…(Wolfson and Rowe, 2007; Moore et al., 2010; Wolfson, 2011; MacDonald and Moore, 2011).
As described on the web site of Statistics Canada (Statistics Canada, 2011), this model is an overlapping cohort model that produces for each run a representative sample of the Canadian population. The oldest birth cohort represented in LifePaths was born in 1872. That year was chosen so that in the year 1971 the model would have a complete and representative synthetic set of all ages from newborns to the elderly. This means that starting in 1971 LifePaths can produce cross-sectional annual tabulations that can be compared to historical data. The year 1971 is the first year for which high quality socio-demographic micro data were available in the form of a Census with contemporary design.
The life course of an individual, called a case, is simulated in LifePaths as a series of events that occur in continuous time (so they are not artificially restricted to arbitrary time intervals) using behavioural equations estimated from a large number of surveys and from historical micro-data sources. For example, the model uses the National Population Health Survey (NPHS), School Leavers Survey (SLS), Labour Force Survey (LFS), National Graduate Survey (NGS), Family Historical Survey (FHS), General Social Survey (GSS), Census data, Historical Statistics of Canada and many others. During the simulation, LifePaths uses parameters estimated from these data to keep updating its list of pending events to ensure that the next scheduled event is the one that currently has the
5
shortest waiting time. Waiting times provide a unifying framework for representing decision-making and a straightforward way of dealing with competing events. Probabilistic decisions are implemented so that the choice among alternatives is determined by comparing two or more waiting times.
Moreover, a LifePaths simulation consists of a set of mutually independent cases. Each case contains exactly one dominant individual in the first generation. The spouse and children of the dominant individual are simulated as part of the case. They are created, in particular, to satisfy the marriage and the fertility equations1.
Disability module within LifePaths
Disability status was implemented into LifePaths mainly to allow the study of future formal and informal care needs for elderly population (Wolfson and Rowe, 2004; Carrière et al., 2007; Légaré et Décarie, 2011; McDonald et al. 2012; Légaré et al. 2012; ). As described in Spielauer (2007) LifePaths uses its own definition of disability developed specifically for the analysis of future care needs of the elderly population. Four disability states are recognised ranging from no disability to severe disability; transitions between these states are modelled as a set of competing risks. A fifth and terminal state is institutionalization.
Covariates of the hazard models that drive the transitions between disability statuses in LifePaths are age, education, marital status, age at immigration and recent disability history. The Canadian population is not simply aging; it is changing face on several dimensions, many of them affecting disability rates. Canadians are more and more educated and disability rates greatly vary by education level as well in Canada as in United States (Hummer and Hennardez, 2013). Immigrants represent an ever increasing share of Canada’s population and immigrants benefit from the «healthy immigrant’s effect» showing both longer life and more years free of disability and dependency (Chen et al., 1996; Bourbeau, 2002). Finally, marital life is also changing rapidly and people are increasingly leaving alone because of increasing popularity of much more unstable common law unions and increasing divorce rates (Le Bourdais and Lapierre-Adamcyk, 2004).
Transition probabilities from one disability state to another were estimated from different waves of the National Population Health Survey (NPHS), a Statistics Canada longitudinal survey (Wolfson and Rowe, 2004; Rowe, 2005). Disability is defined using some attributes of the Health Utility Index (HUI) which is based on the Comprehensive Health Status Measurements System (CHSMS) that takes into account both the quantitative and
1 For more detailed information on Statistics Canada LifePaths microsimulation model, see Légaré and Décarie (2011), Statistics Canada (2011) .
6
qualitative aspects of health (Torrance et al., 1996). The HUI provides information on the functional health of an individual using a series of attributes. For the purpose of this study, information on an individual’s mobility, dexterity, cognition, and pain and discomfort were used to develop four mutually exclusive disability statuses (none, mild, moderate, and severe):
• No disability • Mild disability:
Mobility problems but do not need any help; Dexterity problems but do not need any help from someone else (may or may not use special equipments); somewhat forgetful and slight difficulty in thinking; Moderate and/or severe pain prevents performing some or few tasks.
• Moderate disability:
Requires wheel chair or mechanical support to walk; Dexterity problem and needs help to perform some tasks; Very forgetful and a lot of difficulty in thinking; Severe pain prevents performing most tasks.
• Severe disability:
Cannot walk or needs help from others to walk; Dexterity problems and needs help for most or all tasks; Unable to remember or think.
Population projections by disability status
To calculate ADDR as proposed by Sanderson and Scherbov, we need to have population projections by age, sex and disability status. In their study, because of the available information on activity limitations in EU-SILC, only individuals not living in nursing homes who had strong limitations were classified as disabled. In the present study in accordance to previous papers where comparisons have been made between Canada and European countries (Légaré and Décarie, 2011), Canadian disabled people – are those having a moderate or a severe disability and living in private households. Through a sensitivity analysis, Sanderson and Scherbov have shown that excluding the institutionalised population from their calculations of ADDR created a very small bias when presenting results for a whole national population.
An extension of the Sanderson and Scherbov proposed index: The Elderly Disability Dependency Ratios (EDDR)
Sanderson and Scherbov recognised that, in policy terms, it is the size of the disabled population that is important, given its implication for service delivery, not the size of the elderly population per se. For the denominator, it is also very important to consider those aged 20 years old and over who are not disabled, as proposed in the new index, since they
7
are those likely to support the disabled population. These are important considerations and we certainly support them. However, to include in the numerator disabled aged 20 to 65 with disabled aged 65 plus is mixing two types of disability, the context of the one for the 65 and over being completely different - mostly of a chronic type - from the one of disabled persons of working ages. We can therefore question the choice made by Sanderson and Scherbov to base their new index for measuring aging trends on the adult population, all disabled people aged twenty years and over. When thinking about the burden of an aging population, most of the time, policy makers have in mind the elderly.
We thus propose to calculate indices related to those 65+, 75+ and for the three age groups: 65-74 , 75-84 and 85+ by putting data for these groups in the numerator, but keeping the 20+ non-disabled population in the denominator. This is the new extension to the ADDR that we propose and accordingly we name it the Elderly Disability Dependency Ratio (EDDR).
Results
The Old age Dependency Ratios (OADR)
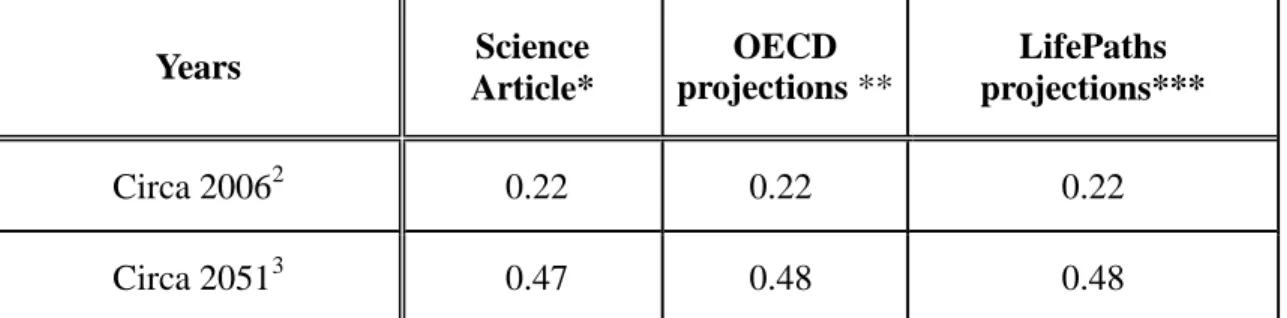
When we compare OADR for Canada from different recent studies (Table 1), we see that all results coincide and show a doubling of this index between now and 2050. That implies that basic data on demographic aging, whether coming from UN data base or OECD’s one or from our own projections, are coherent in terms of age and sex structure of the future Canadian population. This is not surprising, as most of the population aging to be witnessed in the coming decades is embedded in the current age structure of the Canadian population, that is the large cohorts of Baby-Boomers who are now reaching age 65.
Table 1 - Projection of the Old Age Dependency Ratio (OADR) for Canada according to
different sources Years Science Article* OECD projections ** LifePaths projections*** Circa 20062 0.22 0.22 0.22 Circa 20513 0.47 0.48 0.48
Sources: Data from: * Sanderson and Scherbov 2010; **–OECD 2011; *** Current study
2
Science article (2005-2010); OECD projections (2008); LifePaths projections (2006)
3
8
The Adult Disability Dependency Ratios (ADDR)
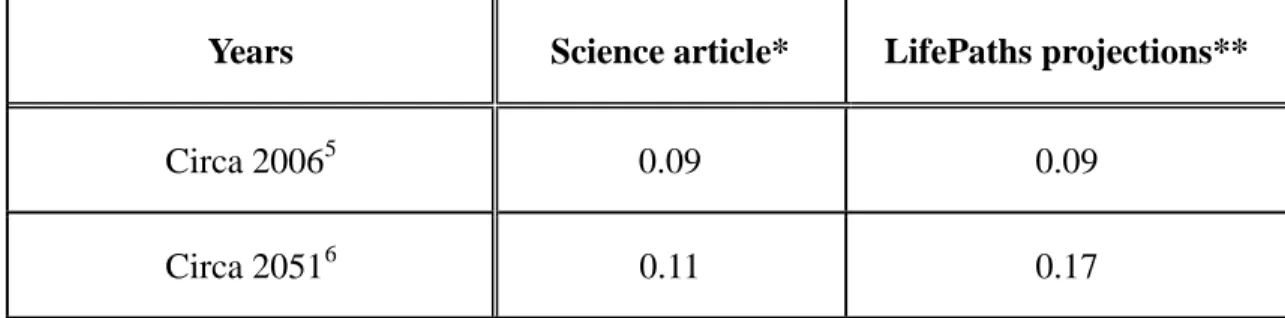
Results from Sanderson and Scherbov (2010) show for ADDR an increase fron 0.09 in 2006 to 0.11 in 2051 while our results goes from 0.09 to 0.17 for the same period (see Table 2 and Annexe 1). Behind the Canadian’s results, LifePaths projected the numbers of adults of at least 20 years old without any disability moving from 22.6 millions in 2006 to 29.0 millions in 2051, while those with moderate and severe disability more than doubles, moving from 2.2 millions to 4.8 millions (Tables in Annexe 2). The differences between the increases rates of those populations are explained by the strong Baby Boom follow also by an important Baby Bust in Canada and the fact the all Baby-Boomers will have reach the age of 85 year old in 2051.
However, large discrepancies appear when we compare our results for ADDR with the ones of Sanderson and Scherbov (Table 2). Not only the trends are very dissimilar, but the level at the end of the projection period is very different. This is explains by the fact that the trend of the Italian ratio between DFLE and LE, as proposed in Science, may not be directly apply to the Canadian situation. Sanderson and Scherbov (2010) were aware that this could happen when they wrote in a footnote to table S1 of the Supplementary Tables – where we find the information for Canada- , that “even though the levels for those countries (not participating in the EU-SILC surveys) should be interpreted with caution”4
. We will comment more deeply on the trend issue in the discussion section.
Table 2 - Projection of the Adult Disability Dependency Ratio (ADDR) for Canada
according to different sources
Years Science article* LifePaths projections**
Circa 20065 0.09 0.09
Circa 20516 0.11 0.17
Sources: Data from: * Sanderson and Scherbov 2010; ** Current study
4
In order to strengthen our results, we performed a sensitivity analysis by calculating ADDR for different definition (levels) of disability, as listed in the previous section. All results go in the same upward direction with important increases of ADDR, except, as expected, when using mild disability. The later results correspond more closely with those of Sanderson and Scherbov that were based on strong limitations.
5
Idem note 2
6
9
The Elderly Disability Dependency Ratios (EDDR)
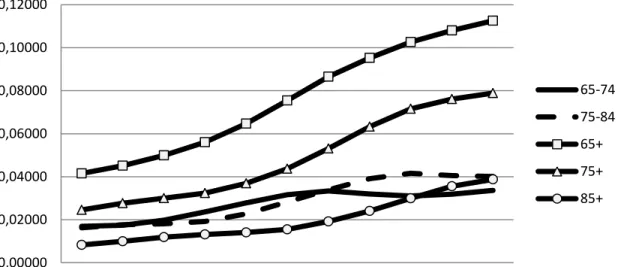
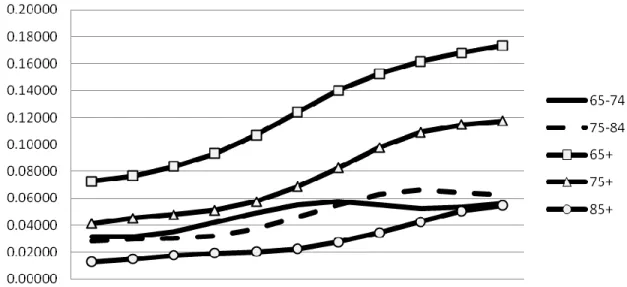
We have calculated EDDR indices related to those 65+, 75+ and for the three age groups: 65-74 , 75-84 and 85 + by putting data on disability for these groups in the numerator, but keeping the 20 + non disabled population in the denominator. By construction, the levels are different; of course, levels vary according to the age groups, but the trends are always similar to what we have found in the previous section, except for the youngest age group, for which the slope is much less upward (Figure1).
Figure 1 - Elderly Disability Dependency Ratios (EDDR) in Canada by level of
disability and age group: moderate and severe disability
EDDR moderate and severe =
disability no over with and old years 20 of adults of number disability severe and moderate with age elderly of number x
Source: Tables in Annexe 2
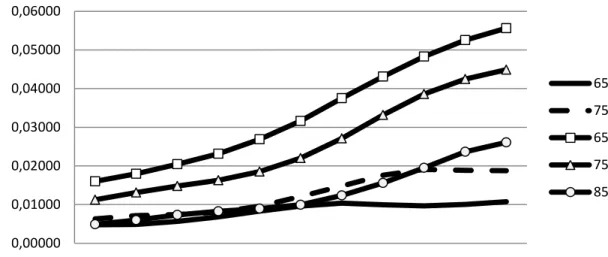
Keeping the denominator always identical to the one suggested by Sanderson and Scherbov, we have also defined different numerators according to disability level: severe disability only and all levels od disability (Figures 2 and 3). Again, levels and trends are similar to what we have found in the previous paragraph.
0,00000 0,02000 0,04000 0,06000 0,08000 0,10000 0,12000 2001 2006 2011 2016 2021 2026 2031 2036 2041 2046 2051 65-74 75-84 65+ 75+ 85+
10
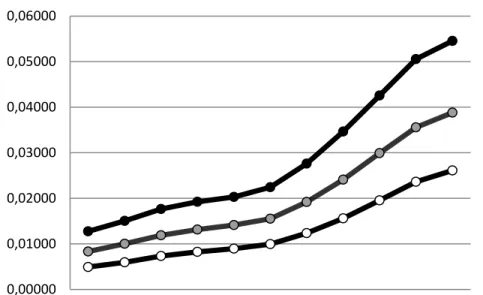
Figure 2 - Elderly Disability Dependency Ratios (EDDR) in Canada by level of
disability and age group: severe disability
EDDR severe = disability no over with and old years 20 of adults of number disability severe with age elderly of number x
Source: Tables in Annexe 2
0,00000 0,01000 0,02000 0,03000 0,04000 0,05000 0,06000 2001 2006 2011 2016 2021 2026 2031 2036 2041 2046 2051 65-74 75-84 65+ 75+ 85+
11
Figure 3 - Elderly Disability Dependency Ratios (EDDR) in Canada by level of
disability and age group: all levels of disability
EDDR all levels of disability =
disability no over with and old years 20 of adults of number disability of levels all with age elderly of number x
Source: Tables in Annexe 2
The impact is even more apparent when we look at the 85 years and over indices, which in 2051 include all the Baby Boomers (Figure 4). For those with moderate and severe disability, the numbers of elderly in that situation would go from around 225 000 in 2006 to 1 125 000 in 2051 (Tables in Annex). Readers should be reminded that these crude numbers are a minimum, as people in institutions are not included in the projections; many elderly 85 + will be living in institutions with moderate and severe disability.
12
Figure 4 - Elderly Disability Dependency Ratios (EDDR) for the 85+ in Canada, by level
of disability
Source: Tables in Annexe 2
Discussion
The article by Sanderson and Scherbov in Science was worldwide acclaimed in the media, both general and specialized. The idea to present a simple aging index that goes beyond the chronological age and that is taking into account disability was very welcome by specialists and policy makers. Moreover, the results for most industrialized countries in the study were similar and show no important upward trends. Apocalyptic demographics could be put aside: the aging societies’ burden becomes something that was a 20th Century myth and policy makers could take things easy.
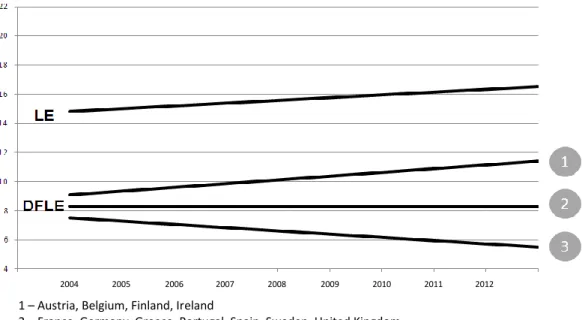
While using a better defined index is valuable, applying the Italian ratio of DLFE over LE to other countries could be very misleading as this ratio is not unequivocal and universal as first shown by Robine (2005). A recent study by Robine and Cambois (2013) confirms the previous results. This point is illustrated in Figures 5 and Figures 6 for the 14 countries under study, mainly the ones of the EU-SILC survey.
Even if LE at age 65 was increasing for all countries for both men and women, trends for DFLE were very diverse, some are increasing, other are decreasing and in many occasions contradictory trends for men and women of the same country were observed. Without any national data on disability and institutionalization, we can then question the results published in Science for Non-European countries, where the health system and environment are very different from that of the European countries. Of course, the method suggested by Sanderson and Scherbov may be considered as a “best guess” when
0,00000 0,01000 0,02000 0,03000 0,04000 0,05000 0,06000 2001 2006 2011 2016 2021 2026 2031 2036 2041 2046 2051 Severe 85+ Poor health 85+ Disabled 85+
Moderate and severe 85 + All levels of disability 85 +
13
national data are not available. However, the approach should also include scenarios where the ratio would not be constant for the whole projection period for countries where we do not have evidence that the trends of DFLE and LE are similar to the Italian one proposed as a standard in the Science study..
Figure 5 - Life expanctancy (LE) and disability free life expanctancy (DFLE), men, 65
years and over, selected European countries
Source: Data from European Health Expectancy Monitoring Unit (2009)
2004 2005 2006 2007 2008 2009 2010 2011 2012
1 – Austria, Belgium, Finland, Ireland
2 – France, Germany, Greece, Portugal, Spain, Sweden, United Kingdom 3 – Denmark, Italy, Netherlands
14
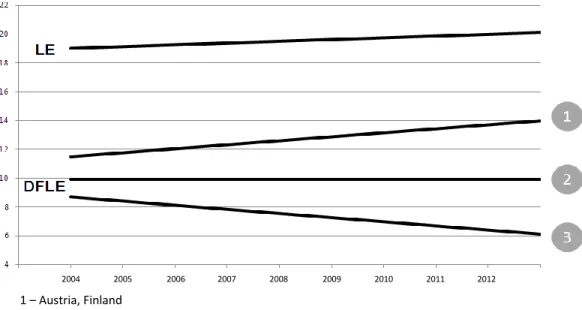
Figure 6 - Life expectancy (LE) and disability free life expectancy (DFLE), women, 65
years and over, selected European countries
Source: Data from European Health Expectancy Monitoring Unit (2009)
Because aging is a complex multidimensional process, microsimulation models are valuable tools for the study of population aging and disability. They allow for more theoretically sound projections of disability by taking into account several determinants of the disability process beyond age and sex. Until recently, because access to micro data and PCs’ computational power and storage were limited, it was difficult to put in place complex microsimulation models. With the increasing availability of micro data and the increasing computational power and storage capacity of PCs, microsimulation has gained popularity in the social sciences in the last decade. Although it is still more onerous in time and effort to develop a microsimulation model compare to using derived disability projections from the simple cohort-component model, the development of new software, such as Modgen, is certainly helping in reducing this gap.
2004 2005 2006 2007 2008 2009 2010 2011 2012
1 – Austria, Finland
2 – Belgium, France, Germany, Netherlands, Ireland, Portugal, Spain, Sweden, United Kingdom 3 – Denmark, Greece, Italy
15
Conclusion
The Science article allows the authors to compare the aging trends for countries all around the world. But as we have shown in this paper with the Canadian case, the method used could give different and perhaps misleading information about aging levels and trends for countries who have not participated in the EU-SILC survey, when we compare with national data. The ADDR and EDDR results that we have presented for Canada with their important upward trends show a different picture than the one available in the annex of the Science article and this for two reasons. First they are built using observed national information on disability and second, microsimulation integrates many explanatory variables that make projections more plausible. Of course, comparisons between Canada and other countries may then be more difficult, but for Canadian policy makers these results should be taken into account to make efficient elderly programs that will
16
References
Bourbeau, R. (2002). L’effet de la “sélection d’immigrants en bonne santé” sur la
mortalité canadienne aux grands âges, Cahiers québécois de démographie, 31(2), 249-274
Carrière Y., Keefe J., Légaré J., Lin X. and Rowe G. (2007) Population aging and immediate family composition: Implications for future home care services, GENUS,
63(1-2), 11-31
Chen, J., Ng, E. and Wilkins, R. (1996). The Health of Canada's Immigrants in 1994-95. Health Reports, Vol 7 (4): 33-45
European Health Expectancy Monitoring Unit (2009). Data on Activity Limitations from Statistics on Income and Living Conditions (SILC) Survey, http://www.ehemu.eu/
Gilbert, N. G. and Troitzsch, K. G. (2005), Simulation for the Social Scientist, McGraw-Hill International
Hummer, R. A. and Hernandez, E. M. (2013). The Effect of Educational Attainment on Adult Mortality in the United States, Population Reference Bureau, 68(1), 1-20
Le Bourdais, C. and Lapierre-Adamcyk, E. (2004). Changes in conjugal life in Canada : Is Cohabitation Progresseively Replacing Marriage? Journal of Marriage and Family Vol 66 (4) : 929-942.
Légaré, J. & Décarie, Y. (2011). Using Statistics Canada LifePaths Microsimulation Model to project the health status of Canadian elderly. The International Journal of Microsimulation, 48-56
Légaré, J., Keefe, J., Vézina, S., & Décarie, Y. (2012). Future care needs of older Canadians needing assistance: Who will do how much and for whom? Final Report: Project 2. Prepared for Human Resources and Skills Development Canada, contract no. 9755-09-0017/02.
MacDonald, B-J. and Moore, K. (2011), Moving Beyond the Limitations of Traditional Replacement Rates, Society of Actuaries.
http://www.soa.org/research/research-projects/pension/default.aspx
MacDonald, B-J., Keefe, Spin, P., Vézina, S., and Décarie, Y. (2012). Assessing gaps in receipt of needed support: Who will go without? Final Report: Project 3. Prepared for Human Resources and Skills Development Canada, contract no. 9755-09-0017/02.
Moore, K., Robson, W. and Laurin, A (2010), Canada’s Looming Retirement Challenge: Will Future Retirees Be Able to Maintain Their Living Standards Upon Retirement?, C.D. Howe Institute Commentary No. 317.
17
Orcutt, G. (1957), A new type of socio-economic system’, Review of Economics and Statistics, 39(2), 116-123. Reprint in International Journal of Microsimulation (2007) 1(1), 3-9
Organisation for Economic Co-operation and Development (OECD) (2011). Society at a Glance 2011, OECD Social Indicators, (www.oecd.org/els/social/indicators/SAG) (2008, 2050)
Robine, J.-M., (2005) Are we living longer and in better health ?, paper presented at the conference AGIR : Aging, health and retirement in Europe, Brussels, March 10th
Robine, J.-M., and Cambois, E. (2013), Les espérances de vie en bonne santé des européens. Population et Sociétés 499:1-4
Rowe G. (2005) Analysing health status transitions using NPHS longitudinal data, Ottawa, SEAMD, Statistics Canada
Sanderson, W.C. and Scherbov, S. (2010), Remeasuring aging Science, 329(597),1287-1288
Spielauer, M. (2007),Dynamic Microsimulation of Health Care Demand, Health Care Finance and the Economic Impact of Health Behaviours: Survey and Review, International Journal of Microsimulation 1(1) 35-53
Spielauer, M. (2009), What is Dynamic Social Science Microsimulation? - Statistics Canada, Modeling Division, http://www.statcan.gc.ca/microsimulation/pdf/chap1-eng.pdf
Statistics Canada (2011) “The LifePaths Microsimulation Model: An Overview”, Retrieved September 15 2011 from
http://www.statcan.gc.ca/microsimulation/pdf/lifepaths-overview-vuedensemble-eng.pdf
Statistics Canada. (2010) Population Projections for Canada, Provinces and Territories: 2009-2036, (Catalogue No. 91-520-X), Retrieved February 18, 2011, from
http://www.statcan.gc.ca/pub/91-520-x/91-520-x2010001-eng.pdf
Sullivan D.F. (1971), A Single Index of Mortality and Morbidity. HSMHA Health Report, 86:347-354
Torrance G. W., Feeny D. H., Furlong W. J., Barr R. D., Zhang Y. and Wang Q. (1996) Multiattribuable utility function for a comprehensive Health Status Classification System, Health Utilities Index Mark 2, Medical Care, 34, 702-722
18
Troitzsch, K. G., Mueller, U., Gilbert N. G. and Jim E. Doran (1996), Social Science Microsimulation Berlin: Springer-Verlag
United Nations, Department of Economic and Social Affairs, Population Division (2009), Word Population Propects: The 2008 revision, CD-ROM Edition.
Wolfson M. and Rowe G. (2004) Disability and informal support: Prospects for Canada in Cohen S. B. and J. M. Lepkowski (Eds.), Eight Conference on Health Survey Research Methods, Hyattsville, MD: National Center for Health Statistics, 15-22
Wolfson, M. and Rowe, G. (2007), Aging and Inter-Generational Fairness: A Canadian Analysis, in Peter J. Lambert (ed.) Equity (Research on Economic Inequality, Volume 15), Emerald Group Publishing Limited, pp.197-231
Wolfson, M. (2011), Projecting the Adequacy of Canadians' Retirement Incomes: Current Prospects and Possible Reform Options, IRPP Study 17. Montreal: Institute for Research on Public Policy
Zaidi, A, Harding, A. and Williamson, P. (2009) New Frontiers in Microsimulation Modelling, International microsimulation association. Inaugural meeting (2007 : Vienna, Austria), Farnham : Ashgate
19
Annexe
This annexe presents the methodology used to calculate the ratio between the Disability Free Life Expectancy (DFLE) and the unconditional Life Expectancy (LE) in Sanderson and Scherbov (2010) and in this research. It also compares the results from both methodologies.
Sanderson and Sherbov method
In the online annexe of Sanderson and Scherbov (2010), the authors present the Canadian results computed by using the ratio between Disability Free Life Expectancy (DFLE) and the unconditional Life Expectancy (LE) calculated for Italy and applied to the Canadian LE as projected by the United Nations (UN). The DFLE was forecast in two steps.
First they estimated the ratio between the DFLE and the LE by age and sex for the 17 countries who participated in the EU-SILC survey. Let
c s a df c s a c s a
e
e
r
, , , , , ,
where: c s ar,, is the ratio between DFLE and LE by age, sex and country; df
c s a
e ,, is the DFLE by age, sex and country; c
s a
e ,, is the LE by age, sex and country.
The ratio (ra,s,c) is the fraction of person-years lived from age a onward that are free
from disability. Both life expectancies were calculated by the European Health Expectancy Monitoring Unit (2009). The authors specified that the LE in the denominators are extremely close to the LE provided by the UN for the same time period (2005 to 2007).
20
Using ordinary least squares, Sanderson and Scherbov estimated a simple linear specification that makes the ra,s,c a function of age, sex and country-specific dummy
variables. Let
17 2 17 2 , , 2 2 1 0 1 ,, , ,ln
c c c s a f c c f r rD
D
D
D
a
c s a c s a
where i i:
0,1,2
, and are the set of parameters to be estimated; fD is a dummy variable for female;
c
D are country-specific dummy variables;
c s a ,,
is an independently and normally distributed random error term.
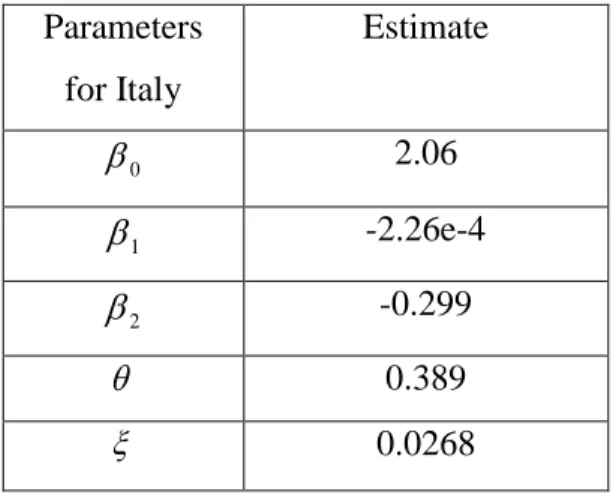
In the last equation, the authors used data for 5-years intervals from age 30 to 85+, for 17 countries7, from 2005 to 2007, for a total of 1 200 observations. The estimated parameters for Italy are shown in Table 1.
7
Austria, Belgium, Czech Republic, Finland, France, Germany, Greece, Hungary, Ireland, Italy, Luxembourg, Netherland, Portugal, Slovakia, Spain, Sweden, United Kingdom
21
Table 1: Estimated parameters for Italy
Parameters for Italy Estimate 0 2.06 1 -2.26e-4 2 -0.299 0.389 0.0268
The second step of the Sanderson and Sherbov method is to apply the ratio (ra,s,c) calculated in the first step to the UN forecasted LE by age, sex and country for 5 years periods from 2005-2010 to 2045-2050 (United Nation, 2009). Let
c s a UN y c s a df y c s a
e
r
e
, , , , , , , ,~
where: df y c s ae
, , ,~
is the estimated forecasted DFLE by age and sex for a given country
c and a given time period y; UN
y c s a
e
, , , is the UN forecasted LE by age and sex for a given country c and a22
Methodology of this research
In this paper, DFLE for Canada are computed using the disability prevalence projected by the longitudinal module of LifePaths and the application of the Sullivan method (Sullivan, 1971) to the life table also generated by the microsimulation model. Sullivan's method is a simple method to compute health expectancies; it has been used and discussed by many authors. It combines data issued from a period life table on the one hand and from prevalence of a given health dimension, in our case disability, on the other hand. The age-specific prevalence is directly applied to the person-years of the life table: it provides the total number of years spent with disability, the total number years lived without disability, and summing both, the total number of years lived.
The data that we used to calculate the DFLE are the mortality rates by age, sex and year of projection and the prevalence to be disabled (with moderate and severe disability) also by age, sex and year of projection. Those data are coming from a run of 6 000 000 cases of the LifePaths microsimulation model. Let
y s a a i y s i y s i df y s a
l
L
E
, , , , , , , ,
where: df y s aE
, , is the forecasted DFLE for Canada by age and sex for a given year y;y s a
L ,, is the life table number of person-years lived by age and sex for a given
year; y s a ,,
is the prevalence of disability by age and sex for a given year; y
s a
l , , is the life table number of surviving persons by age and sex for a given
year;
is the maximum age of that a person can reach the life table.
To compare our results with those of Sanderson and Scherbov (2010), we also calculated the ratio between DFLE and LE for Canada (Ra,s,y
)
. Let23
y s a df y s a y s aE
E
R
, , , , , ,
where: y s aE , , is the forecasted LE for Canada by age and sex for a given yeary.
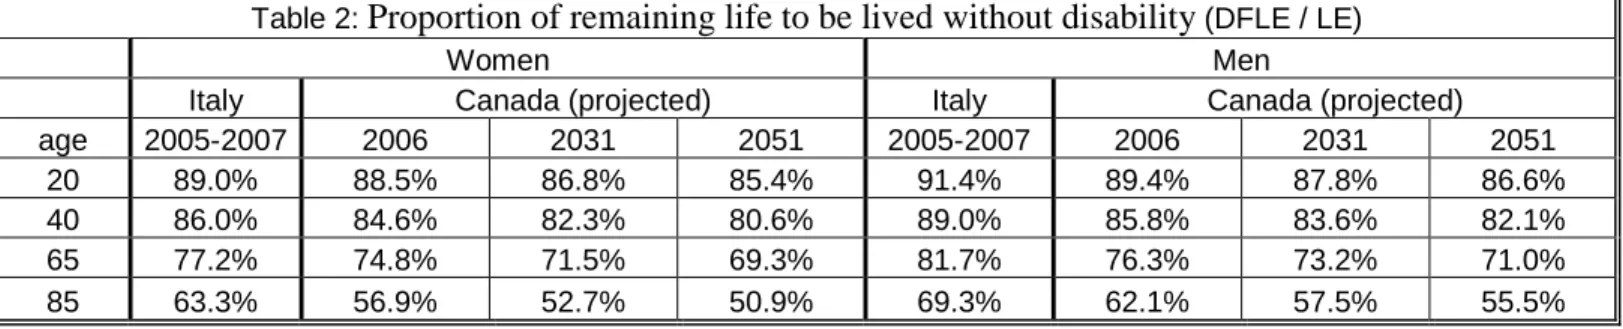
Table 2 shows the comparison of the ratios between DFLE and LE for Canada and Italy. This ratio represents the proportion of remaining life to be lived without disability. As the ADDR for Canada from the Science article and our calculations are equal (0.09), the 2006 ratios are similar, as expected, for both men and women. However, this is not the case when we compare the ADDR at the end of the projected period (0.11 versus 0.17). The discrepancy can by explain by the fact that the ratio between DFLE and LE is not kept constant for all the projection period in LifePaths like in the Science article. We can see, in Table 2, that the differences increase with time and with age. As the disability parameters in LifePaths are kept constants, the changes in the DFLE to LE ratios are due to changes in the population composition resulting from the dynamic microsimulation model. The increasing discrepancy over time is exacerbated by the fact that the differences are increasing not only over time, but also with age. The increasing number of survivors at older ages increases the weight of age groups where differences between the static and inappropriate Italian ratio differ the most with the projected Canadian numbers.
Table 2: Proportion of remaining life to be lived without disability (DFLE / LE)
Women Men
Italy Canada (projected) Italy Canada (projected)
age 2005-2007 2006 2031 2051 2005-2007 2006 2031 2051
20 89.0% 88.5% 86.8% 85.4% 91.4% 89.4% 87.8% 86.6%
40 86.0% 84.6% 82.3% 80.6% 89.0% 85.8% 83.6% 82.1%
65 77.2% 74.8% 71.5% 69.3% 81.7% 76.3% 73.2% 71.0%
85 63.3% 56.9% 52.7% 50.9% 69.3% 62.1% 57.5% 55.5%
Therefore, differential in population growth rates by age, sex and disability status as projected by LifePaths explains the discrepancies observed between the ADDR
24
calculated by Sanderson and Scherbov (2010) using a constant and inappropriate DFLE to LE ratio and the ADDR presented in this paper.
Our goal is to show that, applying disability data from a given country to another can produce results that should be interpreted with caution by policy makers. Nevertheless, the projection of the disability status over a time period of about 40 years also includes several assumptions and limits.
25
Annexe 2
8 Years Age groups 2001 2006 2011 2016 2021 2026 2031 2036 2041 2046 2051 20+ 23 204 249 24 838 142 26 430 243 27 922 259 29 148 437 30 269 147 31 282 636 32 169 885 32 889 757 33 443 285 33 838 120 65+ 3 995 436 4 398 342 5 019 015 5 905 627 7 000 182 8 245 763 9 276 466 9 890 946 10 310 438 10 649 646 10 985 070 75+ 1 827 425 2 087 074 2 284 328 2 517 028 2 951 907 3 601 658 4 380 497 5 207 568 5 776 276 5 998 926 6 105 729 85+ 449 646 557 615 681 590 772 460 836 301 947 782 1 186 519 1 502 813 1 854 062 2 211 044 2 383 348 20+dis 4 103 258 4 544 370 5 008 940 5 489 508 5 973 080 6 487 946 7 018 991 7 518 728 7 909 811 8 211 022 8 427 660 65+ dis 1 542 494 1 738 747 2 003 263 2 348 335 2 785 238 3 326 867 3 854 173 4 283 325 4 604 565 4 845 801 5 039 200 75+ dis 875 982 1 023 359 1 152 188 1 286 809 1 502 934 1 841 420 2 269 930 2 742 552 3 108 133 3 304 079 3 407 626 85+ dis 271 178 340 646 423 217 484 023 529 028 602 515 760 073 973 057 1 213 243 1 456 679 1 584 794 20+ poor health 1 937 690 2 190 340 2 462 822 2 753 658 3 070 390 3 405 768 3 765 869 4 100 895 4 391 740 4 620 904 4 791 278 65+ poor health 884 076 1 022 783 1 195 718 1 410 476 1 687 656 2 025 565 2 379 656 2 672 531 2 924 267 3 112 301 3 268 980 75+ poor health 523 584 627 502 720 165 814 321 962 206 1 175 381 1 460 818 1 775 316 2 039 313 2 193 811 2 290 778 85+ poor health 176 607 227 024 284 983 330 641 368 293 416 721 528 127 676 867 852 593 1 024 839 1 126 692 20+ sev 672 510 769 958 876 068 983 777 1 111 983 1 261 426 1 442 894 1 631 559 1 807 643 1 954 633 2 058 447 65+ sev 340 038 407 326 490 103 582 269 700 688 849 680 1 032 205 1 210 072 1 376 152 1 513 762 1 615 469 75+ sev 238 916 296 945 354 308 410 037 483 492 591 856 746 722 931 124 1 100 167 1 224 331 1 303 385 85+ sev 104 894 135 201 175 856 207 676 233 480 266 698 339 911 437 530 556 638 681 420 758 282Table 1 – Population projection for Canada
Source : LifePaths – current study
8