HAL Id: tel-02878530
https://pastel.archives-ouvertes.fr/tel-02878530
Submitted on 23 Jun 2020HAL is a multi-disciplinary open access archive for the deposit and dissemination of sci-entific research documents, whether they are pub-lished or not. The documents may come from teaching and research institutions in France or abroad, or from public or private research centers.
L’archive ouverte pluridisciplinaire HAL, est destinée au dépôt et à la diffusion de documents scientifiques de niveau recherche, publiés ou non, émanant des établissements d’enseignement et de recherche français ou étrangers, des laboratoires publics ou privés.
condition in a serial multistage manufacturing system
under uncertainty
Mohammad Rezaeimalek
To cite this version:
Mohammad Rezaeimalek. Inspection planning based on preventive maintenance condition in a serial multistage manufacturing system under uncertainty. Other [cs.OH]. Ecole nationale supérieure d’arts et métiers - ENSAM; University of Teheran, 2019. English. �NNT : 2019ENAM0007�. �tel-02878530�
Arts et Métiers ParisTech - Centre de Metz Laboratoire de Conception, Fabrication Commande Université de Téhéran- Département Génie Industriel
2019-ENAM-0007
École doctorale n° 432 : Science des Métiers de l’ingénieur
présentée et soutenue publiquement par
Mohammad REZAEIMALEK
le 11 mars 2019
Inspection planning based on preventive maintenance condition
in a serial multi-stage manufacturing system under uncertainty
Doctorat ParisTech
T H È S E
pour obtenir le grade de docteur délivré par
l’École Nationale Supérieure d'Arts et Métiers
Spécialité “ Génie Industriel ”
Co-Directeurs de thèse : Ali SIADAT et Reza TAVAKKOLI-MOGHADDAM (co-tutelle ENSAM/Univ. Of Tehran) Co-encadrement de la thèse : Jean-Yves DANTAN
T
H
È
S
E
JuryM. Farouk YALAOUI, Professeur, Université de Technologie de Troyes, Troyes Rapporteur
M. Armand BABOLI, Maitre de Conférences HDR, INSA-Lyon, Villeurbanne Rapporteur
M. Seyed Taghi AKHAVAN NIAKI, Professeur, Université de Technologie Sharif, Téhéran Rapporteur
M. Alexandre DOLGUI, Professeur, Ecole des Mines de Nantes, La Chatrerie Examinateur
M. Abdollah AGHAEI, Professeur, Université de technologie de K.N. Toosi, Téhéran Examinateur
M. Ali SIADAT, Professeur, Arts et Métiers ParisTech, Metz Examinateur
M. Jean-Yves DANTAN, Professeur, Arts et Métiers ParisTech, Metz Examinateur
M. Reza TAVAKKOLI-MOGHADDAM, Professeur, Université de Téhéran, Téhéran Examinateur
ii
Acknowledgement
I first wish to express my sincere gratitude to my supervisors Prof. Ali
SIADAT, Professor Jean-Yves DANTAN and Prof. Reza
TAVAKKOLI-MOGHADDAM who have provided me with guidance and support throughout
my doctoral studies. They not only guided my research and provided technical
support, but also served as teaching mentors and professional models.
I want to thank all faculties and staff members of LCFC laboratory for their
constant academic interactions with me. I would like to thank all other people
who have supported me, though I have not mentioned their names here.
Please accept my sincere apologies and thank you very much to all of you.
Finally, I have to owe the greatest debt to my family: their support and care
are always a substantial source of inspiration.
iv
Acknowledgement ...
iiChapter 1: Introduction
1.0. Chapter purpose and outline ……… 21.1. Introduction ………... 2
1.2. PQIP problem ………... 4
1.3. The relation of PQIP with maintenance and production issues ... 5
1.4. Conclusion ………..………....……… 8
Chapter 2: Literature review
2.0. Chapter purpose and outline ……… 112.1. Introduction ………... 11 2.2. MMS characteristics ………...……… 12 2.2.1. Production structure ……… 13 2.2.2. Production/inspection flow ... 13 2.2.3. Inspection strategy ………..……… 14 2.2.4. Inspection errors ... 14
2.2.5. Failure rate and type ... 14
2.2.6. Nonconforming strategy ... 15
2.3. Methodology characteristics ... 21
2.3.1. Objective functions ... 21
2.3.2. Constraints ... 22
2.3.3. Optimization under uncertainty ... 23
2.3.4. Solution approaches ... 24
2.4. Integrated optimization ………...……… 31
2.5. Conclusion ... 32
Chapter 3: Mathematical formulation
3.0. Chapter purpose and outline ... 353.1. Main problem description ... 35
3.1.1. Assumptions ………...……… 36
3.1.2. Indices ………...……… 37
3.1.3. Parameters ………...……… 37
3.1.4. Variables ………...……… 37
3.1.5. Mixed-Integer Linear Mathematical Programming Model ... 38
3.2. Extended problem description ... 43
3.2.1. Assumptions ………... 45
3.2.2. Indices ………... 45
3.2.3 Parameters ………... 45
3.2.4. Variables ………... 46
3.2.5. Bi-Objective, Mixed-Integer, and Non-Linear Mathematical Model ... 46
v
Chapter 4: Methodology
4.0. Chapter purpose and outline ……… 51
4.1. Stage 1: Piecewise linear approximation ... 52
4.2. Stage 2: Robust possibilistic programming model ... 54
4.3. Stage 3: Single objective counterpart model ... 57
4.4. Conclusion ... 58
Chapter 5: Experimental Results
5.0. Chapter purpose and outline ……… 615.1. Numerical example ………...……… 61 5.1.1. Main model ………...……… 62 5.1.2. Extended model ………...……… 65 5.2. Case study ………...……… 69 5.2.1. Main model ………...……… 71 5.2.2. Extended model ………... 74 5.3. Conclusion ………...………...……… 82
Chapter 6: Conclusion and Future Research Direction
6.0. Chapter purpose and outline ……… 856.1. Conclusion ………... 85
6.1.1. Main model ………...…… 85
6.1.2. Extended model ………...……… 85
6.2. Future research directions ………...… 86
6.2.1. MMS characteristics ………..………… 87
6.2.2. Methodology characteristics ... 87
List of the publications related to this thesis
………... 89vii
Table 1.1 Production quality paradigm; A planning matrix ……….. 7
Table 2.1 Literature classification based on the MMS characteristics ……… 16
Table 2.2. Literature classification based on the methodology ………... 26
Table 3.1. Introduction of new variables and constraints for the
linearization purpose
………. 43
Table 5.1. Production parameters of the 3-stage assembly line ………. 62
Table 5.2. The inspection (I) activities done in the SMSPL while applying
the Without PM approach
………... 64
Table 5.3. The maintenance (M) and inspection (I) activities done in the
SMSPL while applying the With PM Possibility approach
………... 64
Table 5.4. Data of the test problem ……….….. 67
Table 5.5. The PM (M) and inspection (I) activities done in the S3SMS
considering different objectives
………. 67
Table 5.6. The performance of the proposed models under realizations ………….. 69
Table 5.7. The obtained pareto solution while considering different
numbers of segments
……… 70
Table 5.8. Production parameters of the oil pump housing ……….. 72
Table 5.9. Defective production rate regarding the number of passed
periods since the last performed PM
……… 73 Table 5.10. Places and periods in which inspection (I) and preventive
maintenance (M) activities are performed by applying the Separate Planning approach
……… 74
Table 5.11. Places and periods in which inspection (I) and preventive maintenance (M) activities are performed by applying the Integrated Planning approach (Main Model)
……… 74
Table 5.12. Imprecise parameters of the case study ………. 75
Table 5.13. The performance of the proposed models under realizations ………….. 76 Table 5.14. Places and periods in which inspection (I) and preventive
maintenance (M) activities are performed by applying the Extended Model
……… 76
Table 5.15. Impact of on the expected total cost, worst-case cost, and confidence level
………. 77 Table 5.16. Performance of the Extended Model while considering
different values for δ
………... 78 Table 5.17. Pareto optimal solutions for the case study ………... 81 Table 5.18. Third Pareto optimal solution: Places and periods in which
inspection (I) and preventive maintenance (M) activities are performed
vi
Figure 1.1 PQIP problem in an MMS in period t ………. 5
Figure 1.2 Relation of production, maintenance, and quality ……… 6
Figure 1.3
Three different parties of the production quality paradigm and the position of traditional and new PQIP problems in this framework
……… 9
Figure 2.1 Percentage of the published research works in the most
famous journals
……… 12
Figure 2.2. Number of published papers in different periods ……… 12
Figure 2.3. Percentage of papers which considered different
assumptions
……… 20
Figure 2.4. Percentage of papers considered different methodology
characteristics
……… 30
Figure 3.1. Impact of the PM on the value of ε ……….. 36
Figure 3.2. Schematic plan of the considered problem in the sample
period t
……… 36
Figure 3.3. Shape of the utility function for the fraction of the produced
conforming products
……….. 44
Figure 4.1. Flowchart of the proposed 3-stage approach ……… 51
Figure 4.2. Piecewise linear approximation of f(o) ………. 52
Figure 4.3. Trapezoidal possibility distribution of fuzzy parameter …………... 55
Figure 5.1. Cost components of the adopted approaches ……….. 63
Figure 5.2. Objective function value by considering different values for
the cost of a PM
………… 65
Figure 5.3. Objective function values by considering different values for
the unit inspection cost
………… 65
Figure 5.4. Pareto curve ……….. 67
Figure 5.5. Pareto carve while applying different numbers of segments ………… 69
Figure 5.6. Solid frame of the oil pump housing ………. 70
Figure 5.7. QCs of the oil pump housing ……… 71
Figure 5.8. Cost components of the case study ……….……… 73
Figure 5.9. Sensitivity of the total cost objective function on the α (a),
β (b), ε (c), and ε0 (d) parameter
…………... 80
Chapter 1
2
1.0. Chapter purpose and outline
In this chapter, first, the necessity of producing high-quality products is regarded and part quality inspection is introduced as a significant tool for this aim. (please see Section 1.1). Then, the part quality inspection planning problem in multi-stage manufacturing system is elaborated in Section 1.2. Section 1.3 justifies the importance of handling the part quality inspection planning problem regarding the maintenance and production issues. Finally, Section 1.4concludes this chapter and determines the position of this research in the framework of production quality paradigm.
1.1. Introduction
The paramount significance of the Total Quality Management has been quite understood by all the industries over the recent decades. Indeed, manufacturing companies need to reach a high level of quality in their services or products to maintain their profitability and global competitiveness. To this end, they are employing a wide range of tools to boost the quality in the manufacturing process. Some of the essential tools are Statistical Process Control (SPC), Six Sigma (6σ), process improvement and inspection (Montgomery, 2009).
Sloppy design of products, inefficient manufacturing methods, tools and machine malfunction and low quality of raw materials are some of the reasons which cause quality problems in manufacturing systems. Hence, performing an appropriate quality control program can lead system to reach a high level of quality for products in the presence of these destructive reasons. Indeed, different research directions have been followed to achieve a high level of quality for products in manufacturing systems: quality in; management, service, manufacturing, and design (Mohammadi et al., 2015). In this thesis, concentration is on a certain tool for attaining high quality in manufacturing, namely inspection.
Inspection is “an organized examination or formal evaluation exercise.
Inspection involves the examination, measurement, testing, gauging, and comparison of materials or items. An inspection determines if the material or item is in proper quantity and condition and if it conforms to the applicable or specified requirements”
3
(Winchell, 1996). Inspection can be done after every production stage for product conformance assessment and based on the result of the inspection; if a defective item is detected, it can be reworked, repaired, replaced or scrapped to avoid vain processing and delivering to customer(s). The research domain of part quality inspection in a Multi-stage Manufacturing System (MMS), studies the imposed costs and obtained benefits by the inspection efforts with the purpose of assessing the manufacturing quality.
In most of the MMSs, raw materials pass a series of different manufacturing stages to be processed and changed to the final products. In these systems, the output of each manufacturing stage (except the last stage) is the input for the next one. Because of non-ideal manufacturing situations and stochastic nature of the production stages, deviations from design specifications are unavoidable and result in low-quality products (Mohammadi et al., 2017).
Part quality inspection in the MMSs is an important issue because of the multi-stage structure of the systems which causes various alternatives for inspection. In these systems, if an item is recognized as a defect, there are four possible actions: (1) Rework: the defective item will be sent to the previous production stage(s) for modifying, (2) Repair: the defective item will be repaired and proceeds to the next stage but in a downgraded quality form, (3) Replace: the defected item will be replaced with a conforming one, and (4) Scrap: the defective item will be scrapped. The scrap activities raise the production cost because of wasting material, time, and energy. On the other side, passing the undetected defective products through subsequent production stages raises production cost by establishing more rework and repair stages (required to restore the defect item) (Colledani et al., 2014). There are two distinct strategies, first, performing an inspection activity after each production stage to find defects quickly after corresponding operation of that stage. This would decrease the probability of passing nonconforming items across the MMS. Nevertheless, the cost of inspection after each production stage might be more elevated than the savings earned by the early recognition of defects. Second, the inspection could be employed just after the final production stage. This strategy would reduce the cost of the inspection activities, but there might be a nonconformance in the final product corresponding to the first stage. Therefore, it would be necessary to repeat all the production stages that results in an increase in
4
the total manufacturing cost. To minimize the total cost, in terms of production, inspection, scrap, replace, rework, and repair, it is practical to establish a balance among different costs and find an optimal inspection plan (Shetwan et al., 2011).
In the literature, the problem of finding this optimal plan is called Part Quality Inspection Planning (PQIP). The next section is dedicated to a further explanation for the PQIP problem.
1.2. PQIP problem
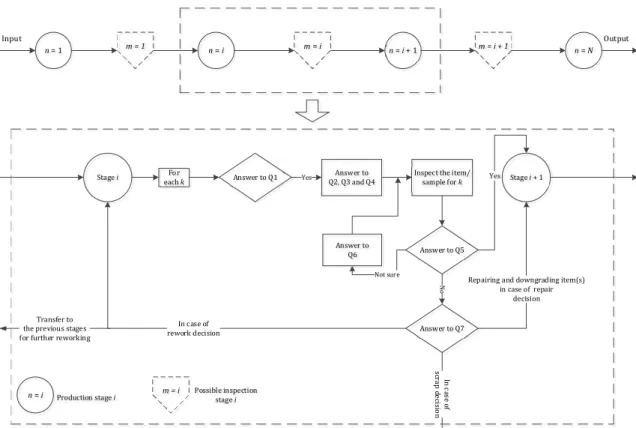
Figure1.1 schematically shows the PQIP problem in an MMS in each period. This system contains N different production stages that each of them can be followed by an inspection stage m. The figure illustrates the decision problems between each two adjacent production stages. As can be seen, a typical PQIP problem consists of seven main questions as follows:
Q1: Is Quality Characteristic (QC) k of product(s) inspected after production stage i in period t?
Q2: All the items are inspected or a fraction of them (i.e., sampling inspection)? Q3: What are the parameters of the sampling inspection?
Q4: What is the inspection threshold or specification region?
Q5: After the inspection performance, does the item/sample conform to the inspection threshold/specification region?
Q6: What is the number of inspection repetitions in case of being not sure about the inspection result?
Q7: In case of nonconformity, which waste management strategy should be performed (i.e., rework, repair, replace or scrap) for each nonconforming item?
In fact, the product may pass to the next stage or to customer(s) without at least one inspected QC, or the product may be sent to the next stage when inspection shows conformity with the design specification.
Using an inspection plan in an MMS imposes an additional cost, but in an imperfect MMS, a certain level of inspection will reduce total manufacturing cost and enhance the customer satisfaction as well. In this case, the associated cost of inspection will be covered by the benefits obtained through the detection of defects.
5
Noteworthy, performing an inspection after every production stage will reduce the scraping, replacing, reworking, and downgrading costs and avoid reaching nonconforming products to customer(s). On the other hand, unnecessary and often too inspections impose huge costs of equipment, staff, time, space and, interrupt the manufacturing process which results in extra Work-In-Progress (WIP) and flows. Hence, if inspections are done unnecessarily, then higher total costs will incur (Mohammadi, 2015).
n = 1 m = 1 n = i m = i n = i + 1 m = i + 1 n = N
Stage i For
each k Answer to Q1 Yes
Answer to Q2, Q3 and Q4
Inspect the item/
sample for k Stage i + 1
Answer to Q5 Not sure
Yes
No
Answer to Q7
Repairing and downgrading item(s) in case of repair
decision In case of
rework decision Transfer to
the previous stages for further reworking
In c as e o f sc ra p de ci si o n Input Output Answer to Q6
n = i Production stage i m = i Possible inspection stage i
Figure 1.1. PQIP problem in an MMS in period t
In the next section, we attempt to show the impacts of the production and maintenance issues on the main decisions of PQIP problem such as location and interval of inspection activities.
1.3. The relation of PQIP with maintenance and production issues
Production, quality, and maintenance are three significant aspects of each manufacturing system and are interrelated issues (Ben-Dayaand Rahim, 2001). Understanding and solving the industrial operation-related problems in manufacturing systems requires appropriate modeling of the dependencies among these aspects. In the past, production, quality, and maintenance have been mostly
6
considered independently. However, in the recent years, there has been a considerable interest in the models which integrate these issues (Ben-Daya and Rahim, 2001; Hadidi and Al-Turki, 2012).
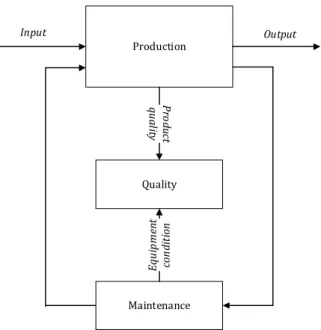
Figure 1.2 depicts the relations of these aspects in manufacturing systems. The link from Production to Maintenance shows that the employed equipment in Production needs some maintenance activities to be restored to a good condition. The link from Maintenance to Production implies that maintenance activities impact on the capacity of Production. The link between Production and Quality means that if Production works on the right way, it can produce high-quality products. If the equipment is maintained in a good condition, they can operate without any fault. This impact is shown by the link between Quality and Maintenance.
Production Quality Maintenance P ro d u ct qu a lit y Equ ip m en t con d it ion Input Output
Figure1.2. Relation of production, maintenance, and quality (Adopted from Ben-Daya and
Rahim, 2001)
According to the above discussions, three main aspects (i.e. production, quality, and maintenance) should be simultaneously regarded to produce high-quality products. The new developed paradigm by Colledani et al. (2014), Production
Quality, also support this necessity. In this respect, Table 1.1 presents a planning matrix regarding the integrated view for production, quality, and maintenance. As can be seen, the PQIP is categorized as the quality related problem which should be handled in the mid-term planning horizon because as a facility planning problem, it is
7
not possible to change the decisions such as the location and interval of inspection activities in short time periods.
In the recent years, Industry 4.0, the fourth industrial revolution, has attracted much attention in recent research works. Cyber Physical System (CPS) is one of the main concepts of Industry 4.0. The main roles of CPS are to fulfill the agile and dynamic requirements of production, and to improve the effectiveness and efficiency of the entire industry. It will be done with the characteristics of CPS production, based on heterogeneous data and knowledge integration (Lu, 2017). Notably, for performing a successful Production quality paradigm, we need to apply CPS characteristics for integrating knowledge of production, quality and maintenance department. This thesis tries to provide an optimization framework to integrate the knowledge of these departments and propose a global plan for improving the effectiveness and efficiency of the system.
Table 1.1. Production quality paradigm; A planning matrix (Inspired from Colledani et al.
(2014))
Planning horizon Production quality paradigm parties
Production Quality Maintenance
Long term Plant location
Production system Quality planning Determination of maintenance strategies: Maintenance delivery Maintenance methodology Organization and work
structure Support system Mid-term Master production planning Capacity planning PQIP Problem
Maintenance work load Forecasting
Capacity planning
Short-term
Lot-sizing machine Production scheduling Shop floor control
Quality control and improvement
Maintenance scheduling
As mentioned before, one of the factors that causes quality problems is defective/inefficient equipment. On the other side, production processes are shifting from operators to machines because of a huge improvement in automation and mechanization. Therefore, the role of equipment maintenance in controlling quantity, quality and costs is more evident and important than ever (Ben-Daya and Duffuaa, 1995).
If an equipment is not well maintained, it fails periodically and causes a low speed, a lack of precision, and consequently tends to produce defects (i.e., higher
8
defective production rate). On the other side, when this equipment is recently maintained, it is expected to have a lower rate in the defects production (Ben-Daya and Duffuaa, 1995). In many practical situations, part quality inspections require labors, specific test devices, and sometimes suspension of operations. So, when inspection cost is considerable, it is reasonable to inspect less frequently during the time the equipment is in healthier conditions, and, more frequently as time passes and the equipment degrades (Golmakani, 2012). On the other side, the appropriate implementation of the maintenance activities causes an increase in the production capacity and the system can meet more demands.
In conclusion, because of the maintenance impact on the defective production rate and the impact of defective production rate on the part quality inspection plan, there is a strong connection among performing maintenance activities and the required part quality inspection activities to achieve a certain production capacity for meeting the arrival demands.
1.4. Conclusion
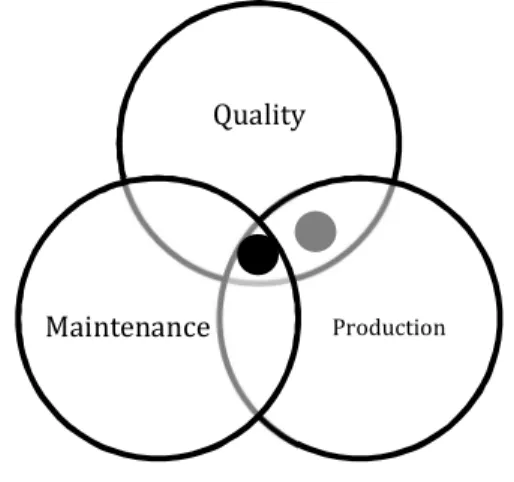
The concentration of this thesis is on the PQIP problem, and it attempt to deal with this problem regarding the impact of maintenance activities on the defective production rate and accordingly on the production capacity. Figure 1.3 depicts the positions of traditional (gray circle) and new PQIP problem (black circle) regarding to different kinds of manufacturing system problems. The common area among Quality, Maintenance, and Production is the domain of the Production Quality paradigm. The traditional PQIP problem (gray circle) is a production-quality-based problem and it does not consider the maintenance decisions and their impacts on the production capacity. Hence, we attempt to deal with the PQIP problem with these new considerations and define the new PQIP problem as its position is shown by a black circle. As discussed in the next section, the PQIP problem have not handled regarding the effects of the maintenance activities specifically preventive type.
As there is no research work which dealt with this new PQIP problem, next chapter review the literature of the traditional PQIP problem and by discovering research gaps it justifies the importance of working on this new PQIP problem.
9
Figure 1.3. Position of traditional and new PQIP problems in the production quality paradigm
Quality
Production
Chapter 2
11
2.0. Chapter purpose and outline
Since the core of current research is the PQIP problem, this chapter aims at
reviewing the PQIP literature and discovering research gaps. In this regard, Section 2.1
describes the adopted framework for doing the review. Then, Sections 2.2 and 2.3
investigate the literature regarding the characteristics of considered systems and applied
methodologies, respectively. Next, Section 2.4 explores the papers which handled the PQIP
problem considering maintenance and production issues. Finally, the literature is analyzed in Section 2.5 by providing the discovered gaps and some future research works.
2.1. Introduction
The keywords ‘‘inspection planning’’ in combination with ‘‘multi-stage production/manufacturing system’’ were used to find relevant journal articles, books, theses and conference contributions in the two most comprehensive databases; Scopus and ProQuest. 67% of the research works have been published by 11% of the journals (see
Figure 2.1). Noteworthy, International Journal of Production Research has the highest impact (i.e., 16.7%) among all. The rest of studies (i.e. 33%) have been published by the
journals with less than two research works. Figure 2.2 illustrates the number of issued
papers during the different periods, and as can be seen, there is an expected increasing
trend for research publishing. Although the last period in Figurer 2.2 includes seven years
(2010 to 2017), it is expected that the increasing trend of publishing in this field will be
continued for the second decade of the 21st century.
The associate literature is investigated from the different viewpoints: production system characteristics, methodology characteristics and optimization framework. Although
Raz (1986), Mandroli et al. (2006) and Shetwan et al. (2011) reviewed the literature of the PQIP problem in the different time periods, this chapter covers not only their investigated researches, but also the state-of-the-art literature up to 2017. In addition, this chapter investigates and classifies the literature based on two new and practical perspectives: Optimization under uncertainty and Integrated optimization with maintenance and
12
production issues. In this way, the readers of this chapter will get familiar comprehensively with the development trend and research gaps of the PQIP problem literature.
Figure 2.1Percentage of the published research works in the most famous journals
Figure 2.2. Number of published papers in different periods
2.2. MMS characteristics
Regarding the literature of the PQIP problem, the characteristics of investigated
MMSs fall into seven main categories (Mohammadi, 2015); (1) manufacturing structure, (2)
manufacturing/inspection low, (3) inspection type, (4) inspection strategy, (5) inspection
16.7 11.9 10.7 8.3 7.1 4.8 2.4 2.4 2.4 0 2 4 6 8 10 12 14 16 18
International Journal of Production Research Management Science
IIE Transactions
Computers and Industrial Engineering European Journal of Operational Research
International Journal of Advanced Manufacturing Technology Operations Research
Journal of Manufacturing Systems Naval Research Logistics Quarterly
5 11 12 24 26 9 0 5 10 15 20 25 30 1960-1970 1971-1980 1981-1990 1991-2000 2001-2010 2011-2017 Nu mbe r o f p u b li shed p ape rs Time period
13
errors, (6) failure type and rate, and (7) nonconforming strategy. Each of these main
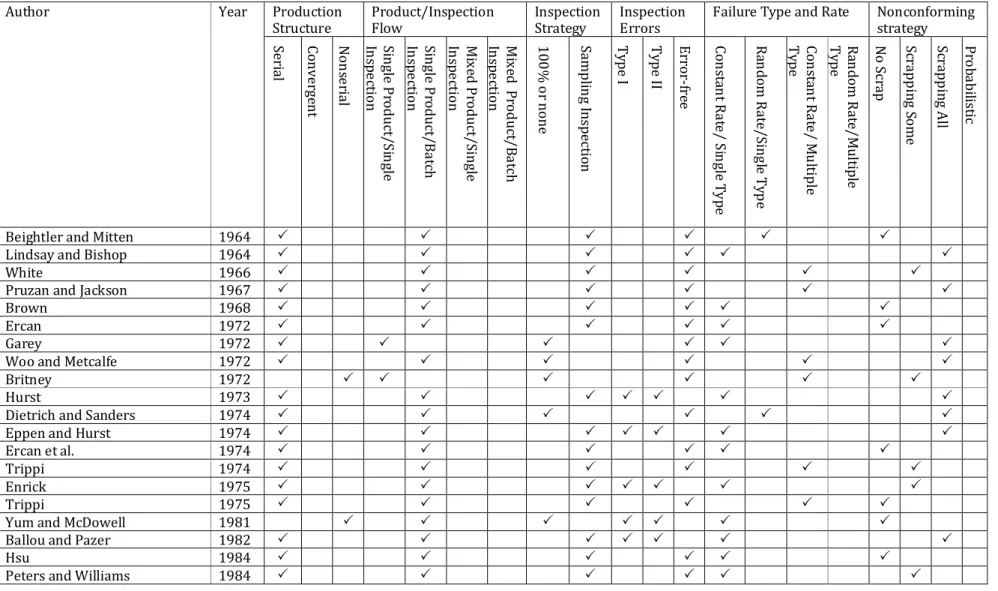
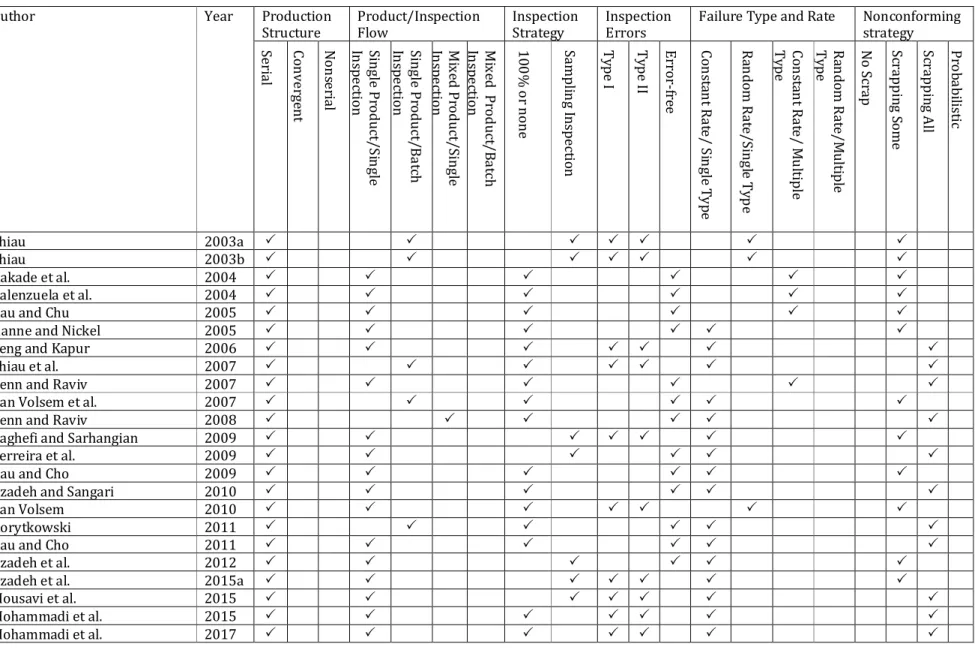
categories is elaborated through some sub-categories as follows. Table 2.1 illustrates the
features of the literature regarding these characteristics.
2.2.1. Production structure
There are three main manufacturing structures according to the product flow
alongside an MMS (Mandroli et al., 2006; Mohammadi, 2015):
i. Serial structure: all products pass the same successive manufacturing stages sequentially.
ii. Convergent structure: each item passes a certain set of successive manufacturing stages sequentially while different paths may be converged in a particular stage. On the other side, each production stage has at most one successor but many predecessor stages (e.g., assembly process).
iii. Nonserial structure: each item passes distinct stages sequentially while each production stage may have several successors and predecessor stages.
In contrary to the non-serial and convergent structures, the serial structure is the
most-considered in the literature (see Figure 2.3a) because the defects propagation can be
easily modeled in a mathematical way. On the other hand, in the convergent structure, mathematically tracking the root defects after the convergent stage is complex.
2.2.2. Production/inspection flow
A production line in an MMS can produce either a specific product or multiple types of the same product family. In this regard, inspections of this manufacturing line can be done per item or batch/lot. Therefore, four possible disciplines for the
production/inspection flow exist (see Figure 2.3b). Figure 2.3b also shows the percentage
of papers which consider these different disciplines. Although the Mixed production/batch
inspection discipline is closer to the real condition of MMSs, the modeling and solving
14
2.2.3. Inspection strategy
Two different inspection strategies have been employed by the researchers in the literature: 100% or none inspection and Sampling inspection. In the first strategy some of the QCs are not inspected, and if it is decided to inspect a QC, all the items are inspected.
Sampling inspection means if it is decided to inspect a QC, a sample of items is inspected.
Figure 2.3c illustrates the percentage of papers which consider these two different strategies. Although using the Sampling inspection is more practical in high rate production systems, it is difficult to be considered because the other parameters of this strategy (e.g., sample size) need to be determined simultaneously in the optimization framework and this great number of decision variables increases the solution complexity of the problem.
2.2.4. Inspection errors
There are two types of errors that may happen during a part quality inspection activity:
i. Error type I: occurs when a conforming item is classified wrongly as a nonconforming one.
ii. Error type II: happens when a nonconforming item is classified wrongly as a conforming one.
The Error-Free assumption for the inspection activity is unrealistic, but a considerable number of works (i.e., 37%) considered the inspection activities free of any
error (see Figure 2.3d).
2.2.5. Failure rate and type
A failure rate of a manufacturing stage is the proportion of defects to all the produced items. In the literature, a certain constant failure rate for each stage has been assumed in some works, whereas others have assumed either a plausible range of a failure rate or random failure under a specific distribution. In addition, two single and multiple failure types have been considered by the authors. In fact, each QC is related to a single or multiple failure modes. In a case of a single failure type for a specific QC, the QC will not be realized properly if its related failure mode is active. Similarly, for the multiple failure
15
types, the QC will not be realized appropriately if at least one of its related failure modes is active. In this regard, for the multiple failure types, a vector of failure rates is associated
with multiple failure modes (Mandroli et al, 2006). It is notable that each manufacturing
stage may contain more than one failure mode. In conclusion, as shown in Figure 2.3e, four
potential combinations exist while a few papers only considered the Multiple type/random
rate assumption.
2.2.6. Nonconforming strategy
When inspection recognized an item as a nonconforming product, four possible actions can be done. The item can be reworked, repaired, replaced, or scrapped. The decision about the appropriate action depends on the associated cost and knowledge of whether the nonconformity is reparable/reworkable or not. In this regard, a deterministic or probabilistic level of scrapping for nonconforming parts have been assumed by the researchers. In the deterministic level, for a given type of nonconformity, the scrapping level is given as one of the three different possibilities: all, none, or some of the nonconforming items are scrapped. On the other side, others have assumed a probabilistic level which means that a nonconforming item is scrapped with a certain probability, so
some of the items may have a chance to be reworked, repaired or replaced (Mohammadi,
2015). According to the above-mentioned explanations, the nonconforming strategy is
16
Table 2.1.Literature classification based on the MMS characteristics
Author Year Production
Structure Product/Inspection Flow Inspection Strategy Inspection Errors
Failure Type and Rate Nonconforming
strategy Seri al Co nve rge nt N on se rial Si ngle P roduct/S in gle In sp e ction Si ngle P roduct/ Ba tc h In sp e ction Mi x ed P roduct/Singl e In sp e ction Mi x ed Pr od uct / B a tch In sp e ction 1 0 0 % o r none Sampli n g I nspect io n Ty pe I Ty pe II Error -fre e Co n st an t Ra te / S in gle T y p e Ra n d o m R at e/Si ng le Ty p e Co n st an t Ra te / M u ltiple Ty pe Ra n d o m R at e/ M ulti pl e Ty pe N o Scr ap Sc rapp in g S om e Sc rapp in g A ll Pr o b a bi list ic
Beightler and Mitten 1964
Lindsay and Bishop 1964
White 1966
Pruzan and Jackson 1967
Brown 1968
Ercan 1972
Garey 1972
Woo and Metcalfe 1972
Britney 1972
Hurst 1973
Dietrich and Sanders 1974
Eppen and Hurst 1974
Ercan et al. 1974
Trippi 1974
Enrick 1975
Trippi 1975
Yum and McDowell 1981
Ballou and Pazer 1982
Hsu 1984
17
Table 2.1. Literature classification based on the MMS characteristics (continue)
Author Year Production
Structure Product/Inspection Flow Inspection Strategy Inspection Errors
Failure Type and Rate Nonconforming
strategy Seri al Co nve rge nt N on se rial Si ngle P roduct/S in gle In sp e ction Si ngle P roduct/ Ba tc h In sp e ction Mi x ed P roduct/Singl e In sp e ction Mi x ed Pr od uct / B a tch In sp e ction 1 0 0 % o r none Sampli n g I nspect io n Ty pe I Ty pe II Error -fre e Co n st an t Ra te / S in gle T y p e Ra n d o m R at e/Si ng le Ty p e Co n st an t Ra te / M u ltiple Ty pe Ra n d o m R at e/ M ulti pl e Ty pe N o Scr ap Sc rapp in g S om e Sc rapp in g A ll Pr o b a bi list ic Garcia-Diaz et al. 1984
Ballou and Pazer 1985
Gunter and Swanson 1985
Chakravarty and Shtub 1987
Lee and Rosenblatt 1987
Peters and Williams 1987
Yum and McDowell 1987
Tayi and Ballou 1988
Saxena et al. 1990
Barad 1990
Foster et al. 1990
Kang et al. 1990
Raz and Kaspi 1991
Tang 1991
Villalobos and Foster 1991
Villalobos et al. 1993
Taneja & Viswanadham 1994
Jewkes 1995
Rebello et al. 1995
Shin 1995
18
Table 2.1. Literature classification based on the MMS characteristics (continue)
Author Year Production
Structure Product/Inspection Flow Inspection Strategy Inspection Errors
Failure Type and Rate Nonconforming
strategy Seri al Co nve rge nt N on se rial Si ngle P roduct/S in gle In sp e ction Si ngle P roduct/ Ba tc h In sp e ction Mi x ed P roduct/Singl e In sp e ction Mi x ed Pr od uct / B a tch In sp e ction 1 0 0 % o r none Sampli n g I nspect io n Ty pe I Ty pe II Error -fre e Co n st an t Ra te / S in gle T y p e Ra n d o m R at e/Si ng le Ty p e Co n st an t Ra te / M u ltiple Ty pe Ra n d o m R at e/ M ulti pl e Ty pe N o Scr ap Sc rapp in g S om e Sc rapp in g A ll Pr o b a bi list ic
Deliman and Feldman 1996
Gurnani et al. 1996
Viswandham et al. 1996
Narahari and Khan 1996
Chevalier and Wein 1997
Rabinowitz and Emmons 1997
Chen et al. 1998
Lee and Unnikrishnan 1998
Yao and Zheng 1999a
Yao and Zheng 1999b
Chen and Thornton 1999
Hassan and Pham 2000
Veatch 2000
Zheng 2000
Verduzco et al. 2001
Zhou and Zhao 2002
Shiau 2002
Emmons and Rabinowitz 2002
Avinadav and Raz 2003
Oppermann et al. 2003
Van Volsem & Van
19
Table 2.1. Literature classification based on the MMS characteristics (continue)
Author Year Production
Structure Product/Inspection Flow Inspection Strategy Inspection Errors
Failure Type and Rate Nonconforming
strategy Seri al Co nve rge nt N on se rial Si ngle P roduct/S in gle In sp e ction Si ngle P roduct/ Ba tc h In sp e ction Mi x ed P roduct/Singl e In sp e ction Mi x ed Pr od uct / B a tch In sp e ction 1 0 0 % o r none Sampli n g I nspect io n Ty pe I Ty pe II Error -fre e Co n st an t Ra te / S in gle T y p e Ra n d o m R at e/Si ng le Ty p e Co n st an t Ra te / M u ltiple Ty pe Ra n d o m R at e/ M ulti pl e Ty pe N o Scr ap Sc rapp in g S om e Sc rapp in g A ll Pr o b a bi list ic Shiau 2003a Shiau 2003b Kakade et al. 2004 Valenzuela et al. 2004
Rau and Chu 2005
Hanne and Nickel 2005
Feng and Kapur 2006
Shiau et al. 2007
Penn and Raviv 2007
Van Volsem et al. 2007
Penn and Raviv 2008
Vaghefi and Sarhangian 2009
Ferreira et al. 2009
Rau and Cho 2009
Azadeh and Sangari 2010
Van Volsem 2010
Korytkowski 2011
Rau and Cho 2011
Azadeh et al. 2012
Azadeh et al. 2015a
Mousavi et al. 2015
Mohammadi et al. 2015
20
(a) Production structure (b) Production/Inspection flow
(c) Inspection type (d) Inspection error
(e) Defective type in the system and defect rate at the stage
(f) Nonconforming strategies
Figure 2.3. Percentage of papers which considered different assumptions
86% 6% 8% Serial Convergent Non-serial 48% 44% 6% 2% Single Prod./Single Insp. Single Prod./Batch Insp. Mixed Prod./Single Insp. Mixed Prod./Batch Insp. 60% 40% 100% or none Sampling 37% 32% 31% Error Free Type I Type II 61% 12% 24% 3% Singletype/constant rate Single type/random rate Multiple type/constant rate Multiple type/random rate 22% 27% 42% 9% All (deterministic) Some (deterministic) None (deterministic) Probabilistic
21
2.3. Methodology characteristics
According to the vast review of the PQIP literature, almost all the studies have dealt with the problem through an optimization formulation. In the following subsections, first, different kinds of the considered objective functions are elaborated, and then three necessary parts of an optimization formulation as (i) constraint, (ii) uncertainty approach,
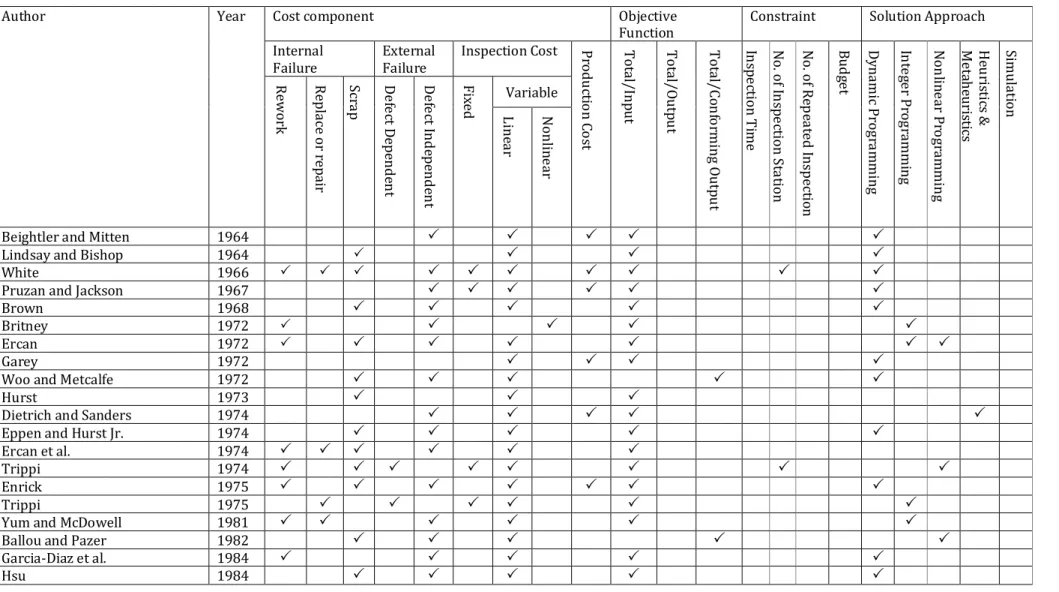
and (iii) solution approach are addressed. Table 2.2 illustrates the features of the literature
regarding the optimization characteristics.
2.3.1. Objective functions
Minimization of the total expected cost is the most common form of objective function in the literature. Total cost generally includes different cost components as production, inspection, and failure costs. The failure cost itself consists of internal and external cost. When nonconforming products are found before shipment, it imposes an internal cost to the system. This cost is specifically related to the costs of reworking, repairing, replacing, and scrapping the nonconforming product. A manufacturer undergoes the external failure costs when a defective product has been received by customer(s). These costs may be certain compensation or the lost sales and goodwill. The inspection cost contains two fixed and variable costs. The fixed inspection cost is related to a fixed amount of capital for preparing inspection tools and the variable cost directly depends on the frequency and number of inspected items. The variable inspection cost has been often assumed as a linear function, in which, the total variable inspection cost is the number of
items inspected multiplied by the variable inspection cost per item (Mohammadi, 2015).
There are just two works, which have treated this cost as a non-linear function (see e.g.,
Britney (1972) and Ballou and Pazer, (1985)). Regarding the current literature, there is no work which concurrently considers the non-linear form of variable inspection cost, fixed inspection cost and internal failure cost (i.e., scrap, rework, repair and replace). Please see
Figure 2.4a-c for the details of the literature regarding the considered internal, external, and inspection cost.
Another common form of the objective function is the expected unit cost. However,
22
computed the expected unit cost as total cost divided by the number of input items (i.e.
total cost/input items). The other versions were dividing the total cost by the number of
outputs and dividing the total cost by the number of conforming outputs (i.e., total
cost/output items or total cost/conforming output items).
There are only a few authors considering maximization formulations in their studies. The maximization objectives have mainly proposed in inspection scheduling problems besides to classical PQIP problem. To the best of our knowledge, no study has considered minimizing total manufacturing time. In addition, there is a lack of applying
multi-objective models in the current PQIP literature. In this respect, Mohammadi et al.
(2017) minimized total manufacturing cost and warranty cost (to capture customer satisfaction) in form of two different objective functions. However, the customer
satisfaction has a non-linear behavior when he/she receives the product lot—which was
neglected by Mohammadi et al. (2017). Indeed, the customer satisfaction and accordingly
the utility of the product lot is higher when the proportion of the conforming items is greater in the delivered lot. They solved the presented model by employing a meta-heuristic algorithm, namely Differential Evolution (DE) algorithm.
For approaching to the real situation of MMSs, where they face to the conflict objectives for optimizing their systems, developing the multi-objective mathematical models which simultaneously optimize several conflict objectives is an excellent research direction for future in this field. For instance, when the quality of the system is maximized through employing more inspection stations, the production cycle time is increased. Hence, developing a new bi-objective model to establish a trade-off between these two conflict objectives seems interesting and practical.
2.3.2. Constraints
The constraints in the typical PQIP problem are mostly associated with the different types of production structure and nonconforming strategy. Moreover, other constraints have been imposed to the optimization formulation. For example, some of them are: limitations on the inspection time, number of inspection and rework stations, number of inspection repetition, the budget for production and inspection activities, required place
23
for an inspection station, and minimum throughput or production capacity. Figure 2.4e
illustrates the percentage of papers which considered different constraints.
Other constraints in the developed optimization formulation could be the dependency between different QCs that require to be inspected. For instance, two QCs must be inspected in parallel or vice versa. In addition to QCs dependency, in some situations, there are dependent production stages, and there is no possibility for stop a particular stage to inspect a QC and you need to wait for the following operation(s) to be completed (Mirdamadi, 2014; Mohammadi, 2015). There are the other applicable and realistic constraints in the domain of PQIP problem that have not considered yet such as the limited capacity of operating machines, waiting time for inspection and capable inspection tools to treat the items.
2.3.3. Optimization under uncertainty
The PQIP problem inherently contains different sources of uncertainty. Accordingly, the necessity for consideration of associate uncertain parameters and obtaining a robust solution has been implied by most of the researchers, and it should be extended more. One of the main sources of uncertainty in this problem refers to the condition of production stages for processing items in conformity with specification region. This uncertain condition results in the uncertainty of the failure production rate parameter. In this regard,
many works considered the random failure rate in a probabilistic manner (see Table 2.1).
They assumed a specific probability distribution (e.g., Bernoulli distribution) for this parameter. By the above-mentioned source of uncertainty, the proportion of nonconforming items which is repairable, reworkable or need to be scrapped or replaced, is uncertain. This uncertain data has been also treated as a probabilistic nonconforming
strategy in the literature (See Table 2.1). Regarding the uncertainty about inspection tools
and inspection operators, Error type I and Error type II have been considered
probabilistically by the majority of researchers (see Table 2.1). Beside these uncertainties
which are rooted in the internal reasons, there are the other uncertainties that are related
to the uncertain external condition such as price fluctuations (Azadeh et al., 2015a) and
demand amount. Azadeh et al. (2015a) described the cost components (i.e., inspection,
24
fuzzy model for the problem and converted it into an equivalent auxiliary crisp model by
employing the Jimenez ’s definition of expected value. Mohammadi et al. (2017) considered
alteration ranges for the production and inspection times, errors type I and II of the inspection activities, dispersion and misadjustment of the production processes, and developed a global robust model based on optimizing the expected value and variance of the objective function in the form of the Taguchi method. Regarding these recent works, it would be an excellent research direction to propose an approach (e.g., a robust possibilistic programming approach) to make use of the advantages of the fuzzy and robust approaches for considering uncertainties related to the external reasons which are being usually implied by experts (subjective data).
2.3.4. Solution approaches
The researchers have developed a wide variety of solution approaches for solving the PQIP problem. In the most cases, they derived a nonlinear total cost function while some of the decision variables (e.g., opening an inspection station) can only have integer values. This transforms the problem to a nonlinear and integer programming problem. For the integer programming, the discrete optimization approaches such as those using the
branch-and-bound technique have been applied (Raz and Kaspi, 1991).
Because the multi-stage structure of manufacturing systems can be well considered by the stages and states of the Dynamic Programming (DP) models, 29% of the 89 reviewed
papers applied DP and made this approach as the most-used one (see Figure 2.4f).
However, DP becomes quite impractical when the number of production stages is high. Because possible combinations of places for performing inspection activities, increase
exponentially (Mandroli et al., 2006; Shetwan et al., 2011).
Indeed, a huge restriction of these approaches is their incapability of solving medium and large size problems due to the requirement of high computational time and memory. This limitation results in usage of heuristic and meta-heuristic algorithms in this domain, such as Simulated Annealing (SA) and Genetic Algorithm (GA). They obtain
near-optimal solutions in considerable low computational time (Modammadi, 2015).
25
promising results in comparison with SA and GA for solving a proposed mixed-integer linear programming model.
Another optimization approach is simulation; however, this method just investigates a limited number of production scenarios for optimization. Considering the current literature, no study proposes an exact solution method to large size instances. In this regard, developing decomposition methods (e.g., Benders decomposition methods) to solve large size mixed-integer programming models can be a huge contribution to this area. In addition, employing some newly-developed meta-heuristic algorithms, such as Fireworks and Cuckoo Search and comparing to the conventional SA, GA, and DE algorithms regarding computational capability can be interesting as a future research direction.
26
Table 2.2. Literature classification based on the methodology
Author Year Cost component Objective
Function
Constraint Solution Approach
Internal Failure External Failure Inspection Cost Pr odu cti o n C o st Tot al/Inp ut Tot al/O utp u t Tot al/Co n fo rming O utp u t In sp e ction T ime N o. of I n sp e ction S ta tion N o. of R ep ea ted Inspect io n B ud ge t Dy namic Prog ra m ming In te ge r Pr og rammi ng N on lin e ar Pr o gr am min g He u ris tic s & Meta he ur is ti cs Si mulat ion Rework Replace or r ep air Scr a p De fe ct D epe nd en t De fe ct I nd epe nd en t Fix ed Variable L ine a r Non lin e ar
Beightler and Mitten 1964
Lindsay and Bishop 1964
White 1966
Pruzan and Jackson 1967
Brown 1968
Britney 1972
Ercan 1972
Garey 1972
Woo and Metcalfe 1972
Hurst 1973
Dietrich and Sanders 1974
Eppen and Hurst Jr. 1974
Ercan et al. 1974
Trippi 1974
Enrick 1975
Trippi 1975
Yum and McDowell 1981
Ballou and Pazer 1982
Garcia-Diaz et al. 1984
27
Table 2.2. Literature classification based on the methodology (continue)
Author Year Cost component Objective
Function
Constraint Solution Approach
Internal Failure External Failure Inspection Cost Pr odu cti o n C o st Tot al/Inp ut Tot al/O utp u t Tot al/ Co n fo rming O utp u t In sp e ction T ime N o. of I n sp e ction S ta tion N o. of R ep ea ted I nspect io n B ud ge t Dy namic Prog ra m ming In te ge r Pr og rammi ng N on lin e ar Pr o gr am min g He u ris tic s & Meta he ur is ti cs Si mulat ion Rework Replace or r ep air Scr a p De fe ct D epe nd en t D e fe ct I nd epe nd en t Fix ed Variable L ine a r Non lin e ar
Peters and Williams 1984
Ballou and Pazer 1985
Gunter and Swanson 1985
Chakravarty and Shtub 1987
Lee and Rosenblatt 1987
Peters and Williams 1987
Yum and McDowell 1987
Tayi and Ballou 1988
Saxena et al. 1990
Barad 1990
Foster et al. 1990
Kang et al. 1990
Raz and Kaspi 1991
Tang 1991
Villalobos and Foster 1991
Villalobos et al. 1993
Taneja & Viswanadham 1994
Jewkes 1995
Rebello et al. 1995
Shin 1995
28
Table 2.2. Literature classification based on the methodology (continue)
Author Year Cost component Objective
Function
Constraint Solution Approach
Internal Failure External Failure Inspection Cost Pr odu cti o n C o st Tot al/Inp ut Tot al/O utp u t Tot al/Co n fo rming O utp u t In sp e ction T ime N o. of I n sp e ction S ta tion N o. of R ep ea ted I nspect io n B ud ge t Dy namic Prog ra m ming In te ge r Pr og rammi ng N on lin e ar Pr o gr am min g He u ris tic s & Meta he ur is ti cs Si mulat ion Rework Replace or rep air Scr a p De fe ct D epe nd en t De fe ct I nd epe nd en t Fix ed Variable L ine a r Non lin e ar
Deliman and Feldman 1996
Gurnani et al. 1996
Narahari and Khan 1996
Viswandham et al. 1996
Chevalier and Wein 1997
Rabinowitz and Emmons 1997
Chen et al. 1998
Lee and Unnikrishnan 1998
Chen and Thornton 1999
Yao and Zheng 1999a
Yao and Zheng 1999b
Hassan and Pham 2000
Veatch 2000
Zheng 2000
Zhou and Zhao 2002
Emmons and Rabinowitz 2002
Shiau 2002
Oppermann et al. 2003
Avinadav and Raz 2003
Van Volsem & Van Landeghem 2003
29
Table 2.2. Literature classification based on the methodology (continue)
Author Year Cost component Objective
Function
Constraint Solution Approach
Internal Failure External Failure Insp. Cost Pr odu cti o n C o st Tot al/Inp ut Tot al/O utp u t Tot al/ Co n fo rming O utp u t In sp e ction T ime N o. of I n sp e ction S ta tion N o. of R ep ea ted In sp e ction B ud ge t Dy namic Prog ra m ming In te ge r Pr og rammi ng N on lin e ar Pr o gr am min g He u ris tic s & Meta he ur is ti cs Si mulat ion Rework Replace or r ep air Scr a p De fe ct D epe nd en t D e fe ct I nd epe nd en t Fix ed Variable L ine a r Non lin e ar Shiau 2003b Kakade et al. 2004 Valenzuela et al. 2004
Rau and Chu 2005
Hanne and Nickel 2005
Feng and Kapur 2006
Shiau et al. 2007
Penn and Raviv 2007
Van Volsem et al. 2007
Penn and Raviv 2008
Vaghefi and Sarhangian 2009
Ferreira et al. 2009
Rau and Cho 2009
Azadeh and Sangari 2010
Van Volsem 2010
Korytkowski 2011
Rau and Cho 2011
Azadeh et al. 2012
Azadeh et al. 2015a
Mousavi et al. 2015
Mohammadi et al. 2015
30
(a) Internal failure cost (b) External failure cost
(c) Inspection cost (d) Form of expected unit cost
(e) Additional constraints (f) Optimization method
Figure 2.4. Percentage of papers considered different methodology characteristics
42% 10% 48% Rework/repair Replace Scrap 26% 74% Defect type dependent Defect type independent 29% 69% 2% Fixed cost Linear variable cost Nonlinear variable cost 83% 9%8% Total/input Total/output Total/Conf. output 29% 52% 5% 14% Inspection time Number of inspection stations Number of repeated measurements Budget limit 29% 10% 17% 38% 6% DP IP NLP Heuristics & Meta-heuristics Simulation
31
2.4. Integrated optimization
Production, quality, and maintenance are three significant aspects of each manufacturing system and are interrelated problems (Ben-Daya and Rahim, 2001). The link between these issues is explained in Section 1.2. Noteworthy, the aim of this section is not to review the papers, which proposed integrated planning for quality, production, and maintenance. Since the main problem of this thesis is the PQIP problem, the papers that are reviewed here are those whose principal problem is the PQIP and have tried to incorporate the production and maintenance issues into it. Indeed, there are a few works in the literature incorporated production logistic decisions, such as optimum lot size (Tayi and Ballou, 1988), production rate (Gunter and Swanson, 1985; Penn and Raviv, 2007; Penn and Raviv, 2008), sequence of operations (Raz and Kaspi, 1991), inspection scheduling (Emmons and Rabinowitz, 2002), inspection resource assignment (Shiau, 2002), assignment of operations to operators (Hanne and Nickel, 2005), and process scheduling (Shiau et al., 2007) into the PQIP problem.
Maintenance as an important tool for the quality-assurance program, has a strong effect on the optimum PQIP. The British Standard Institution defines maintenance as “a combination of all technical and associated administrative activities needed to maintain equipment, installations and other physical assets in the appropriate operating condition or bring them back to this condition” (Muchiri et al, 2014). Maintenance activities in manufacturing systems are categorized according to the time they are activated in. Corrective maintenance is a kind of the maintenance activity, which is only activated after a failure has been realized. However, Preventive Maintenance (PM) is performed to avoid a possible failure. Some of the PM activities are performed in specific points of system lifetime, called time/aged-based maintenance, and the others are performed after two or more monitored indicators showing that the system is going to be failed or its performance are deteriorating (i.e., condition-based maintenance). In the condition-based maintenance strategy, the time for performing a maintenance activity is determined based on the real condition of the system, but in the time/aged-based maintenance, it is based on the historical data of the system (Liu et al., 2017; Nicolai and Dekker, 2008). Indeed, different
32
maintenance strategies attempt to preserve the efficiency of degrading resources over time by employing pro-active and predictive capabilities (Iung et al., 2009).
The system degradation not only increases chance of a failure to happen, but also causes defective product output (Kuo, 2006). Indeed, the previous studies within the PQIP literature just considered a non-deteriorating system with constant defect production probability of different production stages. Although one of the conventional solutions is to conduct PM activities to reduce the probability of defect production (Colledani et al., 2014), the PQIP literature lacks a study, which uses the advantage of PM performance (decreasing the defect production rate) to plan the part quality inspection activities accordingly. Regarding this lack of research, defining and solving an integrated planning problem which simultaneously determines the optimum plan of part quality inspection and preventive maintenance is an interesting research direction which conforms with the Industry 4.0 concept.
2.5. Conclusion
In the framework of a quality assurance program, the PQIP is a significant decision problem, which all the MMSs are dealing with. Indeed, a proper part quality inspection plan not only avoids delivering nonconforming products to customer(s), but also increases the efficiency of the MMS by decreasing waste of time and material.
In this chapter, the existing research works on the PQIP optimization problem have been reviewed from the viewpoint of the MMS characteristics as well as the modeling and solution methodologies. In addition, the literature has been investigated regarding the integrated optimization of the part quality inspection with the maintenance and production planning.
Based on the conducted review, some research gaps were mentioned in the previous sections. Accordingly, this thesis considers a deteriorating serial multi-stage manufacturing system with minimum required conforming items, and attempts to contribute to the literature by:
Developing a novel integrated optimization approach for to simultaneously plan the part quality inspection and PM activities.
33
Introducing a non-linear measure for system productivity and considering it as a new objective function besides traditional total cost.
Considering uncertainty about cost components (i.e., production, inspection, maintenance, repair, scrap, and penalty cost for the delivered nonconforming items) and demand amount (i.e., minimum required conforming items).
To perform these new contributions, a bi-objective mixed-integer non-linear mathematical model is presented. Then, a piecewise linear approximation technique is used to linearize the model. Next, a robust possibilistic approach is used to handle the uncertain parameters and guarantee the robustness of the obtained solution. Finally, the augmented ε-constraint method is employed to deal with the bi-objective model and obtain the Pareto frontier.