Science Arts & Métiers (SAM)
is an open access repository that collects the work of Arts et Métiers Institute of
Technology researchers and makes it freely available over the web where possible.
This is an author-deposited version published in:
https://sam.ensam.eu
Handle ID: .
http://hdl.handle.net/10985/13115
To cite this version :
Aïda ERFANIAN, Stanley TARNG, Yaoping HU, Jérémy PLOUZEAU, Frédéric MERIENNE
-Force and vibrotactile integration for 3D user interaction within virtual environments - In: IEEE
Virtual Reality, Etats-Unis, 2017-03-18 - IEEE Virtual Reality - 2017
Any correspondence concerning this service should be sent to the repository
Administrator :
[email protected]
Aida Erfanian* Stanley Tarng* Yaoping Hu* Jérémy Plouzeau
†Frédéric Merriene
†* Dept. of Electrical and Computer Engineering Schulich School of Engineering University of Calgary, CANADA
† LE2I UMR6306
Arts et Métiers CNRS University, FRANCE
ABSTRACT
Proper integration of sensory cues facilitates 3D user interaction within virtual environments (VEs). Studies on multi-sensory integration of visual and haptic cues revealed that the integration follows maximum likelihood estimation (MLE). Little effort focuses however on integrating force and vibrotactile cues – two sub-categorical cues of the haptic modality. Hence, this paper presents an investigation on MLE’s suitability for integrating these sub-categorical cues. Within a stereoscopic VE, human users performed a 3D interactive task of navigating a flying drone along a high-voltage transmission line in an inaccessible region and identifying defects on the line. The users had to identify defects via individual force or vibrotactile cues, and their combinations in co-located and disco-located settings. The co-co-located setting provided both cues on the right hand of the users; whereas the dislocated setting delivered the force and vibrotactile cues on the right hand and forearm of the users, respectively. Task performance of the users, such as completion time and accuracy, was assessed under each cue and setting. The presence of the vibrotactile cue promoted a better performance than the force cue alone. This was in agreement with the role of tactile cues in sensing surface properties, herein setting a baseline for using MLE. The task performance under the co-located setting indicated certain degrees of combining those under the individual cues. In contrast, the performance under the dislocated setting was alike that under the individual vibrotactile cue. These observations imply an inconclusiveness of MLE to integrate both cues in a co-located setting for 3D user interaction.
Keywords: 3D user interaction, force and vibrotactile cues, sensory integration, maximum likelihood estimation, user performance. Index Terms: H.5.1 [Multimedia Information Systems]: Artificial, augmented and virtual realities; H.5.2 [User Interfaces]: Haptic I/O. 1 INTRODUCTION
Virtual environments (VEs) need to provide human users with multi-sensory feedback to establish a sense of presence [8, 10, 11, 15, 16, 24, 27, 37, 38]. As user tasks in VEs progressively become more demanding in precision and accuracy, it is necessary to integrate multi-sensory feedbacks from vision, haptics, etc. for maximizing task performance. Each sensory modality of the
humans responds to various cues, which stimulate certain sub-categorical receptors of the modality. For example, cues of the haptic modality include the sub-categories of kinesthetic force and pressure, cutaneous textures of surfaces (i.e., vibration, shape, smoothness), moisture, and temperature [15, 25]. These sub-categorical cues have been applied to enhance 3D user interaction within VEs [38, 24]. Multiple cues, in some combinations thereof, are generally effective at giving a sense of presence and enhancing user performance [8, 10, 11, 16, 24, 27]. In particular, force and vibrotactile cues are frequently used to aid the users in manipulating objects within VEs. The readily availability of devices, which deliver force or vibrotactile cues to the users, facilitates such 3D user interaction within VEs.
Both force and vibrotactile cues are generally applied in two ways: co-located and dislocated [5, 30, 28]. When interacting with physical objects for manipulation in the real world, the users expect feedbacks directly in contact with the objects. That is, the cues are co-located to stimulate different sensory receptors for the users’ cognitive responses [5]. Force and vibrotactile cues provided by separate haptic devices can often be dislocated however, when interacting with virtual objects within VEs. The dislocation is mainly due to the design restriction and implementation of the haptic devices [5]. Studies have commonly reported an observation that the co-located cues offer better performance in the tasks of perception, discrimination, and tool steering [4, 9, 28, 29, 30, 32, 33]. Specifically, efforts exist to combine task-specific, co-located force and cutaneous cues for enhancing user perception and performance [12, 28, 29, 32, 33]. The dislocated cues enhance task performance of manipulating virtual objects, in case it was infeasible to co-located both cues [41]. However, little effort is devoted to exploring a generic mechanism of integrating force and vibrotactile cues for 3D interactive tasks.
Existing reports on multi-sensory integration have focused on visual and haptic cues [10, 35, 39], disparity and texture cues of the visual modality [18], either force and position cues or force and cutaneous cues of the haptic modality [21, 29, 32, 33], as well as auditory and visual cues [31]. Most of these reports have examined various generic mechanisms of the integration, such as maximum likelihood estimation (MLE) [10, 18, 21, 35], information integration theory [39], and signal detection theory [31]. The majority of these integrations has used co-located cues and followed MLE [10]. Exceptions are co-located force and cutaneous cues under task-specific models [29, 32, 33]. These models would not be applicable to other interactive tasks in VEs. Using haptic devices, it is feasible to have both co-located and dislocated settings of force and vibrotactile cues in the haptic modality [36, 41]. How these cues are integrated under either setting is therefore important for creating intuitive VEs. A generic mechanism would be needed to theorize and simulate the integration of force and vibrotactile cues for improving user interaction within VEs.
In this paper, the suitability of MLE was explored to integrate force and vibrotactile cues for 3D user interaction within VEs. The
Force and Vibrotactile Integration for
3D User Interaction within Virtual Environments
* email: {aerfania, stanley.tarng, huy}@ucalgary.ca † email: {jeremy.plouzeau, frederic.merienne}@ensam.eu
integration of these sub-categorical cues was compared under a co-located and a disco-located setting within a stereoscopic VE. The 3D interactive task of human users was to navigate a flying drone along a high-voltage transmission line in an inaccessible region; and to identify defects on the transmission line. This task was chosen because of potential applications in engineering practice. However, the execution of the task needed integration of multisensory information. The navigation was aided by both visual and force cues; whereas the identification was via individual force or vibrotactile cues, as well as their combination in the co-located and dislocated settings. Under the individual cues and both settings, the visual information of the transmission line and its surroundings was the same within the VE. Visually discernable details were unavailable on the transmission line to signal any defects, because the drone needed to be kept at a safe distance from the line for its integrity. Thus, force and/or vibrotactile cues were the only sources of feedback for the users’ detection. Our observations revealed that the presence of the vibrotactile cue facilitated a better task performance of the users than the force cue alone. Since MLE was frequently used for multi-sensory integration [35], we applied MLE as the first attempt to examine the integration of both force and vibrotactile cues. The task performance under the co-located setting combined those under individual cues at certain degrees; whereas the performance under the dislocated setting was alike that under the vibrotactile cue. These observations indicate an inconclusiveness of MLE for investigating integration of co-located force and vibrotactile cues.
2 EMPIRICAL STUDY
A stereoscopic VE was developed to undertake the study on the integration of the force and vibrotactile cues for 3D interactive tasks.
2.1 Virtual Environment
The VE was developed by using Unity 3D game engine (version 5.3.4f). The C# language was utilized for controlling all visual and haptic components of the VE. Fig. 1 illustrates devices used in the VE for user interaction. As depicted in Fig. 1(a), a PHANToM Omni device (Geomagic Inc., USA) was employed for inputting user commands and providing force cues to the right hand of a human participant (a user). The device delivered no vibrotactile cues to prevent instability from the device. Instead, vibrotactile cues were generated by a VibroTac bracelet (SENSODRIVE Gmbh, Germany) as illustrated in Fig. 1(b). The vibrotactile cues were delivered to the right hand or forearm of the participant. Two Unity 5 haptic plugins were applied to activate the device and bracelet. One was a force plugin for the Geomagic OpenHaptics, provided by the Digital Design Studio at the Glasgow School of Art, United Kingdom. Another was a vibrotactile plugin, made in-house at the Arts et Métiers, France.
In a 3D stereoscopic view, the visual scene of the VE was projected on the center screen of a CAVE (automatic virtual environment) using two 2 projectiondesign F30SX projectors (Barco Fredrikstad, Belgium). The screen had a wall-size of 3×3 m2. As shown in Fig. 1 (c), a pair of passive stereo goggles (Infitec Gmbh, Germany) permitted each participant to view the visual scene. The frame rate of the scene was maintained at 100 frames per second. Each participant used a pair of ear plugs to block out the noise generated from the VibroTac bracelet, while being activated and delivering vibrotactile cues. The participant wore an E4 wristband (Empatica Inc., Italy), as illustrated in Fig. 1(d), on his/her left wrist. The wristband allowed to monitor the physiological signals of the participant in real time.
Fig. 2 depicts the schematic layout of the VE and a participant. The participant sit on a chair and applied his/her right hand to hold the Omni device on a small table. The chair was positioned at a
distance of 2.70 m from the center of the front screen, as illustrated in Fig. 2(a). The right elbow of the participant rested on the right arm of the chair to fit comfortable with respect to the stylus of the Omni device, as shown in Fig. 2(b). The visual scene was a high-voltage power transmission line located in an inaccessible mountainous region. The transmission line was curved downwards to the ground between two supporting towers, due to the weight of the line. The two towers were 60.00 m apart. The participant was required to use the Omni device to fly a drone along the curved transmission line.
The drone was equipped with a rigid, robotic arm attached to its bottom and a stereo camera assembled on its front. The arm had a hoop-shaped clamp at its distal end. The clamp covered the transmission line for sensing defects on the line. The defects were minuscular for visual differentiation from the line. The Omni
(a) (b) (c) (d)
Figure 1: Devices used in the VE: (a) A Phantom SensAble® Omni device; (b) A VibroTac bracelet; (c) Stereo goggles and ear plugs; and (d) An Empatica® wristband.
(a)
(b)
Figure 2: The schematic layout of the VE and a participant. (a) The geometry of the VE to display a stereoscopic visual scene and to position a participant with respect to both the scene and an Omni device; and (b) An example of the participant employing the device to fly the drone within the VE along the transmission line.
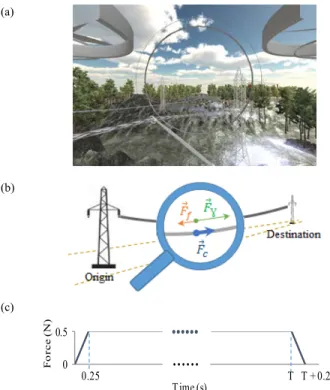
device and VibroTac bracelet delivered respectively a force and a vibrotactile cue, when the clamp reached the location of a defect. The camera allowed the participant to view the stereoscopic scene from the perspective of the drone. As illustrated in Fig. 3(a), the participant could view the transmission line, the towers, the clamp, part of the robotic arm and both frontal blades of the drone, and the mountainous region.
The VE was run on a high-end graphics workstation with 2 Intel Xeon X5690 CPU processors, 2 nVidia QuadroPlex 7000 graphics cards plus 4 Quadro 6000 graphic adapters, 32 GB of RAM and a 64-bit Windows® 7 operating system.
2.2 Participants
Ten male participants (with a mean age of 26.78 ± 5.77 years old) took part in the study. All participants were naïve to the purpose of the study. A pre-screening assessment was conducted to verify the eligibility of each participant. The assessment consisted of an Edinburgh handedness test, an Ishihara color-blindness test, and a Randot stereo test. The outcomes of the assessment indicated that each participant was right-handed with regular color vision, and had normal or corrected-to-normal vision with the stereo acuity of at least 40” of arc. The study had an ethics approval by one of two research ethics boards of our university, according to the guidelines of the governmental research agencies.
2.3 Procedure
The 3D interactive task of the participant combined 3D navigation and defect identification. While flying the drone over and along the transmission line using the Omni device, the participant inspected
the defects on the curved line (due to the gravity on the line). For navigating the drone, the participant had to press the dark-gray button of the device’s stylus and point the stylus tip to the flying direction of the drone. While the drone was flying to follow the trajectory of the line, the clamp of the robotic arm was covering the line to slide for sensing its surface. When the stylus tip drifted away from the line while pressing the dark-button, the clamp opened for the participant to move the drone away from the line. That is, the stylus acted like a steering wheel of a moving vehicle; and the dark-gray button powered the drone to fly as a gas pedal of the vehicle. To facilitate the participant to slide the clamp, there was a continuous force, , tangentially along the transmission line, as illustrated in Fig. 3(b). The use of this force was to guide the drone to move along the curved trajectory of the line. As given in Eq. (1), this force resulted from the summation of a guiding force, , and a friction force, , which were opposite to each other.
(1) For the continuous force, its magnitude was a constant of 0.50 N and its direction was updated dynamically when the drone flew from one tower to another. The magnitude was slightly above the threshold of the human force perception [20] and under the device’s maximum force for continuous exertion (0.88 N). As depicted in Fig. 3(c), this magnitude had an up- and a down-ramp at the first and last 0.25 s, respectively. These ramps were to eliminate the noise and jolt of the Omni device. Via the stylus of this device, the participant could feel the continuous force as feedback to facilitate his/her governance of the flying drone. In case that the participant moved the drone away from the transmission line, the magnitude of the continuous force ramped down from 0.5 N to 0.0 N within a time interval of 0.25 s. The magnitude ramped up within the same interval from 0.0 N to 0.5 N, if the drone was back on the line.
To deliver haptic cues, there were two ways of placing the VibroTac bracelet with respect to the stylus of the Omni device. The participant always used his/her right hand to hold the stylus and to receive a force cue. The bracelet could be however co-located with the stylus on the right hand or disco-located on the right forearm, as shown in Fig. 4(a) and Fig 4(b) respectively. The first vibration motor of the bracelet was employed to deliver a vibrotactile cue. In the co-located way, the first motor was placed on the skin covering the first dorsal interosseous muscle between the thumb and the index finger. In the dislocated way, the same motor was positioned at the carpi radialis longus muscle of the forearm. This muscle is located on the midsection of the forearm. To localize the muscle, the participant was required to produce an arm posture by extending his/her right arm straight forward with the palm facing downwards. This posture let the muscle pop up to be distinguishable from other muscles on the forearm. The interosseous and carpi muscles were chosen as the vibrotactile sites, because these muscles contracted by griping the stylus with the thumb and index finger. While the clamp was moving along the transmission line, any abnormality (i.e., defect) on the surface of the line was signaled to the participant via the individual or combined force and vibrotactile cues. The participant was required to declare his/her perceiving the defect by pressing down both
(a)
(b)
(c)
Figure 3: The visual scene of the VE: (a) The participant’s view of the scene, the same as the camera assembled in front of the flying drone; (b) The transimission line supported by two towers. [The magnifier describes a continuous force along the tangntial direction of the line]; and (c) Profile of the continuous force, , with ramping-up and -down portions, where T represents the instant of the clamp’s reach to the end of the line.
0 0.5 F o rc e (N ) Time (s)
...
0.25...
T T + 0.25 (a) (b)Figure 4: Locations of both force and vibrotactile cues: (a) Co-located; and (b) Dislocated.
declare his/her perceiving the defect by pressing down both buttons on the stylus of the device.
Fig. 5 illustrates the individual cues and their concurrencies to form 5 haptic profiles as follows:
F_only: A defect was signaled to the participant by a force cue, as illustrated in Fig. 5 (a). With a 0.10 N increment in the magnitude of the continuous force, this force cue had a magnitude of 0.60 N (= 0.10). The cue lasted 1.00 s long, excluding the pre- and after-ramping of 0.25 s. The increment of 0.1 N was chosen to make the cue easily distinguishable from the continuous force and to ensure the cue below the maximum sustainable force of the device (= 0.88 N). Thus, the force cue was 20% stronger in magnitude than the continuous force – larger than 15% for a just noticeable difference [22]. Before this study, a pilot assessment confirmed this distinguishability of the force cue from the continuous force.
V_co: A defect was signaled to the participant by a vibrotactile cue in a co-located way. As depicted in Fig. 5 (b), the vibration was 1.00 s long at a frequency of about 200 Hz and superimposed on the continuous force. This frequency fell within the human sensing range to vibrations [41].
V_dis: A defect was signaled to the participant by a vibrotactile cue in a dislocated way. The characteristics of this cue and its superimposition to the continuous force were the same as those in the co-located way, as shown in Fig. 5 (b). FV_co: A defect was signaled to the participant by the
combination of a force and a vibrotactile cues in a co-located setting, as depicted in Fig. 4(a). The characteristics of the force and vibrotactile cues were the same as described for F_only and V_co, respectively. However, both cues occurred concurrently for 1.00 s, as depicted in Fig. 5(c).
FV_dis: A defect was signaled to the participant by the combination of a force and a vibrotactile cues in a dislocated setting, as shown in Fig. 4(b). The concurrent occurrence and profile of these cues were the same as those of FV_co, as illustrated in Fig. 5(c).
Each haptic profile corresponded to one testing block in the study. There was one practice block before each testing block of F_only, V_co (or V_dis), and FV_co (or FV_dis). In each practice block, the participant learnt how to fly a drone by using the Omni device and to identify a defect by using the provided cue (or cues). The participant needed to declare at least 50% of defects on the transmission line in less than 5 minutes to be eligible for proceeding to the corresponding testing block. The locations of 15 defects on the transmission line were randomly distributed and differed among
all practice and testing blocks. In each block, the repetition of the defect identification accorded to these 15 defects.
After each practice or testing block, the participant answered one questionnaire on cybersickness [19], and another 4-component questionnaire under each haptic profile. During the pre-screening and each block, the Empatica wristband was worn by the participant on the left wrist. The wristband recorded his/her physiological signals as a baseline during the pre-screening, following the guide for analyzing such signals [3]. Assessing cybersickness was important for our study, because of a motion conflict between the visual scene of the VE and the body of the participant. As shown in Fig. 3, the visual scene was displayed stereoscopically from the perspective of the flying drone, mimicking the participant inside the drone to pilot it. In fact, the participant was stationary sitting on the chair to view the scene, as indicated in Fig. 2. The participant spent averagely 1.5 hours in the study, including time for the pre-screening, the 3 practice blocks, the 5 testing blocks, short breaks and answering questionnaires. The testing blocks were counterbalanced for all participants in a within-subject design. 2.4 Data Collection and Analyses
Objective and subjective data were collected in each testing block for analyses. Objective data were logged and had two parts for each participant. One part was logged by the Empatica wristband about the participant’s physiological signals, including the heart rate, body temperature, and electrodermal activity on the wrist skin. Another part was logged by the software application of the VE, including his/her task completion time and accuracy in identifying defects on the transmission line. Subjective data were derived from the participants’ responses to two questionnaires. Besides the responses to the cybersickness questionnaire, the 4-component questionnaire collected the subjective data conveyed each participant’s responses to questions on perceived usefulness, effectiveness, pleasure, and workload with the VE. The questions were constructive and related directly to the participant’s actions for consistent responses [7]. To record each response on the perceived usefulness, effectiveness, and pleasure, the questionnaire used a variation of the Likert scale [1]. The scale was a continuous horizontal bar bounded between 0% and 100%. The response was a vertical line on the bar drawn by the participant. In this way, the responses of the participant were not ordinal but interval data. The perceived workload was devised by using the NASA task load index (TLX) [17]. Both questionnaires were administrated to the participant after each testing block.
Data analyses on the objective and subjective data were underwent in three sequential steps. At first, part of the objective data and the responses to the cybersickness questionnaire were used to identify outliers. Secondly, the rest of the objective data were utilized together with all responses to the 4-component questionnaire to establish a baseline for using MLE [10]. Finally, these objective data were further employed to investigate the integration of both force and vibrotactile cues by using MLE, due to its frequent applications for multi-sensory integration [35].
In the first step, the average physiological signals of each participant were examined under each testing block for any abnormality against his/her baseline. Together with the participant’s responses to the cybersickness questionnaire, this examination assessed whether the participant suffered from cybersickness. If the participant had cybersickness, the analyses of his/her data were terminated. Otherwise, his/her logged data by the VE were analyzed for identifying outliers. These data were the number of pressing both buttons of the Omni stylus, the time instants and locations of the pressing along the transmission line, and the time instants and locations of delivering individual or combined cues were delivered. The system logged a defect identification, if the participant pressed both buttons within the 1.00
Figure 5: Profile examples of haptic cues for the testing blocks: (a) F_only;( b) V_co and V_dis; and (c) FV_co and FV_dis.
0 0.2 0.4 0.6 0.8 Fo rc e (N ) T ime (s) 0.25 1.00 s Continuous force Force cue 0.25 0 0.2 0.4 0.6 0.8 Fo rc e (N ) T ime (s) 0.25 1.00 s Vibrotactile cue 0 0.2 0.4 0.6 0.8 Fo rc e (N ) T ime (s) 0.25 1.00 s Vibrotactile cues Force and 0.25 s 0.25 s 0.25 s 0.25 s
...
...
...
...
...
...
(a) (b) (c)s interval of delivering a cue. This interval was long enough to cover both human response and reaction times that needed to perceive the delivered cue. The response time is approximately 0.05 s for force stimuli [14] and 0.60 s for vibrotactile stimuli [40]. Moreover, the reaction time is about 0.11 ~ 0.12 s for sensing these stimuli [2]. The summation of these response and reaction times is thus maximally 0.77 s, much less than 1.0 s for delivering a cue to ensure the participant’s identification of a defect. Outliers were the participants who could not identify at least 7 defects correctly (approximately 50% of the total number of defects on the transmission line). All the objective and subjective data of the outliers were then to be excluded from further analyses.
In the second step, the rest of the objective data and the subjective data from the 4-component questionnaire were to establish a baseline for using MLE. The objective data were related to task performance including task completion time and accuracy in identifying defects. The subjective data of the perceived usefulness were converted from the variation of the Likert scale to numeric for comparison. So were the subjective data of the perceived effectiveness and pleasure. The subjective data of the perceived workload were numeric answers to the NASA TLX.
These objective and subjective data were statistically compared among all testing blocks. The statistical method for the comparisons was one-way repeated measures analysis of variance (ANOVA) [26]. Any significant difference derived from the ANOVA analyses was further evaluated by utilizing the Bonferroni post-hoc test [26]. The data eligibility for an ANOVA analysis was verified through the Anderson-Darling normality test [13]. All of these analyses served to establish a baseline for using MLE.
In the last step, the rules of MLE were applied to the logged task performance for the eligible participants. The application followed the requirements and computations of MLE, as described in its tutorial [35]. An equal weight was set for both force and vibrotactile cues in their integration, due to the unavailability of cue weighting information. This examined a suitability of MLE for the integration. 3 RESULTS
The analyses of the first step indicated that none of the participants had cybersickness, evident by their logged physiological signals and responses to the cybersickness questionnaire. All participants passed the assessment of outliers, declaring more than 50% of the defects. That is, there were no outliers among the participants. Hence, both objective and subjective data of all participants were used for further analyses.
For the second step, normality tests on both objective and subjective data showed that all of these data were normally distributed and thus ensured their eligibility for the ANOVA analyses. Considering objective data, Fig. 6 depicts the average task completion time for each testing block. An ANOVA analysis of the completion time revealed no significant difference among all testing blocks [F(4, 49) = 1.39; p > 0.05]. However, an ANOVA analysis on the accuracy of identifying defects yielded a significant difference among all testing blocks [F(4, 49) = 4.53; p < 0.05]. Fig. 7 illustrates the average accuracy for each testing block. Post-hoc analyses indicated that 3 pairs of the testing blocks (F_only vs. V_co; F_only vs. V_dis; and F_only vs. FV_dis) were differentiable in the task accuracy. Defect identification was significantly more erroneous in the F_only block than the V_co, V_dis and FV_dis blocks.
Table 1 summarizes the analysis results of subjective data. ANOVA analyses on the perceived usefulness and workload revealed no significant difference among all testing blocks. In contrast, a significant differentiability was observed for each perceived pleasure and effectiveness. Post- hoc tests revealed a significant difference of the perceived pleasure and effectiveness between the F_only block and every other testing block. All
observations of this step indicated that the presence of the vibrotactile cue promoted a better accuracy, effectiveness, and pleasure than the force cue alone. This agreed with the existing reports on tactile cues for sensing surfaces [23], herein setting a baseline for using MLE.
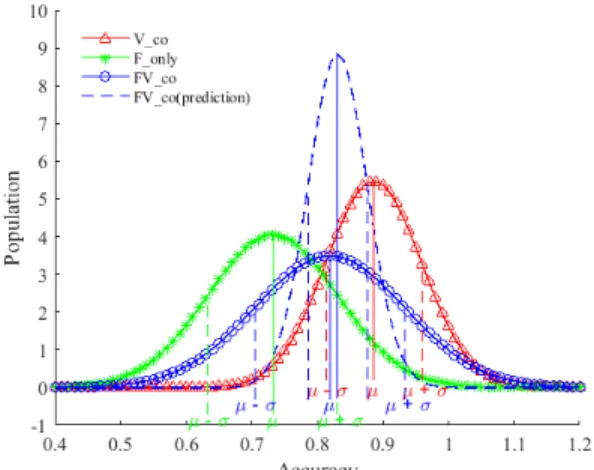
In the last step, the task performance was examined according to the rules of MLE [35]. The examination focused on the accuracy of identifying defects in all testing blocks, because the completion time was non-differentiable. An experimentally estimated Gaussian distribution was yielded by applying the function of MLE to the average accuracy of every testing block. Each Gaussian distribution was characterized by its mean, , and standard deviation, . As illustrated in Fig. 8, the Gaussian distribution of the FV_co block overlapped evenly with those of both V_co and F_only blocks under the co-located setting. Visual inspection indicated that the mean of the FV_co block was within one standard deviation from the means of both V_co and F_only blocks. The FV_co block had
Figure 6: Average task completion time. [Error bars are standard errors.]
Figure 7: Average accuracy in detecting the defects on the transmission line. [Error bars represent standard errors. The symbols of * and ** denote Bonferroni significant differences with p < 0.01 and p < 0.001, respectively.]
Table 1: The means, standard deviations of the subjective data and the results of ANOVA analyses among all testing blocks.
Subjective data
Testing Blocks
(mean ± standard deviation) ANOVA
F_ only V_ co V_ dis FV_ co FV_ dis F(4, 49) p < 0. 05 Usefulness (%) 76 ± 15 73 ± 8 75 ± 9 74 ± 11 77 ± 9 0.58 — Effectiveness (%) 62 ± 22 73 ± 11 75 ± 13 73 ± 11 74 ± 11 3.77 Pleasure (%) 56 ± 21 71 ± 12 72 ± 12 72 ± 13 75 ± 12 3.95 Workload 116 ±30 109 ±31 104 ±34 110 ±46 107 ±32 0.52 — 0.0 2.0 4.0 6.0
F_only V_co V_dis FV_co FV_dis
Task com pletion tim e (m in) 60% 70% 80% 90% 100%
F_only V_co V_dis FV_co FV_dis
Per
the lowest magnitude with the widest standard deviation, whereas the V_co block had the highest magnitude and the narrowest standard deviation. Both magnitude and standard deviation of the F_only block fell between those of both FV_co and V_co blocks. Moreover, the mean of the FV_co block was very similar to that of a predicted distribution, which combined theoretically both cues by the rules of MLE. The same was not observed for the magnitude and standard deviation.
However, Fig. 9 portraits a different picture about the integration under the dislocated setting. The Gaussian distribution of the FV_dis block overlapped much more that of the V_dis block than the F_only block. Visual inspection revealed that the mean of the FV_dis block was within one standard deviation from the mean of the V_dis block, but far beyond one standard deviation from the mean of the F_only block. The magnitude and standard deviation of the FV_dis block were the highest and narrowest among all three blocks, followed by those of the V_dis block and the F_only block in sequence. Moreover, the mean of the predicted distribution for combining both cues was much smaller than that of the FV_dis block, although with the similar magnitudes and standard deviations.
4 DISCUSSION
Navigation of a flying object is a ubiquitous task of 3D user interaction. Visual cues aid the navigation to a certain degree, while an additional force or vibrotactile cue is often used to enhance user experience in navigation [6, 34]. Flying a drone for defect
identification along a transmission line has potential applications in engineering practice, but induces the need of integrating these haptic cues for 3D interaction. This study is the first attempt towards theorizing a generic mechanism underlying the integration of these cues for intuitive 3D user interaction within VEs. There are two aspects to distinguish this study from existing work [12, 28, 29, 32, 33]. One aspect is different user tasks. The task of this study is related to 3D user interaction – identifying defects while navigating a flying drone. The existing work utilize 2D tasks such as stiffness discrimination and tool steering. Another aspect is the level of modelling cue integration. The study explores a generic mechanism underlying the integration of force and vibrotactile cues, whereas the existing work utilizes task-specific models to implement both force and cutaneous cues together. A generic mechanism would be useful for 3D user interaction by simulating the integration of force and vibrotactile cues within VEs.
The results of the study revealed that the task completion time was not differentiable among all testing blocks. That is, the completion time was independent of the individual and/or combined cues for identifying the defects, because there was the same number of the defects for any combinations of the cues. A better accuracy of identifying the defects was achieved under the presence of the vibrotactile cue however. Consequently, the task performance including both completion time and accuracy was increased because of the vibrotactile cue. In addition, the vibrotactile cue promoted the perceived effectiveness and pleasure. The vibrotactile cue is more applicable compared to the force cue alone for the task. This observation is in agreement with existing studies on tactile cues for sensing surfaces [23]. Although the role of the continuous force was unexplored in the present study, this agreement established a baseline for examining the integration of both force and vibrotactile cues.
This integration was examined by using the rules of MLE, because both VE and task together fulfilled all 5 requirements of the rules [35]. Due to the non-differentiable completion time among all testing blocks, the rules were applied to the task accuracy under both co-located and dislocated settings. Although logged by the VE, the task accuracy reflected the perceptual declarations of all participants on identifying defects. Each declaration was signaled by pressing both buttons on the Omni stylus when they perceived an individual or combined cues. As depicted in Fig. 8 and Fig. 9, the individual force or vibrotactile cue of the F_only, V_co, and V_dis blocks yielded experimentally estimated Gaussian distributions of the task accuracy. The distributions of both V_co and V_dis blocks had larger means, higher magnitudes and narrower standard deviations than that of the F_only block. This indicates that the human participants consider the vibrotactile cue more certain than the force cue for identifying the defects.
In the co-located setting, the rules of MLE appear to be followed in a certain degree. As illustrated in Fig. 8, the experimentally estimated Gaussian distribution of the FV_co is most likely related to the combination of those of both V_co and F_only blocks. This is confirmed by the similar means of both predicted and estimated distributions of the FV_co block. The distributions of the FV_co block are neither biased towards that of the V_co block nor that of the F_only block. That is, the human participants interpret both force and vibrotactile cues combinable. This is much in the same way as multi-sensory integration of visual and haptic cues [10]. However, the combination of both force and vibrotactile cues is not optimal, due to the different magnitudes and standard deviations between the FV_co block and its predicted counterpart. Since the area under each Gaussian distribution is same according to the computation of MLE, the higher magnitude of the distribution is accompanied with a narrower standard deviation. This explains the observation that the Gaussian distribution of the FV_co block had the lowest magnitude but widest standard deviation. The
Figure 8: MLE for the co-located setting.
observation reflects the increased accuracy in accordance with the addition of the vibrotactile cue to the force cue in a co-located fashion, as depicted in Fig. 7. Uncertainty underlying the identification of the defects remains unresolved due to the widest standard deviation of the FV_co block. This uncertainty could reflect three possible issues. The first issue might be the demand of complex mental efforts to interpret the combined cues in a spatial proximity than one cue only. The second issue could be related to the influences between force and vibrotactile cues due to this proximity. The last issue would be unknown mechanoreceptors involved in the combined cues. Further work is necessary to explore these issues.
The same combination of both force and vibrotactile cues was not observed in the dislocated setting. As shown in Fig. 9, the distribution of the FV_dis block has a similar shape with that of the predicted distribution. Their means depart significantly. The mean of the Gaussian distribution of the FV_dis block was much larger than those of both V_dis and F_only blocks. The distribution of the FV_dis block biased more towards the V_dis block than the F_only block. Interestingly, this was accompanied with a higher magnitude and a narrower standard deviation of the FV_dis block than those of both V_dis and F_only blocks. These observations suggest that the combination of both force and vibrotactile cues is biased more towards the vibrotactile than the force cue, albeit with increased certainty of the identification. This disagrees with the rules of MLE, because the mean of the FV_dis block is larger than those of both V_dis and F_only blocks as well of the predicted distribution. The role of the individual force cue seems however to have not been ignored entirely, as the distribution of the FV_dis block has a much similar standard deviation as that of the predicted distribution.
Compared with the FV_dis block, the distribution of the FV_co block had a smaller mean, lower magnitude, and wider standard deviation. This observation implies that the co-located setting is less efficient than the dislocated setting for identifying the defects. This contradicts with common observations that co-located cues improve task performance [21, 38]. The contradiction might be rooted in two factors. One factor is related to the difference of sensory activation. Force as a kinesthetic cue stimulates mostly proprietorial sensors at the joints and tendons, whereas vibration as cutaneous cue activates sensitively corpuscles underneath the skin and in the muscles [23]. Another factor might contribute to different cognitive processes for the force and vibrotactile cues. In particular, various intensities of each cue might contribute to different degrees of perceiving the combined cues. It is also possible that the presence of the continuous force reduces the efficient perception of the force cue. Furthermore, the visual scene of the flying drone along the transmission line involves changes in position of the clamp with respect to the line. These changes could influence the integration of both force and vibrotactile cues, as reported in literature [21]. Further investigation is warrant to explore these interesting topics.
At certain degrees, the combination of both force and vibrotactile cues follows the rules of MLE as the integration of multi-sensory cues [10, 35], visual disparity and texture cues [18], and force and position cues [21]. However, unique particularities observed in this study prevent from combining force and vibrotactile cues optimally. This indicates an inconclusiveness of MLE for integrating the force and vibrotactile cues in the co-located setting, especially giving both cues equal weight in the integration. Thus, it is unconvincing to apply MLE to simulate the integration of co-located force and vibrotactile cues for 3D user interaction within VEs. More work is needed to investigate the applicability of MLE under various weights of both cues and other mechanisms (for example, information integration theory and signal detection theory) for the integration of force and vibrotactile cues.
5 CONCLUSION
The present work assessed the suitability of MLE for integrating force and vibrotactile cues, two sub-categorical cues of the haptic modality. This indicates an inconclusiveness of applying MLE to simulate the integration of force and vibrotactile cues for 3D user interaction within VEs. Future work will investigate unique particularities arose from the integration of both cues and the applicability of other mechanisms for the integration.
REFERENCES
[1] E. Allen and C. A. Seaman. Likert scales and data analyses. Quality Progress, 40(7):64–65, 2007.
[2] R. Boff, and J. E. Lincoln. Engineering Data Compendium. Human Perception and Performance. Armstrong Aerospace Medical Research Laboratory, Wright-Patterson AFB, OH, 1988.
[3] J. Braithwaite, D. Watson, R. Jones, and M. A. Rowe. A guide for analysing electrodermal activity skin conductance responses for psychological experiments. Psychophysiology, 49:1017–1034, 2015. [4] J. D. Brown, R. Gillespie, D. Gardner, and E. A. Gansallo. Co-location of force and action improves identification of force-displacement features. In IEEE Haptics Symp., pages 187–193, 2012.
[5] J. D. Brown and R. B. Gillespie. The effect of force/motion coupling on motor and cognitive performance. In IEEE World Haptics, pages 197–202, 2011.
[6] J. Cacace, A. Finzi, and V. Lippiello. A mixed-initiative control system for an Aerial Service Vehicle supported by force feedback. In IEEE/RSJ Int'l Conf. on Intelligent Robots and Syst., pages 1230-1235, 2014.
[7] P. Cairns. Experimental methods in human-computer interaction. In Encyclopedia of Human-Computer Interaction, M Soegaard, and R. F. Dam, Interaction Design Foundation, second edition, 2016. [8] H. Q. Dinh, N. Walker, L. F. Hodges, C. Song, and A. Kobayashi.
Evaluating the importance of multi-sensory input on memory and the sense of presence in virtual environments. In IEEE VR, pages 222– 228, 1999.
[9] L. Dupin, V. Hayward, and M. Wexler. Co-location of force and action improves identification of force-displacement features. Proc. of National Academy of Sciences, 112(2):619–624, 2015.
[10] M. Ernst and M. Banks. Humans integrate visual and haptic information in a statistically optimal fashion. Nature, 415(6870):429– 433, 2002.
[11] I. Farkhatdinov, N. Ouarti, and V. Hayward. Haptic motion: Improving sensation of self-motion in virtual worlds with force feedback. In IEEE World Haptics, pages 677–681, 2013.
[12] L. Fichera, C. Pacchierotti, E. Olivieri, D. Prattichizzo, and L. S. Mattos. Kinesthetic and vibrotactile haptic feedback improves the performance of laser microsurgery. In IEEE Haptics Symp., pages 59– 64, 2016.
[13] C. Forbes, M. Evans, N. Hastings, and B. Peacock. Statistical Distributions. John Wiley Sons, 2011.
[14] Robert M. Gagne. Psychological Principles in System Development. Holt, Rinehart, and Winston Inc., 1962.
[15] S. Gallo, L. Santos-Carreras, G. Rognini, M. Hara, A. Yamamoto, and T. Higuchi. Towards multimodal haptics for teleoperation: Design of a tactile thermal display. In IEEE ADC, pages 1–5, 2012.
[16] O. Gerovichev, P. Marayong, and A. Okamura. The effect of visual and haptic feedback on manual and teleoperated needle insertion. In Medical Image Computing and Computer-Assisted Intervention, pages 147–154, 2002.
[17] S. G. Hart. Nasa-task load index (nasa-tlx); 20 years later. Proc. Annu. Meeting of Human Factors Ergon, 50(9):904–908, 2006.
[18] J. M. Hillis, M. O. Ernst, M. S. Banks, and M. S. Landy. Combining sensory information: mandatory fusion within, but not between, senses. Science, 298(5598):1627–1630, 2002.
[19] R. S. Kennedy, N. E. Lane, K. S. Berbaum, and M. G. Lilienthal. Simulator sickness questionnaire: an enhanced method for quantifying simulator sickness. Int. J. Aviation Psychol., 3(3):203–220, 1993. [20] K. Kim, D. W. Rattner, and M. A. Srinivasan. Virtual reality-based
laparoscopic surgical training: The role of simulation fidelity in haptic feedback. Comput. Aided Surg., 9(5):227–234, 2004.
[21] D. Knut and M. O. Ernst. Integration of force and position cues for shape perception through active touch. Brain Research, 1078(1):92– 100, 2006.
[22] R. H. LaMotte. Softness discrimination with a tool. J. Neurophysiol., 83(4):1777–1786, 2000.
[23] S. J. Lederman and R. L. Klatzky. Haptic perception: A tutorial. Attention, Perception, Psychophysics, 71(7):1439–1459, 2009. [24] S. J. Lederman, A. Martin, C. Tong, and R. L. Klatzky. Relative
performance using haptic and/or touch-produced auditory cues in a remote absolute texture identification task. In Haptic Interfaces for Virtual Environment and Teleoperator Syst., pages 151–158, 2003. [25] K. E. MacLean. Designing with haptic feedback. In Robotics
Automation Conf., pages 783–788, 2000.
[26] D. C. Montgomery. Design and Analysis of Experiments. John Wiley & Sons, second edition, 2008.
[27] N. Ouarti, A. Lcuyer, and A. Berthoz. Haptic motion: Improving sensation of self-motion in virtual worlds with force feedback. In IEEE Haptics Symp., pages 167–174, 2014.
[28] C. Pacchierotti, M. Abayazid, S. Misra, and D. Prattichizzo. Steering of flexible needles combining kinesthetic and vibratory force feedback. In IEEE/RSJ Int. Conf. on Intelligent Robots and Syst., pages 1202–1207, 2014.
[29] C. Pacchierotti, A. Tirmizi, G. Bianchini, and D. Prattichizzo. Enhancing the performance of passive teleoperation systems via cutaneous feedback. IEEE Trans. on Haptics, 8(4):397–409, 2015. [30] D. Prattichizzo, C. Pacchierotti, and G. Rosati. Cutaneous force
feedback as a sensory subtraction technique in haptics. IEEE Trans. on Haptics, 5(4):289–300, 2012.
[31] A. Prez-Bellido, M. O. Ernst, S. Soto-Faraco, and J. Lpez-Moliner.
Visual limitations shape audio-visual integration. J. Vision, 15(12):1-15, 2015.
[32] Z. F. Quek, S. B. Schorr, I. Nisky, A. M. Okamura, and W. R. Provancher. Augmentation of stiffness perception with a 1-degreeof-freedom skin stretch device. IEEE Trans. on Human-Machine Systems, 44(6):731–742, 2014.
[33] Z. F. Quek, S. B. Schorr, I. Nisky, W. R. Provancher, and A. M. Okamura. Sensory substitution and augmentation using 3-degreeof-freedom skin deformation feedback. IEEE Trans. on Haptics, 8(2):209–221, 2015.
[34] X. Righetti, S. Cardin, D. Thalmann and F. Vexo, Immersive flight for surveillance applications. In IEEE Symp. on 3D User Interfaces, 2007, pages 139-142.
[35] M. Rohde, C. J. L. van Dam, and M. O. Ernst. Statistically optimal multisensory cue integration: a practical tutorial. Multisensory Research, 29(4-5):279–317, 2016.
[36] G. Rosati, F. Oscari, C. Pacchierotti, and D. Prattichizzo. Effects of kinesthetic and cutaneous stimulation during the learning of a viscous force field. IEEE Trans. on Haptics, 7(2):251–263, 2014.
[37] R. Sigrist, G. Rauter, R. Riener, and P. Wolf. Augmented visual, auditory, haptic, and multimodal feedback in motor learning: A review. Psychonomic Bulletin Review, 20(1):21–53, 2012.
[38] D. Swapp, V. Pawar, and C. Loscos. Interaction with collocated haptic feedback in virtual reality. Virtual Reality, 10(1):24–30, 2006. [39] M. Y. Tsalamlal, M. A. Amorim, J. C. Martin, and M. Ammi.
Combining facial expression and touch for perceiving emotional valence. IEEE Trans. on Affective Comput., pages Early Access Article – Online, 2016.
[40] R. T. Verrillo and R. L. Smith. Effect of stimulus duration on vibrotactile sensation magnitude. Bulletin of the Psychonomic Society, 8(2):112–114, 1976.
[41] J. M. Walker, A. A. Blank, P. A. Shewokis, and M. K. OMalley. Tactile feedback of object slip facilitates virtual object manipulation. IEEE Trans. on Haptics, 8(4):454–466, 2015.