The following scientific article was officially published in the Proceedings of the 11th
International Conference on Information Sciences, Signal Processing and their Applications
(ISSPA 2012), published by the IEEE. This article’s citation is as follows:
Adankon, Mathias M., Jean Dansereau, Hubert Labelle, and Farida Cheriet. “Analysis of
scoliosis trunk deformities using ICA.” In 11th International Conference on Information
Science, Signal Processing and their Applications (ISSPA), (2012): pp. 187-192.
doi:
10.1109/ISSPA.2012.6310543
The manuscript, as accepted by the publisher, is reproduced in the following pages.
© 2012 IEEE. Personal use of this material is permitted. Permission from IEEE must be
obtained for all other users, including reprinting/republishing this material for advertising
or promotional purposes, creating new collective works for resale or redistribution to servers
or lists, or reuse of any copyrighted components of this work in other works.
ANALYSIS OF SCOLIOSIS TRUNK DEFORMITIES USING ICA
Mathias M. Adankon, Jean Dansereau, Hubert Labelle and Farida Cheriet
Ecole Polytechnique de Montreal, Montreal, Canada
Sainte-Justine Hospital Research Center, Montreal, Canada
ABSTRACT
This paper describes a method for analyzing scoliosis trunk deformities using Independent Component Analysis (ICA). Our hypothesis is that ICA can capture the scoliosis defor-mities visible on the trunk. Unlike Principal Component Analysis (PCA), ICA gives local shape variation and as-sumes that the data distribution is not normal. 3D torso images of 56 subjects including 28 patients with adoles-cent idiopathic scoliosis and 28 healthy subjects are an-alyzed using ICA. First, we remark that the independent components capture the local scoliosis deformities as the shoulder variation,the scapula asymmetry and the waist deformation. Second, we note that the different scoliosis curve types are characterized by different combinations of specific independent components.
1. INTRODUCTION
Independent Component Analysis (ICA) is a statistical me-thod which attempts to express the observed data with a linear combination of mutually independent variables [8]. ICA finds the independent components, also called source, by maximizing the statistical independence of the estimated components. Many approaches are proposed in order to define independence, and present the basis of ICA algorithms. The important propositions can be divided into two main ideas:
1) Minimization of Mutual Information, where measures like Kullback-Leibler Divergence and maximum-entropy are used.
2) Maximization of non-Gaussianity, where kurtosis (fourth-order cumulant) and negentropy are used.
ICA was originally developed to deal with blind source separation problem. Since the recent increase of interest in ICA, various applications are designed based on this statistical technique. Among them, we have feature ex-traction or data representation, which consist of comput-ing a small vector representation of data (sound, image, etc) [11, 18, 4].
Mathias Adankon , Jean Dansereau and Farida Cheriet are with Ecole Polytechnique de Montreal, Montreal, Canada. (email: mathias-mahouzonsou.adankon@polymtl.ca, jean.dansereau@polymtl.ca, farida.cheriet@polymtl.ca) Hubert Labelle is with Sainte-Justine Hospital Research Center, Montreal, Canada (email: hubert.labelle@recherche-ste-justine.qc.ca). This work was sup-ported by the GRSTB, the MENTOR program and the CIHR (Canadian Institutes of Health Research)
Recently, ICA is used for image segmentation task [17] and medical image analysis [6, 10, 21]. Boquete et al. [6] have proposed a thermographic image analysis based on ICA for automated detection of high tumor risk areas. Hassen et al [10] used ICA to built cardiovascular disease diagnosis based on magnetic resonance imaging. ICA in a high-dimensional space with sparse data was applied to landmarked 3D shapes resulting from the aortic seg-mentation. The aortic shape variations were captured by the independent components which are sorted using prior knowledge. The simple classification task in the 2D space spanned by the two first independent components was per-formed by a simple quadratic classifier. In [21], ICA is used to construct myocardial contraction shape analysis. A classification algorithm was built from the ICA compo-nents in order to automatically detect and localize abnor-mally contraction regions of the myocardium.
In this work, we propose to analyze 3D image of sco-liosis trunk based on ICA in order to detect local scolio-sis deformation on trunk. Adolescent idiopathic scolioscolio-sis (AIS) is a deformity of the spine manifested by asymme-try and deformities of the external surface of the trunk. It consists of a complex curvature in the three-dimensional space where the vertebrae rotation causes the distortion of the ribcage and the development of a hump on the back.
Human torso shape has many variations, and its anal-ysis is very challenging. Usually, section decomposition method is used with cross section modeling [14, 1]. The 3D image of the trunk is divided by cross section and each section is characterized by mathematical tools in order to extract some descriptors. Jaremko and al. [15, 16] pro-posed to compute from each cross-section the indexes de-scribing back surface rotation, torso centroid line, princi-pal axis orientation and half-area assymetry. In their stud-ies, they show that these indexes are correlated to the in-ternal deformity (spine). Cross-section decomposition is also used in [3] where each cross section is modeled as B-spline curve and dominant points are extracted to form the features vectors. Other technique used in the literature is orthogonal map. This technique consists to transform orthogonally the 3D image of the trunk by using certain 3D transform. In [2], the authors compute torso defor-mation indexes by using four transforms which are axial line, unfolded cylinder, enclosing cylinder and subtracting cylinder. Torso shape analysis is also performed by using machine learning techniques. Self-organizing Neural Net-works (SNN) is used to parameterize the torso deformity [13].
However, many of previous techniques are developed in order to establish the relationship between the torso de-formity and the spinal dede-formity, and the results are miti-gated.
Our hypothesis is that scoliosis patients have external deformities which vary from important asymmetries of the trunk to local subtle deformations. A statistical analysis method like ICA will be used to detect and recognize lo-cal scoliosis deformations on the trunk. Also, the scoliosis trunk analysis proposed in this paper can be used to diag-nosis scoliosis trunk by building a local probability den-sity function for each Independent Component.
This paper is structured as follows. In Section 2, we describe the materials and the methodology used in this study. In Section 3, we present the experiments and re-sults. We conclude this paper in Section 4.
2. MATERIALS AND METHODS 2.1. Data acquisition
Since many years, the acquisition of the trunk surface to-pography is part of the routine evaluation of scoliosis pa-tients at Sainte-Justine University Hospital Center (SJUHC) in Montreal (Canada). The acquisition system is com-posed of four optical digitizers (CREAFORM, Montreal, Canada). Each optical digitizer contains one color CCD camera and a structured light projector. The acquisition process of each digitizer is as follows. Four fringe pat-terns, obtained by phase-shifting technique, are succes-sively projected onto the surface. Based on the four result-ing images and triangulation technique, the system com-putes the depth of each surface point relative to the refer-ence plane. A fifth image, with no fringes, acquires the texture of the surface which is then mapped onto the 3D reconstruction.
For the reconstruction of the whole trunk, four scan-ners are placed around the patient (on the front, on the back and at±60◦
laterally in front of the patient). Each digitizer reconstructs a portion of the trunk. During the ac-quisition, approximately 4 seconds, the patient stands still in the upright position with the arms slightly abducted in order not to obstruct the lateral scanners fields of view. Based on a multi-head calibration of the system that com-putes the rigid transformations between the digitizers, the 4 portions of the trunk are registered and merged using EM software. The resulting mesh is constituted of 40,000 to 70,000 nodes, depending on the size of the patient. The accuracy of this system was evaluated in [20], using mark-ers placed on a mannequin whose coordinates were previ-ously recorded by a computer measuring machine. The results showed a reconstruction accuracy of 1.4 mm over the whole torso and of 0.56 mm over the back.
2.2. Features Extraction
First of all, some pre-processing steps are performed be-fore applying ICA, the training trunks have been aligned in order to remove unwanted variation. In this study, Gen-eralized Procrustes alignment [9] is used for this task where a registration is done using isomorphic scaling, transla-tion, and rotation.
Before alignment, each 3D image of scoliosis trunk is decomposed into 800 points (20 sections and 40 points per section) and the vector feature is built with all coordinates (x, y, z) for each point. Thus, each torso is represented by one vector whose length is2400 = 800 × 3.
In general, analyzing object based on statistical meth-ods with an important number of features is not recom-mended because working in high-dimensional space in-volves the curse of dimensionality problem. For this pur-pose, PCA is used to reduce the dimensionality of the data. Figure 1 illustrate each step of the features extraction pro-cess from 3D image to features vector with 20 compo-nents.
2.3. Dimensionality reduction
In this study, PCA is used in order to reduce features di-mensionality. PCA is a mathematical technique that uses an orthogonal transformation to convert a number of (pos-sibly) correlated variables into a (smaller) number of un-correlated variables. However, PCA focus on the compo-nents which provide a large variation and has not capacity to preserve the small variability. Thus, we select 20 com-ponents which provides the maximum of the total variance (99%). Moreover, we verify the quality of the information contained in these components by testing the discrimina-tion between the scoliosis curve type through cluster anal-ysis.
Cluster analysis is performed using hierarchical clus-tering algorithm where the number of classes is not set in advance. After performing clustering analysis, a hierar-chy of clusters was built with many levels, we show the dendrogram in Figure 2. The Distribution of the subjects among the classes is presented in Table 1. We note that the selected principal components are efficient to contain the discriminative information of the different scoliosis curve type (thoracic major curve, lumbar major curves) and healthy subjects.
2.4. ICA modeling
Let us consider a datasetD comprising ℓ samples {x1, . . . , xℓ}
with xi ∈ Rd. ICA attempts to find a linear
transforma-tion :
X= As (1)
where the statistical independence between the variables s= (s1, . . . , sn) is maximized. The random variables s
are called independent components (ICs), with si ∈ Rd,
and A∈ Rℓ×nis mixing matrix.
Thus, each sample xi of a dataset D is represented
by a sum of the independent components weighted by the
Fig. 1. Features Extraction Process: (a) 3D Trunk image; (b) Cloud of 800 points; (c) Vector with 2400 components; (d) 20 Components resulting from PCA.
495056483847522429553031423334463640535143233537412532392628274445 1 5 21922 621 915121720 3 7131114 8 454101618 0 10 20 30 40 50 60 70
Fig. 2. Hierarchical clustering tree.
Table 1. Distribution of the patients among the classes found by hierarchical clustering analysis. One sample is viewed like outlier.
Classes Curve type # patients
Class 1 Lumbar major 6/7
Class 2 Thoracic major 9/13 Class 3 Thoracic major 5/7
Class 4 Healthy 3/3
Class 5 Lumbar major 2/2
Class 6 Healthy 18/18
Class 7 Healthy 4/5
elements of the mixing matrix A: xi=
n
X
k=1
Aiksk (2)
The previous definition is a common classical
defini-tion of ICA. However, it seems impossible to find a lin-ear transformation that gives strictly independent compo-nents. Thus, in practice, some assumption is made on the data with a specific definition of the function that mea-sures independence.
The following fundamental restrictions (in addition to the basic assumption of statistical independence) are im-posed in order to assure the identifiability of the ICA model: a)All the independent components siwith the possible
ex-ception of one component, must be non-Gaussian. b)The number of observed data ℓ must be at least as large as the number of independent components n, i.e., ℓ≥ n. c)The matrixA must be of full column rank.
The statistical independence is the main key in all the algorithms design to perform ICA. Usually, an objective function for ICA is chosen and optimized. In the liter-ature, we found various methods based on different ob-jective function like measure of Nongaussianity (principle used by the FastICA [12]), Minimization of Mutual
Infor-mation [5], Maximum Likelihood EstiInfor-mation [7]. Maxi-mum likelihood estimation is a very popular approach for estimating the ICA model. This technique is also con-nected to the infomax principle and it is shown in [19] that this method is essentially equivalent to minimization of mutual information.
ICA is applied to training data using the FastICA algo-rithm [12]. The independent components s= (s1, . . . , sn)
and the projection of the training data (mixing matrix A) in the ICA space are estimated by maximizing the statisti-cal independency. FastICA algorithm uses a fixed-point iteration technique which provides an accurate solution with a fast convergence. At each iteration, the algorithm finds one of all nongaussian independent components re-gardless of their probability distributions. It is 10-100 times faster than the other ICA algorithms which are based on conventional gradient descent method.
3. EXPERIMENTS 3.1. Dataset and experimental setup
The dataset consisted of 3D torso images of 56 subjects including 28 patients with adolescent idiopathic scoliosis (15 thoracic curves and 13 lumbar curves) and 28 healthy subjects who come to clinic because of their trunk appear-ance. The 3D trunk image and the radiography have been acquired at the same visit for each patient. The diagnosis of each individual is performed by an orthopedic surgeon from the X-ray images.
3.2. Scoliotic trunk analysis
We ran FastICA algorithm on the 56 samples represented by 20 features, we obtained 19 independent components (s1, s2, ..., s19).
ICA decomposes shapes into local shape descriptors [21]. In Figures 3, we plot ICA modes for pointing out the ICA capacity to capture local deformation. The k− th mode of trunk shape variation is defined by:
zk= µ + skδ (3)
where µ is the mean shape and δ= 3σkis three times the
value of the variance of corresponding weight computed with the mixing matrix A.
σk= V ar(A1k, A2k, ..., Aℓk) (4)
In this study, we used three different representations of data corresponding to three spaces: shape space (cloud of points), PCA space (20 components) and ICA space (19 components). The projection through the three spaces are done according to the following equations:
XP CA= µICA+ XICA∗ S (5)
XShape= µP CA+ XP CA∗ V (6)
where
S is the matrix of the independent components; V is the matrix of the principal components;
µICAis the mean vector of ICA model;
µP CAis the mean vector of PCA model;
XShape= (x1, y1, z1, x2, y2, z2, ..., x800, y800, z800).
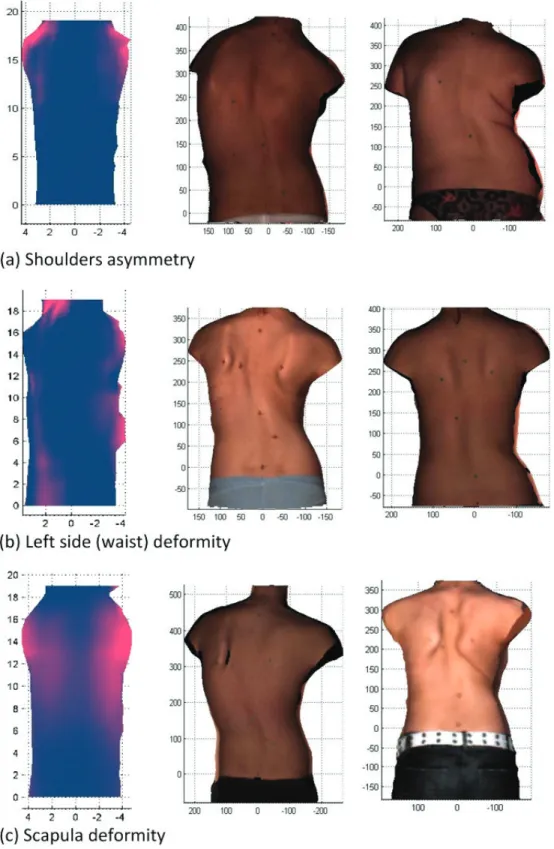
The local deformation captured by each IC is coded in color (the mean shape is in blue and the deformation is in red) with respect to the mean shape value. Figure 3 shows different IC which capture the shoulder varia-tion,the scapula asymmetry and the waist deformation. Also, the prototypes trunk that illustrate each local deformation captured by the ICs are shown. These prototypes are se-lected by using the mode of the corresponding weight con-tained in the mixing matrix.
3.3. Analysis of scoliosis curve type with respect to the independent components
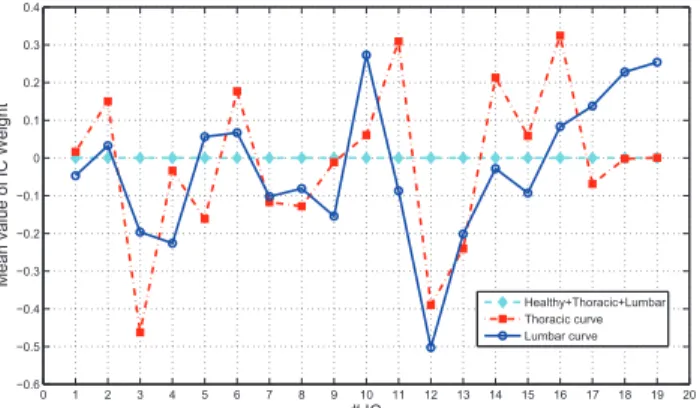
In this section, we analyzed the behavior of each indepen-dent component according to scoliosis curve type. The mean value of each IC weight is computed with respect to the scoliosis curve type (thoracic and lumbar curves). The results are shown on Figure 4. We note that among the nineteen components, eleven components (IC#2, 3, 5, 6, 7, 8, 11, 12, 13, 14, 15) are identified as capturing the deformation of the trunk of the patients who have thoracic curve and ten components (IC#3, 4, 7, 9, 10, 12, 13, 17, 18, 19) for the deformation of the trunk of the patients who have lumbar curve. Considering the significance of the components, the IC#11 which corresponds to the scapula deformation have a high weight for thoracic curve. In fact, thoracic curve causes often the ribcage distortion which produces the scapula deformation.
0 1 2 3 4 5 6 7 8 9 10 11 12 13 14 15 16 17 18 19 20 −0.6 −0.5 −0.4 −0.3 −0.2 −0.1 0 0.1 0.2 0.3 0.4 # IC Me a n va lu e o f IC W e ig h t Healthy+Thoracic+Lumbar Thoracic curve Lumbar curve
Fig. 4. Comparison of the weight of each independent component w.r.t. scoliosis curve type.
4. CONCLUSION
Scoliosis is a three-dimensional deformity of the spine and the ribcage. This deformity affects the torso and causes an apparent deformation of the external trunk surface. The 3D trunk image is constituted of a 55,000 points in aver-age. Thus, the trunk image analysis using directly the row data is a challenging task and the design of an efficient analysis framework could be useful.
Fig. 3. Illustration of three independent components which capture the shoulder asymmetry,the scapula deformity and the waist deformation.
In this work, trunk analysis is performed based on ICA which has the capacity to capture the local deformity. Un-like PCA, which gives a global shape variation (principal direction of the data), ICA can be exploited to detect
lo-cal shape deformities. We find that the lolo-cal scoliosis de-formities as the shoulder variation,the scapula asymmetry and the waist deformation are captured by the independent components.
Concerning scoliosis diagnosis, it will be interesting to select the dominant independent components which cap-ture the scoliosis deformities. Then, the follow up will be performed by analysing the variation of the weight of these components based on the assumption that they are independent statistically. Also in future work, the study will be extended to the double major curve which analy-sis is more complex than the simple curve like thoracic or lumbar curve.
References
[1] Mathias M. Adankon, Hubert Labelle, Jean Dansereau, and Farida Cheriet. Scoliosis curve type classification from 3d trunk image using kernel ma-chine. In SPIE Medical Imaging, 2012.
[2] P.O. Ajemba, N.G. Durdle, D.L. Hill, and V.J. Raso. Classifying torso deformity in scoliosis using or-thogonal maps of the torso. Medical and Biological Engineering and Computing, 45(6):575–584, june 2007.
[3] P.O. Ajemba, N.G. Durdle, and V.J. Raso. Character-izing torso shape deformity in scoliosis using struc-tured splines models. Biomedical Engineering, IEEE Transactions on, 56(6):1652 –1662, june 2009. [4] K. Bae, S. Noh, and J. Kim. Iris feature extraction
using independent component analysis. In Audio-and Video-Based Biometric Person Authentication, pages 1059–1060. Springer, 2003.
[5] A.J. Bell and T.J. Sejnowski. An information-maximization approach to blind separation and blind deconvolution. Neural computation, 7(6):1129– 1159, 1995.
[6] L. Boquete, S. Ortega, J.M. Miguel-Jim´enez, J.M. Rodr´ıguez-Ascariz, and R. Blanco. Automated de-tection of breast cancer in thermal infrared images, based on independent component analysis. Journal of Medical Systems, pages 1–9, 2010.
[7] J.F. Cardoso. High-order contrasts for indepen-dent component analysis. Neural computation, 11(1):157–192, 1999.
[8] P Comon. Independent component analysis, a new concept ? Signal Processing, Elsevier, 36(3):287– 314, 1994.
[9] J.C. Gower. Generalized procrustes analysis. Psy-chometrika, 40(1):33–51, 1975.
[10] Michael Hansen, Fei Zhao, Honghai Zhang, Nicholas Walker, Andreas Wahle, Thomas Scholz, and Milan Sonka. Detection of connective tissue disorders from 3d aortic mr images using indepen-dent component analysis. In Reinhard Beichel and Milan Sonka, editors, Computer Vision Approaches to Medical Image Analysis, volume 4241 of Lecture
Notes in Computer Science, pages 13–24. Springer Berlin / Heidelberg, 2006.
[11] P.O. Hoyer and A. Hyv¨arinen. Independent com-ponent analysis applied to feature extraction from colour and stereo images. Network: Computation in Neural Systems, 11(3):191–210, 2000.
[12] A. Hyvarinen, J. Karhunen, and E. Oja. Independent component analysis, volume 26. Wiley-Interscience, 2001.
[13] P. Igwe, M. Emrani, S. Adeeb, and D. Hill. Assess-ing torso deformity in scoliosis usAssess-ing self-organizAssess-ing neural networks (snn). In Machine Learning and Ap-plications, 2008. ICMLA ’08. Seventh International Conference on, pages 497 –502, dec. 2008.
[14] J. L. Jaremko. Estimation of Scoliosis Severity from the Torso Surface by Neural Networks. Ph.D. Thesis, Dept. Biomed. Eng., Univ. Calgary, 2003.
[15] J L Jaremko, P Poncet, J Ronsky, J Harder, J Dansereau, H Labelle, and R F Zernicke. Esti-mation of spinal deformity in scoliosis from torso surface cross sections. Spine (Phila Pa 1976), 26(14):1583–91, 2001.
[16] Jacob L. Jaremko, Philippe Poncet, Janet Ronsky, James Harder, Jean Dansereau, Hubert Labelle, and Ronald F. Zernicke. Indices of torso asymmetry related to spinal deformity in scoliosis. Clinical Biomechanics, 17(8):559 – 568, 2002.
[17] J. Koikkalainen and J. Lotjonen. Image segmenta-tion with the combinasegmenta-tion of the pca- and ica-based modes of shape variation. In Biomedical Imaging: Nano to Macro, 2004. IEEE International Sympo-sium on, pages 149 – 152 Vol. 1, april 2004. [18] J.H. Lee, H.Y. Jung, T.W. Lee, and S.Y. Lee.
Speech feature extraction using independent compo-nent analysis. In Acoustics, Speech, and Signal Pro-cessing, 2000. ICASSP’00. Proceedings. 2000 IEEE International Conference on, volume 3, pages 1631– 1634. Ieee, 2000.
[19] E. Oja and A. Hyvarinen. Independent component analysis: algorithms and applications. Neural Net-work, 13:411–430, 2000.
[20] V. Pazos, F. Cheriet, L. Song, H. Labelle, and J. Dansereau. Accuracy assessment of human trunk surface 3d reconstructions from an optical digitising system. Medical and Biological Engineering and Computing, 43(1):11–15, 2005.
[21] A. Suinesiaputra, A.F. Frangi, T. Kaandorp, H.J. Lamb, J.J. Bax, J. Reiber, and B. Lelieveldt. Auto-mated detection of regional wall motion abnormal-ities based on a statistical model applied to multi-slice short-axis cardiac mr images. Medical Imaging, IEEE Transactions on, 28(4):595 –607, april 2009.