Can rice farmers pay irrigation costs?
An investigation of irrigation supply costs and use value
in a case study scheme in Thailand
doi:10.1684/agr.2013.0660
To cite this article: Perret SR, Saringkarn P, Jourdain D, Babel MS, 2013. Can rice farmers pay irrigation costs? An investigation of irrigation supply costs and use value in a case study scheme in Thailand. Cah Agric 22: 385-92. doi :10.1684/agr.2013.0660
Correspondence: S. Perret
Abstract
Thailand is spending massive budgets in development and maintenance of irrigation systems for rice production. Along with tighter budgets and the ever-decreasing weight of agriculture in the domestic economy, debates are becoming more intense on the need for alternative, internalized modes of financing irrigation water supply, including farmer-targeted charging systems. This article investigates the correlation between the use value of irrigation water and the costs incurred by water supply, on a case study basis, in order to assess the feasibility of charging farmers for such costs. Climatic and production uncertainty was subject to sensitivity analysis (Monte Carlo). Analyses show that the use value (0.35THB/m3[1 Thai Baht = 0.03 US$]) exceeds total costs (0.1 THB/m3), meaning that farmers could theoretically pay for irrigation water supply. However, results were obtained under favourable production conditions. Furthermore, if farmers were to cover the total cost of irrigation, including capital costs (2,208 THB/ha/season), production costs would then increase by approximately 36% in both seasons. Also, farmers would lose approximately 36% of their net income as water charge in the wet season and 25% in the dry season. If farmers were to pay for operation and maintenance costs only (1,403 THB/ ha in both seasons), production costs would then increase by approximately 23%. In view of their low income, charging farmers is not feasible or acceptable. Besides, the study notes that farmers already pay pumping costs at field level, and are well aware of the value of water. This article further discusses alternative charging options, on a broader basis. A charging system spread throughout the rice chain, down to milling, retail, and export segments, proves to be acceptable; it may even include farmers, at low cost for them, and reinstate their status and active participation in the chain. The article also suggests that a broader ecosystem services approach may be used.
Key words: irrigation; production costs; rice; use value; productivity.
Subjects: economy and rural development; farming systems; vegetal productions; water.
Résumé
Les producteurs de riz peuvent-ils payer pour l'eau d'irrigation ? Une étude de cas sur les coûts d'irrigation et la valeur d'usage de l'eau en riziculture en Thaïlande En Thaı¨lande, le secteur public consacre des budgets tre`s importants au de´veloppement et au maintien des syste`mes rizicoles irrigue´s. Au regard de la compe´tition croissante pour l’allocation des moyens publics, du poids relatif de´croissant du secteur agricole dans l’e´conomie domestique, des de´bats se font jour concernant le besoin de nouveau modes de financement de l’irrigation, y compris par la facturation des services de l’eau d’irrigation aux riziculteurs. L’article e´tudie la valeur d’usage de l’eau d’irrigation en riziculture et l’ensemble des couˆts de l’approvisionnement en eau, sur la base d’une e´tude de cas, de fac¸on a` e´valuer la faisabilite´ d’une telle facturation. Les incertitudes lie´es a` la variabilite´ climatique ont e´te´ aborde´es par une analyse de sensibilite´ (Monte Carlo). Les analyses montrent que la valeur d’usage (0,35 THB/m3[1 Thaı¨ Baht = 0,03 US$]) de´passe les couˆts Sylvain-Roger Perret1
Peerasut Saringkarn2 Damien Jourdain1 Mukand Singh Babel3
1Cirad UMR G-Eau 73 Rue J-F Breton 34398 Montpellier cedex 5 France <[email protected]> <[email protected]> 2
TEAM Consulting Engineering and Management Co. Ltd.
151 Nuan Chan Road Nuan Chan Bueng Kum Bangkok 10230 Thailand <[email protected]> 3
Asian Institute of Technology School of Engineering and Management Po Box 4 Klong Luang 12120 Pathumthani Thailand <[email protected]>
Original Study
Background
and objectives
Irrigation systems in Thailand are publicly managed, developed, operat-ed, and supported. Approximately 10 billion dollars have been spent annu-ally by both Royal Irrigation Depart-ment (RID) and Rice DepartDepart-ment activities over the last 25 years ( Bud-haka et al., 2002; Warr and Kohpai-boon, 2007). Indeed, the public sector in Thailand covers investment costs, costs of extraction and supply (operation and maintenance), repairs and rehabilitation, new infrastructural developments, extension, technical advice, training, research and develop-ment of rice varieties and products, experimental stations, demonstration plots, and various ad-hoc financial support schemes for farmers.
In view of (1) the staggering costs incurred by water supply, irrigation services, operation, and maintenance in Thailand, and (2) the recurrent and controversial domestic and interna-tional debate on charging farmers for irrigation water use (Tiwari, 1998; Briscoe, 1999; Backeberg, 2006; Molle, 2007), this article investigates the correlation between irrigation water use value and irrigation costs. There are several justifications for assessing the value and price of irriga-tion water as an economic good, e.g. internalizing natural resource scarcity
effects and environmental externalities, equity objectives, supply cost recovery and financial viability, and improve-ment and modernization of services (Briscoe, 1997; Renzetti, 2000). In the context of Thailand, at least the three last initiatives are relevant (Perret, 2013). Thailand’s Irrigation Act of 1942 set up an official fee for irrigation water use (currently 0.5 THB/m3 [1 Thaı¨ Baht = 0.03 US$]). Yet, current-ly, no irrigation fee is charged and many farmers are not even aware of it. The goal of the research is to check whether farmers are able to pay for irrigation water and to fuel discussions on the opportunity and feasibility of alternative financing models of irriga-tion in Thailand. The article focuses on a case study in the central plains of Thailand where irrigation water value in production, rice farming perfor-mances, and irrigation costs are jointly investigated.
A case study: the
Sam Chuk project
in Suphan Buri
province, Thailand
The Sam Chuk irrigation scheme is based in the southwestern part of the central plains of Thailand (Suphan Buri Province), 150 km from
Bang-kok. It was constructed between 1942 and 1955, to serve various objectives: irrigation and drainage, flood control and water storage, and navigation. The management of water in Sam Chuk is under the responsibili-ty of the Regional Office No. 12 of the RID.
The climate of the area is classified as tropical humid, under monsoon in-fluence (tropical savannah). There are three seasons in a year: the rainy season from May to October (mon-soon; comprising 90% of all precipi-tation), the cold season from November to January, and the dry season from February to April. The total yearly precipitation amounts to 1,060 mm (1981-2010 average). The soil is black clay and loamy clay, suitable for most crops, including rice.
The project area is 58,626 hectares, of which 50,171 hectares are irrigable. Most of the command area is crop-ped and irrigated. Approximately 40,000 hectares are cropped with rice in both the dry and wet seasons. Paddy fields cover approximately 80% of the irrigated area, and vege-tables, fruit, and shrimp and fishponds cover the rest. The average yield of paddy fields is 5,300 kg/ha, which is higher than the national average of approximately 4,000 kg/ha under similar conditions.
Rice is grown twice, in two seasons: - major crop or wet-season crop: May or June to September or October;
totaux encourus (0,1 THB/m3), et donc que les producteurs pourraient potentiellement payer. Cependant, ces re´sultats ont e´te´ obtenus en conditions de production favorables. E´galement, si les producteurs devaient couvrir les couˆts totaux, y compris les couˆts d’investissement (2,208 THB/ha par saison), leurs couˆts de production augmenteraient alors de 36 % pour les deux saisons. Leur revenu net diminuerait alors de 36 % en saison humide et de 25 % en saison se`che. S’ils devaient couvrir uniquement les couˆts de fonctionnement et d’entretien, les couˆts de production augmenteraient de 23 %. Au regard de leurs revenus tre`s faibles, de tels surcouˆts ne sont pas envisageables. Par ailleurs, l’e´tude rele`ve que les producteurs paient de´ja` pour le pompage de l‘eau a` la parcelle et sont donc bien conscients de la valeur e´conomique de la ressource. La discussion aborde de possibles syste`mes alternatifs de financement. En particulier, un syste`me de facturation des services de l’eau d’irrigation qui inclurait d’autres acteurs en aval de la filie`re (moulins, export, de´taillants) est envisageable. En inte´grant les paysans, ce syste`me peut re´affirmer leur statut au sein de la filie`re, a` un couˆt acceptable. Enfin, une approche plus large par les services e´cosyste´miques est discute´e.
Mots cle´s : couˆt de production ; irrigation ; productivite´ ; riz de bas fond ; valeur e´conomique.
The`mes : eau ; e´conomie et de´veloppement rural ; productions ve´ge´tales ; syste`mes agraires.
- second crop or dry-season crop: December or January to March or April.
Irrigation consists of conveying water to tertiary canals that serve each bunded paddy field. Ponding condi-tions are usually sustained throughout the cycle, with about 10 to 15 cm of water kept in the paddy field via regular refilling. Water is lifted from canals to fields, usually 3 or 4 times during the growing season; short flexible pipes, fed by small portable diesel pumps, cross over the bunds and supply water to the paddies. Approximately 7,300 farmers operate in the scheme; all are primarily rice growers. Farms may be classified as small (<6 hectares), medium (6-10 hectares), and large (>10 hec-tares), and all three categories repre-sent approximately a third of surveyed farms. The farm size never exceeds 15 hectares. The median farm size is about 8 hectares.
Methodology
Economic value of water
in rice production
A sample of 20 representative farms was semi-randomly selected from the different 4 operation and mainte-nance (O&M) zones of the scheme, as advised by RID extension officers and farmers’ representatives during group discussions. A questionnaire was developed and applied to these farms, which enabled the collection of primary quantitative information on production, cropping practices, and factors, corresponding to both wet and dry cropping seasons in 2009-2010. Interviews with the same local experts provided access to additional information about the price of rice and inputs.
Estimation of water use was based upon irrigation water demand (IWD), as a proxy to actual water consump-tion for rice producconsump-tion. IWD was estimated using CropWat software (FAO, 1992) and a water balance model applied to paddy systems. Models required quantitative informa-tion on climate, soils, and local hydrology, which were drawn from documents of FAO, RID, Thailand’s Rice Department and Meteorological
Department. The modelling approach is the only solution when direct measure-ments of consumption are unavailable. Its main limitation is that it tends to homogenize results, while farmers’ water management practices may vary. A field application efficiency (Ea) of 0.7 (70%) was applied. Ea was calcu-lated from RID references for paddy fields. Ea is the ratio between IWD (crop water demand minus efficient rainfall) and gross irrigation supply (GIS) at field level. GIS includes percolation losses and lateral seepage (3.5mm/day), water used for land preparation (puddling before trans-planting or seedling), and IWD. Irri-gation system efficiency consists of efficiency of canal (Eb) and
convey-ance (Ec). Doorenbos and Pruitt
(1977) suggest that Eb and Ec are
equal to 0.8 and 0.775, respectively, in systems such as the Sam Chuk scheme. Calculation of the use value (or marginal value product; MVP) of irrigation water was computed using the Residual Imputation Method (Young, 2005). MVP is the income that may be ascribed to irrigation water. The sum of all variable produc-tion costs (i.e. labour, land, fertilizers, pesticides, machinery, and seeds, based upon market prices Pi and
quantity used Qi of production
fac-tors) is subtracted from total revenue (yield x market price); the residual amount (value) is ascribed to irrigation water, the only factor of which the value is unknown. This is performed by dividing the residual value by the quantity of irrigation water used, Qw, determined using CropWat.
Actual average market price for paddy at 25% moisture content was 7,800 THB/ton for the 2009/2010 dry season and 7,400 THB/ton for the 2010 wet season.
It should be noted that there were relatively good conditions (no pests or floods) during the seasons of 2009-2010, resulting in high yields. Accord-ing to farmers, such favourable condi-tions are not always met.
Costs of water services
at Sam Chuk
The costs incurred by irrigation water supply were estimated based on secondary data on capital costs, per-sonnel costs, main repairs and
im-provement costs, and regular O&M costs. For each cost item, initial value, salvage value, and area served (total = 50,171 hectares) were considered. Be-cause capital costs were spread over approximately 55 years, between 1937 and 1993 (initial construction, further expansions and developments, and heavy upgradings), the approach pro-posed by Perret and Geyser (2007) was used. All capital costs incurred and recorded between 1937 and 1993 were converted to an equivalent value corresponding to 1993, according to yearly inflation rates. The value for 1993 was subsequently converted to an equivalent value corresponding to 2012, according to an average yearly inflation rate of 5.1%.
A capital cost recovery factor (CRF) was applied to all capital costs (invest-ments during construction phase and further large development costs); a discount rate of 12% was used.
Results
and discussion
Consumption
of irrigation water
Data, calculations and modelling related to water use, production, production factors, and costs were combined to ultimately estimate the use value of water or the economic value derived by rice production at the farming system level.
According to calculations, irrigation water requirements amounted to 1,663 mm during the dry season of 2009-2010 (Standard Deviation [SD]: 6.31) and 1,012 mm during the wet season of 2010 (SD: 48.03).
‘‘Production to water use’’ ratio amounted to 0.32 and 0.52 kg of paddy rice/m3of irrigation water used during the dry and wet seasons, respectively. The high level of losses that was considered may explain the relatively high consumption at plot level.
Production performances
and costs
The production cost for rice included expenditure for seeds, machinery, fertilizers and pesticides, land costs
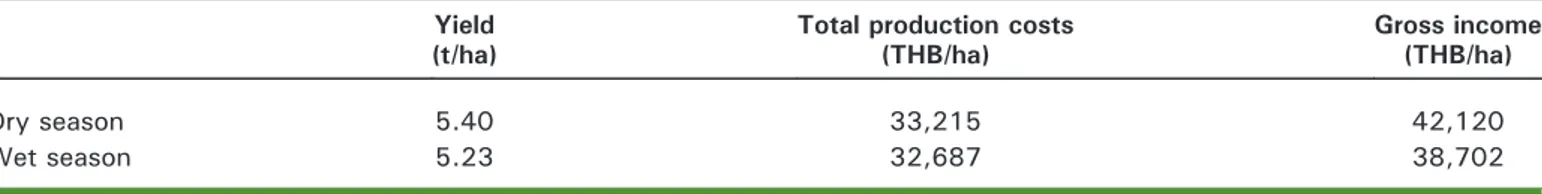
(including opportunity cost), and labour costs (including opportunity cost) for the dry season of 2009-2010 and the wet season of 2010. Total production costs/ton of paddy rice in the dry and wet seasons amounted to 6,151 THB/ton and 6,250 THB/ton, respectively (table 1).
For dry-season production, on average, farmers were left with a net income before tax, or gross margin of 8,905 THB/ha (or 1.649 THB/kg of paddy produced). For wet season production, net income amounted to 6,015 THB/ha (or 1.15 THB/kg). The productivity of water, under two water supply scenarios, i.e. at farm and system level, is presented in table 2. For calculations made at farm level, water use as only crop water demand and field losses (Ea=0.7, hence 30% loss) was considered; for calculations made at system level, water used as the total supply was considered, i.e. including convey-ance losses at system level (Ea*E-b*Ec=0.434, hence 56.6% loss).
Use value of irrigation water
Table 3shows the data on water value, based upon two water supply scenar-ios (i.e. only CWD and field losses, or
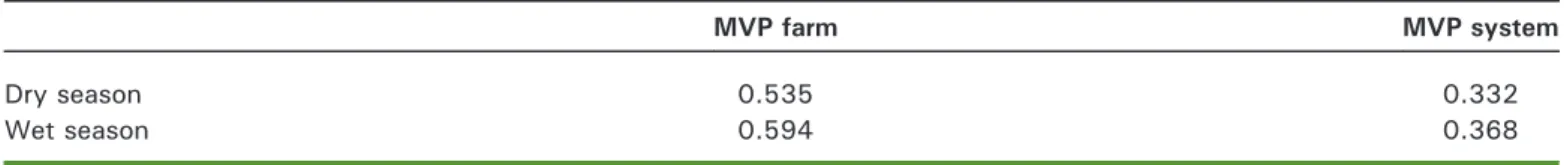
total supply including conveyance losses at system level). Results accord-ing to the first scenario are very similar to those obtained by five other recent studies on rice production in other countries (Perret et al., 2013). The entire marginal value curve of irriga-tion water was not drawn; only one point was inferred from given supply and given production outcome. This explains why the use value of irriga-tion water (or MVP, in THB/m3) is higher under wet season conditions (although the yield is similar, far less irrigation is needed, as compared to the dry season).
These results indicate the maximum amount of money (as per m3used, kg of rice produced, or hectares cropped) that farmers would be able to pay for irrigation water (before they forgo their net income).
These values only refer to water used at field level, and the necessary additional supply needed to cater for losses in the conveyance system was not considered. Canal and conveyance losses are reflected by efficiency coefficients Eb and Ec, respectively; should they apply, all data would be affected by a factor of 0.62 (Eb*Ec), and therefore be signi-ficantly lower. For example, during
the dry season, farmers would be able to pay up to 0.332 THB/m3 for water supply (instead of 0.535 if only water use at paddy level is considered).
In order to test the robustness of the results, we tested the influence of the different variables used to calculate MVP. In order to obtain unitless measure of the influence of each variable on the proposed results, we calculated the ratio of the percentage changes in the MVP as a result of a percentage change of the model variable, or the elasticity of MVP to the given variable (table 4).
The MVP of water is very sensitive to the price of rice, since a 1% decrease in rice price would decrease the MVP by almost 5% during the dry season and 6.5% during the wet season. In the same way, our model of MVP of water is very sensitive to the different production costs. An increase in the production costs by 1% would induce a 3.7% decrease of MVP during the dry season and a decrease of 5.4% during the wet season.
Given the high sensitivity of the results to prices and costs, and the poten-tially high variability of those variables across farmers and across years, we conducted a Monte-Carlo sensitivity
Table 1.
Averages of yields, variable production costs, and gross income (TVP) in the dry and wet
seasons of 2010, as part of the Sam Chuk project (n=20).
Tableau 1. Moyennes de rendements, de coûts variables de production et de revenus bruts lors des saisons sèche et humide de 2010, à Sam Chuk (n = 20).
Yield (t/ha)
Total production costs (THB/ha)
Gross income (THB/ha)
Dry season 5.40 33,215 42,120
Wet season 5.23 32,687 38,702
In 2010, the exchange rate was approximately 31 THB=1 US$.
Table 2.
Average productivity of water in kg of paddy rice per m
3supplied, in the dry and wet seasons
of 2010, as part of the Sam Chuk Project, under two water supply scenarios.
Tableau 2. Productivité moyenne de l'eau d'irrigation, en kg de paddy par m3fourni, lors des saisons sèche et humide de 2010, à Sam Chuk, et selon deux échelles d'apport (exploitation et périmètre).
Water productivity (farm) Water productivity (system)
Dry season 0.325 0.201
Wet season 0.517 0.32
Farm: water supply including crop water demand at paddy field level and 30% water loss in field application; System: total water supply at system level, including crop water demand, and 56.6% water loss in both conveyance and field application.
analysis (Robert and Casella, 2010) in order to obtain a first approximation of the possible range of values of the MVP.
We calculated the MVP of 2,000 simulated farmers facing variable yields, costs, rice price, and use of water. Each variable was drawn from random normal variables with mean and standard deviation obtained from primary observation (variability of sampled farmers was increased by 10% in order to take into account the inter-annual variability) (table 5). Rice prices were simulated as normal variables centred on the 2010 price values and a standard deviation of 700 (i.e. a 95% chance of belonging to the [6028, 8772] interval, being a rather conservative appreciation of the inter-annual variability of rice prices). Table 5 shows the results, which indicate that MVP remains the same and is relatively stable, with a low probability of becoming negative. It can be concluded from this sensi-tivity analysis that farmers are, for most conditions, able to derive some value from irrigation water use. It should be reiterated that this analysis considered water use which included field application losses only (Ea=70%, hence 30% loss). Should
conveyance and canal losses
(Eb*Ec=62%, hence 38% loss) be factored into the analysis, MVP of
water would decline, and the likeli-hood of having negative return to water use would increase.
Costs of irrigation water
supply
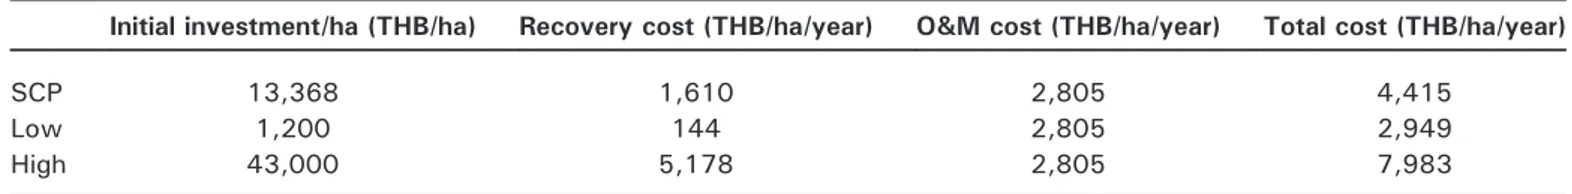
The initial construction costs were spread over 55 years between 1937 and 1993. The capital cost converted to an equivalent value corresponding to 1993 was 265,412,747 THB, which further translated to 670,684,793 THB in 2012 (i.e. the amount that would be needed to build a similar scheme in 2012). This translates to a required investment of 13,368 THB/ha (com-mand area of 50,171 hectares). To assess the representativeness of investments in the case study, we compared these results with the costs of other medium-size RID irrigation investments in Thailand in central and northern regions since 1990. Joint log-log analysis and highest density inter-val (HDI) test demonstrated that the costs incurred at Sam Chuk Project (SCP) are representative of the diver-sity of project costs encountered in Thailand.Table 6shows the range of investment costs per hectare, as revealed by HDI analysis.
O&M costs (including manage-ment and personnel costs, repairs and improvements, renovation, and
small upgradings) amounted to 140,741,037 THB/year (2012 as the reference year). This figure is actually an average of recorded budgets be-tween 2008 and 2012. Calculation of the cost recovery factor indicates that annualized capital costs amounted to 1,610 THB/ha/year. Annual O&M costs amounted to 2,805 THB/ha/year. The total annual costs amounted to 4,415 THB/ha/year, or 2,208 THB/ha/ season. It is assumed that annual costs can be divided equally between the two seasons.
Table 6 shows the costs of irrigation water supply in SCP, including initial investment costs, annualized into recovery costs, and O&M costs. Cal-culations take account of all losses incurred, captured by efficiency coef-ficients, as discussed earlier.
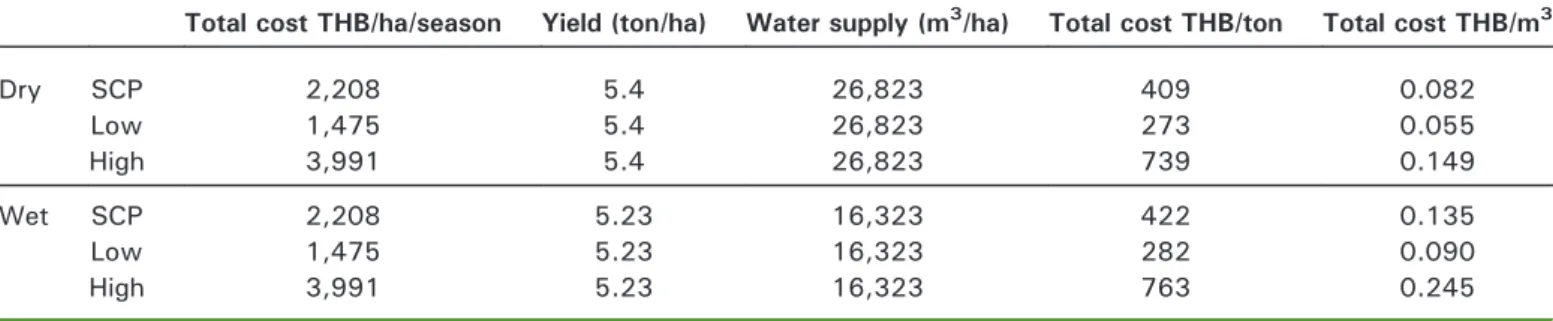
Although there are some small differences between the dry and the wet season, the cost of water at the Sam Chuk irrigation scheme was around 415 THB/ton of paddy pro-duced. When computed with the range of possible costs for a project of equivalent size with equivalent yields and water consumption, the cost of irrigation supply fell within an interval of 270 to 770 THB/ton of paddy produced (table 7).
Discussion
Three points may justify charging rice farmers for irrigation supply. First, even though the SCP provides several services (flood control, navi-gation), its main purpose is rice production. Second, most of the water used to produce rice is con-sumed during the cropping process. Third, a user-pay principle is poten-tially a deterring factor for water squandering and overuse, which
Table 3.
Average marginal value product (MVP) of water in THB per m
3supplied, in the dry and wet
seasons of 2010, as part of the Sam Chuk Project, under two water supply scenarios.
Tableau 3. Valeur marginale (ou valeur d'usage) de l'eau d'irrigation, en THB par m3fourni, lors des saisons sèche et humide de 2010, à Sam Chuk, et selon deux échelles d'apports (exploitation et périmètre).
MVP farm MVP system
Dry season 0.535 0.332
Wet season 0.594 0.368
In 2010, the exchange rate was approximately 31 THB=1 US$.
Table 4.
Water marginal value product (MVP) sensitivity to rice
price and variable costs, expressed as elasticity coefficients.
Tableau 4. Sensibilités aux prix et aux coûts variables de la valeur marginale de l'eau d'irrigation, exprimées en coefficients d'élasticité.
MVP Elasticity Dry season Wet season
To rice price 4.73 6.43
may prove relevant in a context of increased competition for quality water during the dry season. The figures on costs may be compared with figures on use value. The results obtained per kg of rice produced are summarized intable 8.
In other words, MVP (use value) amounted to 0.53 and 0.60 THB/m3 in the dry and wet seasons, respec-tively, while total costs were 0.082 and 0.135 THB/m3. Thus, theoretically, farmers could pay; however, further investigation is required to substantiate these figures.
Rice production costs amounted to 6,151 THB/ha and 6,250 THB/ha in the dry and wet seasons, respectively, in 2011-2012. If farmers were to cover the total cost of irrigation (2,208 THB/ ha/season), production costs would then increase by approximately 36% in both seasons. When using the mini-mum and maximini-mum total costs that were computed, the percentage in-crease would fall by a range of 25 to 64%. If farmers were to pay for O&M
costs only (1,403 THB/ha in both seasons), production costs would then increase by approximately 23% in both seasons. Also, farmers would lose approximately 36% of their net income as water charge in the wet season and 25% in the dry season. In view of such low income, charging farmers is not feasible or acceptable. Furthermore, as previously stated, the 2010-2011 seasons under consider-ation were years in which there was a relatively high yield. Under lower yield conditions, farmers would find it difficult to pay. Also, we have shown the high elasticity of MVP to rice price and production costs. Thus, farmers depend to a large extent on factors that are beyond their control.
In addition, charging rice farmers for irrigation cost recovery would be contradictory to the current govern-ment-initiated scheme to support reve-nue based upon guaranteed rice price at farm gate (the so-called ‘‘govern-ment’s rice mortgage scheme’’; [Perret, 2013]). Finally, as demonstrated by
Molle (2007), rice farmers already pay for water use through pumping costs at farm level (which were considered in our analysis). Thus, they are already well aware of the value and cost related to water use.
As a consequence, there is no need to signal the scarcity value of water to direct users through a charging system. On the other hand, as a final product, processed white rice bears a large virtual water content, up to 9.2 m3/kg in the dry season. This paves the way to investi-gating the possibilities of recovering irrigation costs from the other chain players who benefit from low price and do not contribute to irrigation costs, so far covered by public money. A study has addressed this issue (Perret et al., 2013) and investigated added values and costs among millers, exporters, and retail market operators (wholesalers). Results show that value added is unevenly generated along the chain. For millers, domestic wholesalers, and exporters, the shares of net income gained per mass of rice processed and
Table 5.
Simulations of the marginal value product (MVP) of water during dry and wet seasons, based
upon variability (sd values) increased by 10% (costs, water use, yields), and rice prices as normal
variable with a standard deviation value (sd) of 700 (Monte-Carlo simulation with
n=2,000 drawn
from random normal variables).
Tableau 5. Simulations de valeur marginale de l'eau d'irrigation durant les saisons sèche et humide, basées sur la variabilité (écart type) augmentée de 10 % pour les coûts, la consommation en eau et les rendements, et sur les prix du riz simulés selon une distribution normale (écart type = 700) (Simulation Monte-Carlo sur 2 000 valeurs).
MVP of water (THB/m3) Dry season Wet season
Mean 0.53 0.60
sd 0.2 0.4
Max 1.2 1.9
25% quantile 0.4 0.3
Min -0.3 -0.7
Probability of being negative (%) 1.1 5.1
In 2010, exchange rate was approximately 31 THB=1 US$.
Table 6.
Total costs of irrigation water supply in SCP (2012 value).
Tableau 6. Coûts totaux de l'approvisionnement en eau d'irrigation à Sam Chuk (en 2012).
Initial investment/ha (THB/ha) Recovery cost (THB/ha/year) O&M cost (THB/ha/year) Total cost (THB/ha/year)
SCP 13,368 1,610 2,805 4,415
Low 1,200 144 2,805 2,949
High 43,000 5,178 2,805 7,983
Low and high scenarios correspond to the highest density interval (HDI) 75% values of 2012 investment cost per hectare; in 2010, the exchange rate was approximately 31 THB=1 US$; SCP: Sam Chuk Project; O&M: operation and maintenance.
sold are 22.3, 72.1, and 5.6%, respec-tively. In contrast, costs are relatively similar across post-harvest sectors of the chain. For each of them, charging the full irrigation costs (i.e. 0.76 THB/ kg of white rice traded, on average over two seasons) would merely add 5% to existing processing costs. Such contribution appears reasonable, yet the history of taxation in the rice chain (e.g. the rice premium system; [Perret, 2013]) demonstrates that supply chain players tend to pass on the extra cost upstream, back to farmers, and down-stream to end consumers, leading to rural impoverishment and urban so-cial issues. Such a charging system ought to be accompanied by regula-tions on both sides of the processing chain: a floor price guaranteed to farmers, paid by millers (yet subject to quality, and not subsidized) and close monitoring of rice retail price, with ceilings and regulations if needed. An alternative charging system was also investigated with all sub-sectors, including farmers, based upon respec-tive net incomes, on a pro-rata basis. It considered the fact that production of 1 kg of white rice requires an initial
production of 1.852 kg of paddy. Under such systems, farmers would actually be charged 70.55 and 53.71 THB/ton of paddy sold for full cost recovery in the dry and wet seasons, respectively. Such figures represent less than 5% of their net income in both seasons. They would be charged 44.83 and 33.52 THB/ton of paddy sold for O&M cost recovery in the dry and wet seasons, respec-tively (or less than 3% of the farmers’ net income in both seasons).
As discussed earlier, the benefit of including farmers in the charging system is not related to water resource value, but rather to the value and level of service they receive. As paying customers, farmers may start to take responsibility in systems management. This would also bring some sense of accountability and service-oriented management in RID. The farmers’ inclusion in the entire rice chain, as essential players, would be reinstated. With all players involved, the charging system bears the same limitations as the previous one (excluding farmers) with regards to potential ‘‘ripple effects’’ of costs being passed on
upstream and downstream. Yet again, regulations and close monitoring by public authorities should replace sub-sidies and avoid such distortions. In a final viewpoint, one may consider that the project was initially con-structed to serve various objectives: irrigation and drainage, flood control and water storage, and land setting and transportation, hence benefiting the entire society. Also, paddy fields provide wetland habitats, as well as various ecosystem goods and services (Xiao Yu et al., 2011). It makes sense to start investigating the value of such ecosystem services (especially flood control) and the possibilities of pay-ment to farmers.
Conclusion
The massive public budget that sup-ports the rice sector in Thailand includes irrigation water supply costs, with both capital and O&M costs. In view of increased competition for budget allocation and the overall uncertainty with regards to the rice
Table 7.
Costs of irrigation water supply during the wet season in Sam Chuk (water use and yields
of 2012).
Tableau 7. Coûts d'approvisionnement en eau d'irrigation pour la saison humide à Sam Chuk (consommations et rendements en 2012).
Total cost THB/ha/season Yield (ton/ha) Water supply (m3/ha) Total cost THB/ton Total cost THB/m3
Dry SCP 2,208 5.4 26,823 409 0.082 Low 1,475 5.4 26,823 273 0.055 High 3,991 5.4 26,823 739 0.149 Wet SCP 2,208 5.23 16,323 422 0.135 Low 1,475 5.23 16,323 282 0.090 High 3,991 5.23 16,323 763 0.245
Actual water supply=irrigation water use/0.62; cropping intensity is assumed to be 2 (2 seasons per year); low and high scenarios correspond to the highest density interval (HDI) 75% values of 2012 investment cost per hectare; in 2010, the exchange rate was approximately 31 THB=1 US$; SCP: Sam Chuk Project.
Table 8.
Comparison of water values and costs as per kg of paddy rice produced, from production and
water supply system viewpoints (all
figures expressed in THB/kg of rice).
Tableau 8. Comparaison des valeurs d'usage et des coûts de l'eau d'irrigation par kg de riz paddy produit (unité : THB/kg). Use value Total costs O&M costs Dry season 1.649 0.409 (0.273-0.739) 0.260 Wet season 1.150 0.422 (0.282-0.763) 0.264
sector, such investment calls for investigations on alternative, internal-ized modes of financing irrigation water supply.
In this study, the use value and costs related to irrigation water in the rice sector were investigated. The objec-tive was to assess the needs and possible options for charging farmers in order to cover the costs incurred by irrigation water supply. Analyses revealed the annualized capital costs and O&M costs incurred by irrigation water supply, and the use value and rice cropping system performances from a farmer perspective.
Charging farmers as direct water users is unfair, unrealistic and also contra-dictory to the recurrent public support for their rice income. Alternatively, charging indirect beneficiaries along the rice chain (i.e. post-harvest, mar-keting, and export sub-sectors) makes sense and is feasible according to Perret et al. (2013). However, past experiences (e.g. the rice premium system between 1950-1980; Forssell, 2009; Perret, 2013) have demonstrated that fiscal measures at rice export level (excise duty or export tax) have achieved much in terms of infrastruc-tural development, however, this is at the expense of rice farmers, since the tax was systematically transferred upstream by all sub-sectors, resulting in low rice price at farm gate and deeper rural poverty (Phongpaichit and Baker, 1995). Regulations are therefore needed.
Finally, since paddy fields and irriga-tion systems in Thailand provide
services well beyond rice production itself, a broader economic framework should be discussed and investigated towards financing rice irrigation systems.&
References
Backeberg G, 2006. Reform of user charges, market pricing and management of water: problem or opportunity for irrigated agriculture? Irrigation & Drainage 55 : 1-12.
Briscoe J, 1997. Managing water as an economic good: Rules for reformers. Water Supply 15 : 153-72.
Briscoe J, 1999. The financing of hydropower, irrigation and water supply infrastructure in devel-oping countries. Water Resource Development 15 : 459-91.
Budhaka B, Srikajorn M, Boonkird V, 2002. Thailand country report on investment in water. In: Investment in Land and Water. Regional Consultation report, RAP Publication 2002/09. Bangkok: FAO.
Doorenbos J, Pruitt WO, 1977. Crop water requirements. FAO Irrigation and Drainage paper, 24. Rome : FAO.
FAO, 1992. CROPWAT. A computer program for irrigation planning and management. (Smith M, éd.). FAO technical paper, 46. Rome : FAO. Forssell S, 2009. Rice price policy in Thailand: policy making and recent developments. Minor Field Study Series, 189. Lund: University of Lund, Department of Economics.
Molle F, 2007. Thailand's‘‘free water’’: rationale for a water charge and policy shift in irrigation. In: Irrigation Water Pricing: The Gap Between Theory and Practice, chapter 5. Comprehensive Assess-ment of Water ManageAssess-ment in Agriculture, Series 4. Cambridge (MA, USA) : CABI Publication. Perret SR, Geyser M, 2007. The full financial costs of irrigation services: a discussion on existing guidelines and implications for smallholder irriga-tion in South Africa. Water SA 33 : 67-78.
Perret SR, 2013. Policy and strategies for financing irrigation operation and development in Thailand: past and present. In: Financing Irrigation in the 21st Century. Final report of the Task-Force on Irrigation Financing of the International Commission on Irrigation and Drainage. New Delhi: ICID. Perret SR, Saringkarn P, Jourdain D, Babel MS, 2013. Options for financing irrigation for rice production in Thailand: a case study on irrigation supply costs, use value, and commodity chain economics. In: Financing Irrigation in the 21st Century. Final report of the Task-Force on Irrigation Financing of the International Commission on Irrigation and Drainage. New Delhi: ICID. Phongpaichit P, Baker CJ, 1995. Thailand, econo-my and politics. Kuala Lumpur: Oxford University Press, 1995.
Renzetti S, 2000. The political economy of water pricing reforms. In: Dinar A, éd. The political economy of water pricing reforms. Oxford: Oxford University Press.
Robert C, Casella G. 2010. Monte Carlo statistical methods. Collection‘‘Springer Texts in Statistics’’. Heidelberg (Germany) : Springer Verlag. Tiwari D, 1998. Determining the economic value of irrigation water: comparison of willingness to pay and indirect valuation approaches as a measure of sustainable resource use. Working paper GEC no.98-05. London: Centre for Social and Economic Research on the Global Environment; University College London; University of East Anglia. Warr P, Kohpaiboon A, 2007. Distortions to Agricultural Incentives in a Food Exporting Country: Thailand. Canberra (Australia) ; Bangkok (Thailand): Australian National University; Tham-masat University.
Yu X, Kai A, Gaodi X, Chunxia L, 2011. Evaluation of Ecosystem Services Provided by 10 Typical Rice Paddies in China. Journal of Resources and Ecology 2 : 328-37.
Young RA, 2005. Determining the economic value of water. Concepts and methods. Washington (DC): RFF Press.