Science Arts & Métiers (SAM)
is an open access repository that collects the work of Arts et Métiers Institute of
Technology researchers and makes it freely available over the web where possible.
This is an author-deposited version published in:
https://sam.ensam.eu
Handle ID: .
http://hdl.handle.net/10985/12854
To cite this version :
Guilhem GRIMAUD, Nicolas PERRY, Bertrand LARATTE - Aluminium cables recycling process:
Environmental impacts identification and reduction Resources, Conservation & Recycling p.13
-2017
Any correspondence concerning this service should be sent to the repository
Science Arts & Métiers (SAM)
is an open access repository that collects the work of Arts et Métiers ParisTech
researchers and makes it freely available over the web where possible.
This is an author-deposited version published in:
http://sam.ensam.eu
Handle ID: .
http://hdl.handle.net/null
To cite this version :
Guilhem GRIMAUD, Nicolas PERRY, Bertrand LARATTE - Aluminium cables recycling process:
Environmental impacts identification and reduction Resources, Conservation & Recycling p.13
-2017
Any correspondence concerning this service should be sent to the repository
Aluminium cables recycling process: Environmental impacts identi
fication
and reduction
Guilhem Grimaud
a,b,⁎, Nicolas Perry
b, Bertrand Laratte
b,c aMTB Recycling, Quartier de la Gare, F-38460 Trept, FrancebArts et Métiers ParisTech, CNRS, I2M Bordeaux, F-33400 Talence, France cAPESA-Innovation, France
A B S T R A C T
Life cycle impact of European generic primary and secondary aluminium are well defined. However specific end-of-Life scenario for aluminium products are not available in the literature. In this study, the environmental assessment of cable recycling pathway is examined using the Life Cycle Assessment (LCA) methodology. The data comes from a recycling plant (MTB Recycling) in France. MTB Recycling process relies only on mechanical separation and optical sorting steps on shredder cables to obtain a high purity aluminium (above 99.6%). The life cycle assessment results confirm the huge environmental benefits for aluminium recycled in comparison with primary aluminium. In addition, our study demonstrates the gains of product centric recycling pathways for cables. The mechanical separation is a relevant alternative to metal smelting recycling.
This work was donefirstly to document specific environmental impact of the MTB Recycling processes in comparison with traditional aluminium recycling smelting. Secondly, to provide an environmental overview of the process steps in order to reduce the environmental impact of this recycling pathway. The identified en-vironmental hotspots from the LCA for the MTB recycling pathway provide help for designers to carry on re-ducing the environmental impact.
1. Introduction 1.1. General context
The European demand for aluminium has been growing over the past few decades at a rate of 2.4% per annum (Bertram et al., 2006). The aluminium mineable reserves are large, butfinite, an average value for the ultimately recoverable reserve is about 20–25 billion tons of aluminium. Nowadays, the aluminium production is about 50 million tons per year (Sverdrup et al., 2015). Increase for aluminium demand in Europe is mainly supported by the rise of recycling which growth was in the same time about 5% per annum (Bertram et al., 2006;Blomberg and Söderholm, 2009). The abundance and the versatility of aluminium in various applications have made it one of the top solutions for lightweight metal strategy in various industries such as automotive (Liu and Müller, 2012). In the cable industry, substitute copper for alumi-nium can considerably reduce the linear weight without degrading too much the electrical properties (Bruzek et al., 2015). To obtain optimal electrical conductivity, aluminium use for cables has purity above 99.7% (Goodwin et al., 2005). Because secondary aluminium does not
meet the quality requirements for aluminium cables manufacturers; only primary aluminium is used for the aluminium cables supply chain. Nevertheless, improvement in recycling could help reach quality tar-gets, by using new sorting technologies.
Aluminium properties are not deteriorated by recycling. However, in most cases aluminium parts are mixed together at the end of life step without considering their provenance and use. According to this, the seven series of aluminium are mixed together in waste treatment plant. All aluminium series do not have the same purity and alloying elements pollute aluminium. When aluminium series are mixed together, the cost-effective solution for refining use furnaces. As the metal is molten, the separation is done by using the difference of density and buoyancy (decantation methods, centrifugation, filtration, flotation, etc.) (Rombach and Friedrich, 2003). Despite the technology optimisations, some alloying elements are lost in the process (Paraskevas et al., 2013) and a fraction of metal is not recycled (Ohno et al., 2015). It leads to a drop of the metal quality which is akin to a down-cycling (Allwood, 2014).
By mixing all the aluminium waste streams, it becomes very difficult to maintain a high level of purity for the recycled aluminium. Streams
⁎Corresponding author at: MTB Recycling, Quartier de la Gare, F-38460 Trept, France.
of material available for recycling become increasingly impure as they move further along the materials processing chain, and therefore re-fining the stream for future high-quality use becomes more difficult. In particular, recycling materials from mixed-material products discarded in mixed waste streams, is most difficult (Allwood et al., 2011). To make a step toward the circular economy, it is essential to achieve a recycling industry (Sauvé et al., 2016).
Upstream, the solution lies in a better separation of aluminium products to steer eachflow to a specific recycling chain. This strategy should enable products to be guided through the best recycling pathway and maintain the quality of alloys. This strategy makes it possible for manufacturing companies to take back their own products and secure their material resources (Singh and Ordoñez, 2016). In-creasing the quality of recycled materials should allow recycling com-pany to integrate close loop End-of-Life (EoL) strategy.
1.2. Morphology of aluminium cables
The cables are composed of numerous materials. As illustrated in
Fig. 1, the cables are composed of an aluminium core cable (a), covered with a polymer thick layer (b). Additional metallic materials (c) are coaxial integrated into the matrix of cables. These cables are manu-factured by extruding together all the materials that compose it.
TheTable 1shows the mass proportion of materials contained in cables. Mass proportions are extracted from MTB monitoring data of cables recycled at the plant between 2011 and 2014. Aluminium in cables represents between 35 and 55% of the total weight. Other metals are mainly steel, lead, copper and zinc. The variety of plastics contained in the sheath is even stronger than for metals: silicone rubber, poly-ethylene (PE), cross-linking PE (xPE), polypropylene, polychloroprene, vulcanised rubber, ethylene vinyl acetate, ethylene propylene rubber, flexible polyvinyl chloride (PVC), etc. (Union Technique de l’Électricité (UTE), 1990). Although aluminium cables represent about 8% of alu-minium products in Western Europe (European Aluminium Association (EAA), 2003), the inherent purity of aluminium used for cables justifies
differentiate recycling channels to optimise processing steps and to improve cost efficiency. At the end of life, the challenge concerns the separation of materials from each other. The most economical way to separate different materials rely on a smelting purification (European Aluminium Association (EAA), 2006).
1.3. Presentation of MTB recycling process for aluminium cables An alternative process for EoL cables uses only mechanical steps instead of thermal and wet separation as developed for several years by MTB Recycling, a recycling plant located in south-east of France. The specific processes were developed by MTB engineers and the system is sold worldwide as cables recycling solution. It reaches standard alu-minium purity up to 99.6% for quality A and B (Table 2). This per-formance is obtained using only mechanical separation and optical sorting processes on shredder cables. Aluminium quality D production mainly comes fromflexible aluminium, our study does not consider this production.
Each batch of aluminium (25 t) produced by MTB is analysed by laboratory spectrometry. The Table 2 presents the averaged analysis
results of the chemical elements present in aluminium batches. Between 2012 and 2014, more than 400 lots were analysed. During this period only 40 batches were below the average. The aluminium obtained from recycled cables is specially appreciated by the smelter. Its high purity makes it easy to produce a wide variability of aluminium alloys. Re-cycled aluminium can then be used in many aluminium products and not only in applications requiring high alloy aluminium.
1.4. Issues of the study
The initial motivation for our study was to rank the environmental performance of the MTB recycling pathway in relation to other alumi-nium recycling solutions. In addition, we wanted to identify the main process contributing to the global environmental impact. What are the environmental gains to overcome the aluminium recycling by smelting? Firstly, this article attempts to present the environmental assessment results that enabled the comparison of the three aluminium production scenarios. On the one hand, the study demonstrates huge environ-mental benefits for recycled aluminium in comparison with primary aluminium. And on the other hand, the results show the harmful en-vironmental influence of the heat refining by comparison with the mechanical sorting processes used at the MTB plant. The study de-monstrates the interest of recycling waste streams separately from each other.
Although the starting point of the study was to assess and document the environmental impact of a specific recycling pathway; the results of this study have allowed to identify several environmental hotspots of the MTB Recycling process. Thus, leads to the development of the ef-fectiveness implementations to reduce the environmental impacts of the MTB recycled aluminium. This article presents how the Life Cycle Assessment methodology allowed the engineering team to improve the environmental efficiency of MTB Recycling processes.
2. Methodological considerations
2.1. Environmental assessment of aluminium recycling
To evaluate the environmental performances of the MTB cable re-cycling pathway, we chose to use the Life Cycle Assessment (LCA) methodology. Today, the environmental LCA of European generic Nomenclature
List of acronyms
BIR Bureau of international recycling EAA European aluminium association
ENTSO-E European network of transmission system operators for electricity
EoL End-of-Life
ETV Environmental technology verification IAI International aluminium institute ILCD International life cycle data JRC Joint research centre LCA Life cycle assessment LCI Life cycle inventory PE Polyethylene
primary and secondary aluminium productions are well defined through the work of the European Aluminium Association (EAA) (European Aluminium Association (EAA), 2008). Numerous studies were conducted concerning the sustainability of aluminium recycled by smelters in comparison with primary aluminium from mining. Out-comes about global and local environmental impacts show a decrease up to 90% by using recycled aluminium (European Aluminium Association (EAA), 2010; Bertram et al., 2006).
However, systems modelling always relate to the standard melting solution for recycled aluminium. That is why, this study focuses on the environmental assessment of cable recycling with MTB specific pro-cesses that have never been documented using LCA. Environmental impact assessment is done using ILCD Handbook recommendations (JRC − Institute for Environment and Sustainability, 2012a). Two systems are compared to the MTB cable recycling pathway (scenario 3):
•
Scenario 1: European primary aluminium•
Scenario 2: secondary aluminium from European smelters The primary aluminium production (scenario 1) is used as a re-ference for guidance on the quality of production. Comparison with scenario 1 should help to translate the environmental benefits of cycling. Foremost, our analysis is intended to compare possible re-cycling pathways for the aluminium wastes. With this in mind, the scenario 2 (secondary aluminium) is used as a baseline to evaluate the MTB alternative recycling pathway (scenario 3).2.2. Sources of data for the life cycle inventory
The evaluation is designed by modelling input and outputflows that describe different systems of aluminium recycling with the software SimaPro 8.04 (Goedkoop et al., 2013; Herrmann and Moltesen, 2015). All theflows are based on processes from Ecoinvent 3.1 library (Wernet, 2014). The systems are developed according to the local context of Western Europe. To allow comparison, all the inventory elements are compiled based on the Ecoinvent database boundaries and data quality is checked (Weidema, 2012; Weidema et al., 2013). Once modelling was done, the characterisation is conducted according to International Reference Life Cycle Data System (ILCD) Handbook (JRC− Institute for Environment and Sustainability, 2012a) recommendations.
This study compares two different modelling systems. Scenarios 1 and 2 using available foreground data from Ecoinvent library without any modifications. And scenario 3 using Ecoinvent data to model the MTB Recycling pathway, the inventory dataset was done using the re-commendations from European Joint Research Centre (JRC− Institute for Environment and Sustainability, 2010). For Scenario 1 (European
primary aluminium) and scenario 2 (secondary aluminium from Eur-opean smelter) data has been collected by EurEur-opean Aluminium Asso-ciation (EAA) and aggregated in Ecoinvent 3.1 (Ruiz Moreno et al., 2014, 2013). The MTB scenario was modelled using specific data from MTB Recycling plant. The data collection method does not allow the use of the results for other cables recycling pathways. The results are only representative of cable recycling solutions developed by MTB. Never-theless, the three modelling rely on the same system boundary. 2.3. Life cycle impact assessment methodology
TheTable 3presents the selected indicator models for the life cycle impact assessment method. InTable 3, the two models in italics are the models, which do not follow the recommended ILCD 2011 impact as-sessment methodology (JRC − Institute for Environment and Sustainability, 2012b), which was used throughout the study. For human toxicity indicators, USEtox (recommended and interim) v1.04 (2010) (Huijbregts et al., 2010) model was implemented to improve our characterisation method with latest calculation factors as recommended by UNEP and SETAC (Rosenbaum et al., 2008). First results on water resource depletion with default calculation factor from Ecoscarcity (Frischknecht et al., 2009), show anomalies. These anomalies are all related to the Ecoinvent transportation modelling which involves electricity mix of Saudi Arabia. For the water resource depletion in-dicator, the Pfister water scarcity v1.01 (2009) (Pfister et al., 2009) calculation factor was implemented in our characterisation method. It does not completely remove anomalies in the characterisation, but it significantly reduces the positive impact of transport on the water scarcity indicator. A sensitivity analysis on the characterisation method was conducted using two other characterisation methods: ReCiPe Midpoint v1.1 and CML IA Baseline v3.01. This sensitivity analysis has not yielded conflicting results. These calculations do not show a di-vergence in the hierarchy of scenarios on all indicators.
3. Life cycle assessment study scope
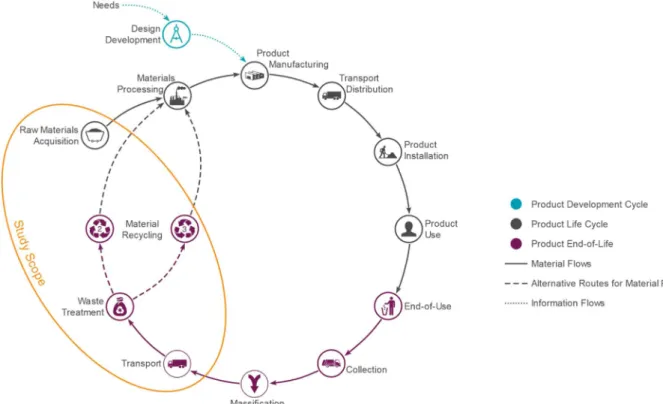
This study is based on a life cycle approach, in accordance with the standards of International Organisation for Standardisation (ISO 14010/44) (International Standard Organization, 2006a,b). TheFig. 2
shows the representation of a standard product life cycle including the life cycle stage and the End-of-Life stage. As shown onFig. 2, product life cycle stage of aluminium is not included in our study scope. 3.1. Functional unit proposal
As part of this study, the functional unit used is as follows: producing
Table 1
Composition of recycled cables at the MTB plant (average for the period 2011–14).
Material Proportion
Rigid aluminium (a) 48.5% Plastics and rubber (b) 40.5% Non-ferrous metals (c) 4.5% Ferrous metals (steel and stainless steel) 4.0% Flexible aluminium 2.5%
Table 2
Chemical composition of recycled aluminium produced by the MTB plant (average for the period 2012–14).
Chemical elements Al Fe Si Cu Pb Mg Aluminium quality A and B 99.67 0.145 0.090 0.022 0.003 0.026 Aluminium quality C 99.50 0.154 0.064 0.205 0.019 0.010 Aluminium quality D 97.25 0.524 0.791 0.524 0.014 0.427
Table 3
List of indicators selected for the life cycle impact assessment (JRC− Institute for Environment and Sustainability, 2011).
Indicators Model
Climate change Baseline model of 100 years of the IPCC Ozone depletion Steady-state ODPs 1999 as in WMO
assessment
Human toxicity, non-cancer effects USEtox model v1.04 (Rosenbaum et al., 2008)
Particulate matter RiskPoll model
Ionising radiation HH Human health effects model as developed by Dreicer
Photochemical ozone formation LOTOS-EUROS Acidification Accumulated Exceedance Freshwater eutrophication EUTREND model Freshwater ecotoxicity USEtox model
Water resource depletion Pfister water scarcity v1.01 (Frischknecht et al., 2009)
Mineral, fossil & ren resource depletion
one ton of aluminium intended for end-user applications, with the purity higher than 97% using current industrial technologies (annual inbound processing higher than 10,000 t) located in Europe.
The matching quality of the products compared can meet the same function as a high purity aluminium can be used for producing many alloys without refining. We selected three scenarios that meet all the conditions of the functional unit:
•
Scenario 1 or primary: primary aluminium, resulting from mining.•
Scenario 2 or secondary: secondary aluminium from recycling by smelter.•
Scenario 3 or MTB: MTB aluminium, from recycling using the MTB solution.3.2. Presentation of the system boundaries
TheFig. 3presents the main steps considered in each scenario of the comparison. The study focuses on transformation steps of aluminium. That is why the system boundaries chosen is a cradle to exit gate modelling (Grisel and Osset, 2008; Jolliet et al., 2010). For scenarios 1
and 2, thefinal product is aluminium ingots, while for scenario 3 the final product is aluminium shot. In any case, the three scenarios meet the functional unit. In both forms of packaging, aluminium can be used to produce semi-finished products.
4. Scenario development
The baseline scenarios (scenarios 1 and 2) refer to the Western European average consumption of aluminium. The scenario 1 and scenario 2 are based on Ecoinvent unit processes modelling. Ecoinvent database uses the EAA Life Cycle Inventory (LCI) (Althaus et al., 2009). For Ecoinvent 3.1 (Ruiz Moreno et al., 2014, 2013), the Aluminium processes are built with data collected by EAA in 2013 (European Aluminium Association (EAA), 2013; International Aluminium Institute (IAI), 2014). The Ecoinvent modelling uses data from the average technology available on the market for Western Europe (Weidema et al., 2013).
Fig. 2. Representation of a standard product life cycle showing the study scope boundaries. Adapted fromZhang, 2014.
4.1. Scenario 1: primary aluminium production
TheFig. 4presents the different steps required (and included in the modelling) for the primary aluminium dataset. The figure adds more details about the intermediate steps required to obtain ingots of pri-mary aluminium. The scenario for pripri-mary aluminium comes from Ecoinvent data. The data used for the study is aluminium production, primary, ingot. This data meets the purity requirements established in the functional unit. At this stage of the production process, the alumi-nium contains only 1.08% silicon and the overall purity is 98.9%. The modelling of primary aluminium is based on the average of primary aluminium production for the European market. The technology con-sidered corresponds to the up-to-date technologies used in Europe. The electricity mix used by the primary aluminium industry is a specific electricity mix. Modelling this mix relies on the compilation of specific data for all European primary aluminium producers. This mix is made up with over 80% from hydroelectric power, 8.7% of electricity from nuclear and the remaining part, 11.3% comes from fossil fuel. For the unit process data used, the downstream transport to the market is not considered, but all the upstream logistic for the transformation steps are included in the boundaries. As processing operations, shown onFig. 4, are conducted in multiple locations, the total distance travelled is 11,413 km (11,056 km by sea, 336 km by road and 21 km by train). 4.2. Scenario 2: conventional aluminium recycling
Scenario 2 provides the modelling of the traditional aluminium re-cycling solution. This scenario is based on shredding steps and melting purification step made by refiners. As well as scenario 1, the scenario 2 is based on average values of European smelters. The data was compiled by the EAA and provided in Ecoinvent database. The collection of waste is not included in the second scenario but the transport from the mas-sification point and the waste treatment plant is included in the mod-elling. Aluminium wastes travel 322 km (20 km on water, 109 km by train and 193 km by road). The electricity mix used in the modelling is equivalent to the electricity mix provided by the European Network of Transmission System Operators for Electricity (ENTSO-E). It is mainly fossil fuel (48.3%), nuclear power (28.1%) and renewable energy (23.6%) (ENTSO-E, 2015). TheFig. 5presents aluminium recycling as modelled in the Ecoinvent dataset. The modelling is divided in five steps: four mechanical separation steps and one thermal step. The shredding step is to reduce the size of the material around 15–30 mm. Mechanical separations carried out as part of the scenario 2 are coarse separation. The recycling plants have equipment to handle a wide quantity of waste without warranties about the quality. They are de-signed only to prepare for the melting not to purify the aluminium. Therefore, the objective is to reduce the amount of plastic and ferrous elements but not fully eliminate such pollution from the waste stream. In Ecoinvent, two data collections are available. One data collection was done for production scraps (new scrap) and the other one for post-consumer scrap (old scrap). The processes used for recycling new and old scraps are not the same. New scrap needs less operation than old scraps. The inbound logistics is also different because some of the
wastes are recycled directly on production plants. For the study the ratio between old and new scrap is based on European aluminium mix (International Aluminium Institute (IAI), 2014). In 2013, old scrap re-presents 46.3% of aluminium recycled in Europe and new scrap 53.7%. After the recycling process, two outlets are possible: wrought or cast aluminium. For the study, the choice falls on wrought aluminium be-cause it has sufficient purity required by the functional unit (97%). The data chosen for the study is Aluminium, wrought alloy {RER} | Secondary, production mix (Ruiz Moreno, 2014). Ecoinvent modelling not show the co-products separated during the recycling process.
4.3. Scenario 3: MTB cables recycling pathway
An intensive inventory analysis was developed during an internal survey conducted in collaboration with EVEA consultantfirm at MTB Recycling plant during fall 2014. Foreground data are based on mea-surement and on stakeholder interviews. The collection of background data comes from Ecoinvent 3.1 or relevant literature. TheFig. 6 pre-sents the details system boundaries used for the life cycle modelling of the aluminium cables recycling pathway at the MTB plant. The boundaries used for MTB scenarios are based on the boundaries of the Ecoinvent modelling. As shown onFig. 6by-products are included in environmental impacts calculation, but no benefit of by-products re-cycling is integrated into the study to remain consistent with the Ecoinvent modelling. For MTB scenario, the distribution between post-consumer cables (54%) and new scraps (46%) is inverted relative to scenario 2. However, the breakdown between old and new scraps has no influence on the recycling steps used at the MTB plant. All the transport steps are made on the road. The distances of transport con-sidered are 540 km for old scraps and 510 km for new scrap from various cable manufacturers. As shown on Table 2, the intrinsic re-cycled aluminium quality reaches at least 99.6% of aluminium purity. MTB Recycling has an environmentally friendly strategy at the top management level. One of the company’s commitments was to source exclusively renewable energy for the recycling plant. Therefore, they subcontracted with an energy provider that ensures an electricity mix from renewable energy source called EDF Equilibria. Electricity comes almost exclusively from hydroelectric power (96.92% from alpine re-servoirs and 2.4% from run of the river). The remaining electricity comes from waste to energy plants (0.51%) and from cogeneration plants (0.17%) (Powernext, 2014).
To present both the advantages of mechanical refining and the specific results at the Trept MTB Recycling plant, we have divided Scenario 3 into two. Scenario 3a corresponds to the modelling using the same electrical mix as scenario 2: ENTSO-E electricity mix. For scenario 3a, the recycling processes are rigorously compared with the same scope. The scenario 3b corresponds to the modelling using the specific green electricity mix used by the MTB Recycling plant. For scenario 3b case, the MTB recycled aluminium is compared to the other aluminium produced considering the MTB plant specific context.
During MTB cables recycling steps, the various separation steps produce co-products, mainly plastics and other metals. Except for plastics which are considered as waste, other co-products are not
Fig. 4. System boundaries of the primary aluminium production from bauxite mining. Adapted fromCapral Aluminium, 2012.
included in the study: their environmental impact is considered as zero. Although these by-products are recycled, the full impact of separation steps is transferred to the production of recycled aluminium. A sensi-tivity analysis was conducted on the allocation method and the results show that the boundaries used for scenario 3 maximise the impact of the aluminium produced by the MTB Recycling pathway (Stamp et al., 2013).
Fig. 7presents aluminium recycling steps considered in the mod-elling of scenario 3. The main difference in the scenarios 2 and 3 pathways is concentrated in the second half of the chart on Fig. 7. Aluminium cables recycling starts with shredding. At the MTB Re-cycling plant, the shredding is done to obtain homogenous particles of size between 5 and 7 mm. The size reduction is done in four steps: two heavy duty shredding steps and two granulation steps. Between each shredding step, magnets are positioned to capture ferrous elements. After shredding, the mechanical and optical separation steps are used to get the best purity of aluminium. The recycled aluminium D is out of scope for this study but the mixture of plastic and aluminium is con-sidered in the LCA study as a waste.
4.4. Life cycle inventory summary
To facilitate the reading of the results,Table 4gives the main in-formation of the life cycle inventory of each scenario.
5. Comparison of the life cycle assessment results 5.1. Comparison of the 3 scenarios
In this section, we are interested in the three scenarios comparison. TheFig. 8draws the comparison for the three scenarios, the values used for the characterisation are given on thefigure. As expected the sce-nario 1 emerges as far more significant on all indicators except for freshwater eutrophication where recycling aluminium (scenario 2) takes the lead. On freshwater eutrophication impact category, the sce-nario 2 (secondary aluminium) has the highest impact, even higher than primary aluminium (scenario1) due to the addition of alloying metals during the aluminium recycling. The alloying elements are re-quired to supply the market with aluminium alloys that meet the market constraints. The copper is the main alloying element
Fig. 5. System boundaries of the smelting recycling scenario for end-of-life aluminium cables. Adapted fromBertram et al., 2006.
contributing to the impact on the freshwater eutrophication. Indeed the copper production chain requires sulphuric tailing (Norgate et al., 2007) and this step represents 96.4% on the impact category. This re-sult seems to be a modelling error into Ecoinvent 3.1. Our team do not consider the results of the freshwater eutrophication impact category from LCA to draw any conclusion.
Average secondary aluminium reaches approximately 10% of the primary aluminium environmental impacts. Those results match with the evaluation already done and meet the values given by the Bureau of International Recycling (BIR) for aluminium recycling benefits. In its report, BIR estimates that the energy gain for recycling aluminium is 94% compared to the production of primary aluminium (Bureau of International Recycling, 2010). It should be noted that the use of a high-carbon electrical mix (ENTSO-E) for recycling tends to reduce the gains once translated into environmental impact categories.
As explained in Life Cycle Performance of Aluminium Applications (Huber et al., 2009) only the European Aluminium Association has
conducted an LCA study to provide generic LCI data about aluminium production and transformation processes which are based on robust data inventory. This work, although focusing primarily on European aluminium production, also provides results for the rest of the world whose production can be imported into Europe. Moreover, the Inter-national Aluminium Institute (IAI) concentrates mainly on the pro-duction of primary aluminium and omits the scope of secondary alu-minium which is only addressed by EAA (International Aluminium Institute (IAI), 2013).
The new contribution of this study concerns the environmental comparison of the mechanical recycling of aluminium cables with a smelting recycling and primary aluminium production. On all the set of indicators, MTB aluminium (scenario 3b) is between 2.5% and 5% of the scenario 1 environmental impacts.
5.2. Recycling scenarios comparison
In this section, we are interested in the comparison of the alumi-nium recycling scenarios. In the previous characterisation, the differ-ence between scenarios 2 and 3 are not clearly shown on the graphical representation. TheFig. 9gives the opportunity to compare more spe-cifically the two recycling pathways. The values used for the histogram representation inFig. 9are given on thefigure.
The environmental impacts of the scenario 3a represents between 5% and 82% of scenario 2 environmental impacts, except for the io-nising radiation impact category. The results on the ioio-nising radiation impact category for scenario 3a are related to the high electricity consumption during the shredding steps. Using the ENTSO-E which contains a large proportion of nuclear energy (28.1%), the electricity consumption contributes to 70% of the ionising radiation impact ca-tegory. And the transport contributes to 21%. The high level of nuclear power consumption also contributes significantly to the ozone deple-tion indicator. The high consumpdeple-tion of electricity from nuclear power contributes largely to the ozone depletion impact category.
Using only mechanical separation steps can halve the environmental impact. For the comparison of aluminium produced using the specific electricity mix, scenario 3b, the environmental impact does not exceed the impact of scenario 2. In addition, the environmental impact of the
Fig. 7. System boundaries of the MTB end-of life recycling pathway for aluminium cables.
Table 4
Summary of the main Life Cycle Inventory information.
Scenario 1 2 3a 3b Name Primary aluminium Secondary aluminium MTB aluminium ENTSO-E MTB Aluminium Green electricity Process Mining Smelting
recycling MTB Recycling pathway MTB Recycling pathway Al Purity 98.9% 97% 99.6% 99.6% Old scraps – 46.3% 54% 54% Electricity mix EAA
electricity mix
ENTSO-E ENTSO-E EDF Equilibria
– Nuclear power 8.7% 28.1% 28.1% – – Fossil fuel 11.3% 48.3% 48.3% – – Renewable 80% 23.6% 23.6% 100% Transport 11,413 km 322 km ≈526 km ≈526 km – Road 336 km 193 km 526 km 526 km – Train 21 km 109 km – Sea 11,056 km 20 km
scenario 3b represents between 2% and 46% of the recycling by melting on the set of impact categories. Thanks to the MTB Recycling pathway (scenario 3b), on the set of indicators the environmental impact of re-cycled aluminium is divided by four.
Results fromFig. 9allow us to establish an environmental hierarchy between the different recycling solutions for aluminium cables. What-ever the electricity mix used by the recycling plant, the MTB mechan-ical recycling process is the most environmentally friendly pathway. It also demonstrates that recycling when driven without loss of quality is a relevant alternative to mining. These results also show the environ-mental relevance of the product centric recycling approach for cables recycling. The LCA study revealed that the closed loop recycling options (considering aluminium cables) has lower environmental impact over the other recycling scenarios using mixed streams of aluminium wastes. This performance has already been demonstrated for aluminium cans (Lacarrière et al., 2015; Niero and Olsen, 2015).
5.3. Uncertainty analysis for recycling scenarios
An uncertainty analysis was conducted between the three scenarios. The uncertainty analysis was performed using the Monte Carlo
approach with 10,000 iterations and a 95% confidence interval. With the specific electricity mix, the uncertainty between scenario 2 and scenario 3a do not exceed 5% on all the set of indicators, except for the human toxicity (8%) and the water resource depletion (45%) in-dicators. With equivalent electricity mix, the results for the uncertainty analysis between scenarios 2 and 3b are present onFig. 10. The un-certainty exceeds 5% on three indicators: ozone depletion (11%), human toxicity, non-cancer effects (9%) and water resource depletion (45%). The results of these three indicators are therefore subject to further investigations to draw some conclusions. Especially for the water resource depletion indicator, which has a very high uncertainty. However, the results of the uncertainties analysis demonstrated the robustness of our modelling and allow us to confirm the conclusions of the characterisation.
5.4. Sensitivity analysis
As seen previously, the electricity supply mix has a huge influence on the overall environmental impact of recycling pathway. A sensitivity analysis was performed on the electricity mix influence for scenario 3. The results are presented onFig. 11. For this sensitivity analysis two
Fig. 8. Environmental characterisation comparison of the 3 scenarios using specific electricity mix.
additional electricity mixes were used in the comparison for scenario 3. The electricity sources distribution for each electricity mix is presented inTable 5. For German and French electricity mix, the Ecoinvent 3.1 data used are listed below:
•
French electricity: Electricity, medium voltage {FR}| production mix | Alloc Rec, U•
German Electricity: Electricity, medium voltage {DE}| production mix | Alloc Rec, UThe comparison onFig. 11 shows the results for the MTB cables recycling pathway using different electricity mix. The gains from re-newable electricity (scenario 3b) are obvious on all the set of indicators. Similarly, the differences between the two national mixes (scenario 3, French electricity and German electricity) are quite pronounced. On climate change and freshwater eutrophication, these differences are largely due to the predominance of fossil fuels in the German electricity mix (62.1%), as for the French electric mix, the share of fossil fuels
Fig. 10. Uncertainty analysis between recycling scenarios 2 and 3a (European ENTSO-E electricity mix).
Fig. 11. Sensitivity analysis on the influence of electricity mix supply for scenario 3. Table 5
Electricity source distribution for electricity mix used in the sensitivity analysis. Electricity mix 3a: ENTSO-E 3b: Green
Electricity
French Electricity
German Electricity Source of data Ecoinvent 3.1 Powernext,
2014 Ecoinvent 3.1 Ecoinvent 3.1 Nuclear 28.1% – 77.2% 16.8% Fossil Fuel 48.3% – 8.9% 62.1% – Coal 12.7% 4.2% 19.7% – Lignite 8.0% 0% 26.8% – Natural gas 16.5% 3.2% 14.3% Oil 11.1% 1.5% 1.3% Renewable energy 21.9% 100% 13.4% 21.0% – Hydropower 11.9% 99.3% 11.9% 4.9% – Wind & Solar
and other
10.0% 0.7% 1.5% 16.1% Other 1.7% – 0.5% 0.1%
accounts for less than 10%. While the French electricity mix consists mainly of nuclear energy, that involving domination on ionising ra-diation and ozone depletion. Overall, the European electricity mix ENTSO-E is the most harmful on our set of indicators. The environ-mental performances are close to those obtained with the German electricity mix, which is the leading producer of electricity at European level in the ENTSO-E network. Using the European ENTSO-E electricity mix in the scenario comparison is the worst case for modelling alumi-nium cables recycling at MTB Recycling plant. It is important to note that whatever the electrical mix used scenario 3 remains the most re-levant from an environmental point of view with respect to the other scenarios.
5.5. Scenario 3b environmental hotspots identification from LCA LCA results allow us to establish a hierarchy between environmental recycling solutions for aluminium cables. Whatever the electricity mix used by the recycling plant, the MTB mechanical recycling process is the most environmentally friendly. In this section, the MTB recycling pathway characterisation is described. TheFig. 12shows the results for the characterisation of the scenario 3b. This characterisation used data from MTB recycling pathway supply with green electricity and without any optimisations. The values used for the graphical representation are given on thefigure.
On the set of indicators, the MTB recycling steps represent between 11.4% and 79.7% of the total impact, the remaining share of the impact is related to upstream logistic. The upstream logistic includes the transport from massification points to the recycling plant. The average of the 11 indicators is equal to 36.1% and the median is 33.0%. The results show a very strong contribution from the upstream transport for the collection of waste in the overall impact of the scenario 3b.
The shredding step is the most contributing process in the overall impact of scenario 3b on the set of impact categories. Although this step is highly energy-intensive, the use of the hydroelectric power supply strongly limits the contribution. Indeed, electricity consumption con-tributes on average 10% of the environmental impact of shredding steps. The water resource depletion impact category is singular in the sense that the production of hydroelectricity has a very strong influence on thefinal impact of this impact category. This observation is due to the depletion factor of water resources used for the hydroelectric pro-duction processes.
Since electricity consumption is not the first contributor for
environmental impacts and to explain the predominance of the shred-ding step on the result, we must go further in the analysis of the sub-process. Thus, the shredding consumables used for the grinding equipment are predominant. The specificity of the alloys used for the blades and the screens implies the use of numerous alloying elements that are a burden on the environmental impact, especially on the freshwater eutrophication indicator (as explain for scenario 2 in para-graph 5.1).
The environmental impact of the second part of the MTB Recycling pathway: the mechanical sorting stage is significantly lower than the shredding steps. The consumables of this stage are fewer. The con-sumption of electricity is also lower in comparison with shredding steps. The electricity consumption is the main contributor to this stage of the recycling pathway. Air separation tables are among the highest electricity consuming processes at the mechanical sorting stage. This stage produces plastic wastes. Also, plastic wastes are currently buried in landfill, all types of plastic are mixed and no industrial processes are available to separate them effectively. In addition, a duty of vigilance is required on a selection of polymers resin that are banned in new plastic products. The impact of this waste is not negligible, between 5 and 10% of thefinal impact on the set of impact categories.
For the scenario 3a environmental evaluation, namely when the ENTSO-E electricity mix is used for the characterisation, all the re-cycling steps of MTB scenario represent on the set of indicators half of the total impact on average. Of course, the energy mix shift modifies the distribution and hierarchy of each stage in the environmental impacts. The upstream logistic transport becomes lesser on all indicators. For the shredding and mechanical sorting stages, the contribution distribution is not distorted but the electricity consumption becomes the main source of the environmental impact. The ENTSO-E electricity con-sumption represents 80% of the recycling processes overall environ-mental impacts.
6. Discussion
6.1. Recycling process optimisation using LCA results
Although the LCA tool is primarily an assessment tool, it is also intended to support an eco-design approach. Using LCA results to im-prove the environmental performances give good results to industrial processes (Pommier et al., 2016). In this section, we focus on the op-timisation option to reduce the environmental impacts of the scenario
3b.
The impact of transportation is primarily due to the distance tra-velled by lorry to the recycling plant. Upstream logistic transport is inevitable, it is therefore difficult to plan to do a distance reduction as the deposits are very diffuse on the collection territory. However, the cable is voluminous waste, and lorry loading is limited by the volume of waste and not by the mass. To improve the upstream logistic, the vo-lume of waste cables could be reduced to facilitate its transport. The logistic optimisation is underway in France. However, the influence we have on logisticsflows is limited, so we have focus the eco-design ef-forts on the processes carried out within the MTB plant.
For shredding consumables, in collaboration with subcontractors, research has been done to identify more durable steel alloys for shredding blades. The new alloys are being tested to demonstrate their gain in terms of longevity. The tests carried out with news blades de-monstrate an increase of 30–60% of the lifespan. The environmental impact of these new alloys is similar. The modification of the steel used by consumables provides a lower-cost solution to reducing the en-vironmental impacts. Work on energy efficiency of the shredder is also necessary to reduce the electricity consumption of the shredding steps. Work on energy recovery has not allowed yet to implement innovative solutions. Nevertheless, the energy recovery solutions and new electric motors are studied.
For the mechanical sorting stage, a thorough reflexion was con-ducted on the electrical consumption of equipment and more specifi-cally on the air separation tables. The MTB engineering team made improvements in the design of the new air separation table models. The improvements in the airflow within the equipment were reviewed. In fact, power consumption could be reduced by using smaller electric motors.
The treatment of plastic waste from the cable sheaths does not ap-pear as a major contributor to the overall environmental impacts in our LCA study. Indeed, this step represents about 5–10% of the scenario 3b overall impacts. This stage of the scenario 3b is divided into two parts: on the one hand, the transport of waste by lorry to the storage site (25 km) and the landfill process. However, as a manufacturer of recycling solutions, it is the responsibility of MTB to provide a technological re-sponse to solve this problem. All plastic polymers from the cable sheaths are not recycled. The plastic resin mixture and the presence of aluminium dust greatly complicate the mixture recovery. According to the study results, to reduce the overall environmental impact of the scenario 3b, MTB should cut down the environmental impacts of plastic
waste management.
To do so, MTB has initiated a reflexion to sort and recycle the plastic resin mixture. Afirst prototype was developed in late 2015. The sy-noptic of plastic processing method is shown onFig. 13. The separation is still based on simple mechanical steps that achieve a uniform se-paration. The results of this pilot recycling unit are encouraging. The unit reduces landfill by 80%. Other developments are underway to enhance the remaining part as solid recovered fuel. For this, the se-paration must be perfect to meet the regulatory requirements.
6.2. New recycling pathway design using LCA results
To further reduce the environmental impact of transport issues, the MTB engineering team had to review the overall recycling pathway and not just the industrial processes. The challenge was to design a trans-portable recycling solution capable of achieving the same level of purity as its existing plant but with a lower throughput. So instead of trans-porting the waste to the recycling plant, it is the plant that moves closer to the deposits. The engineering team has launched in 2015 a new transportable cable recycling solution called CABLEBOX and presented onFig. 14. The solution takes place in two 40-foot containers, one 20-foot container and one 10-20-foot container. Theflow rate reached with the CBR 2000 version is 2 t/h. Compared to the MTB centralised plant, theflow is divided by two. A first unit of CABLEBOX production has been in operation since December 2016 in the United States and one is in operation since January 2017 in France (MTB Recycling, 2016).
The use of the international container standard sizes ensures max-imum transportability by all modes of transport (road, rail, maritime). In addition, the containers offer modularity with upstream and down-stream processes that can be easily implemented before or after the CABLEBOX system. The recycling solution is not autonomous, it re-quires an external power source. The energy mix used for the local supply of the system depends on the location. There are no direct local emissions but only indirect emissions due to energy consumption. The CABLEBOX system includes all the separation steps presented inFig. 7. A transportable solution for recycling can effectively reduce the en-vironmental andfinancial impact of upstream logistic. The CABLEBOX solution is especially relevant when waste production is seasonal or/ and geographically concentrated and it makes a step toward to circular economy by offering an industrial solution for close loop recycling.
7. Conclusions
As already seen in this paper, to recycle the same products, different pathways are available. Life cycle assessment results demonstrate that recycling when driven without loss of quality is a relevant alternative to mining. Recycling pathways can be seen as the assembly of elementary technologies. Designers have the option of the layout to meet the spe-cifications. The indicators that guide the designer choices are ex-clusively economic indicators (Allwood et al., 2011). Environmental considerations are not considered in the layout choice. Some customers and MTB reveal the need for a better understanding of recycling pathway environmental impacts.
Moreover, optimising recycling pathway systems are long and de-mand powerful assessment tools such as Material Flow Analysis (MFA) and Life Cycle Assessment (LCA) (Grimaud et al., 2016; Peças et al., 2016; Pommier et al., 2016). Thefirst limitation concerning the results acquisition which are obtained once the industrial solution is im-plemented. As thefinancial investment was made by the manufacturer, they are reluctant to improve efficiency (Hauschild, 2015; Herrmann et al., 2015). The second limit, the approach used is empirical and is not based on guidelines. If tools and methods are available for product eco-design (Donnelly et al., 2006; Kulak et al., 2016; Leroy, 2011), odologies for process eco-design are rare. Product eco-design meth-odologies are largely based on guidelines provide by standards (Jørgensen et al., 2006; Kengpol and Boonkanit, 2011). For processes, no standard is available as for products.
Therefore, it seems to be necessary to develop an effective metho-dology to evaluate and guide process design choices to ensure eco-nomic, environmental and social efficiency (Allwood, 2014). Offer to the design team an assessment tool will optimise the eco-efficiency of recycling pathways. Using the Environmental Technology Verification (ETV) certification guidelines, we start building a decision support methodology. The emergence of the ETV program appears as a relevant medium to build a process-oriented methodology. This methodology will allow designers to assess and guide their choices to ensure eco-nomic, environmental and social efficiency.
Acknowledgements
This work was performed within the help of Marie Vuaillat from EVEA Consultancyfirm and with financial support from French Agency for Environment and Energy Efficiency (ADEME). We also want to thank MTB Recycling and the French National Association for Technical Research (ANRT) for the funding of the PhD study (CIFRE Convention N ° 2015/0226) of thefirst author.
References
Allwood, J.M., Ashby, M.F., Gutowski, T.G., Worrell, E., 2011. Material efficiency: a white paper. Resour. Conserv. Recycl. 55, 362–381.http://dx.doi.org/10.1016/j. resconrec.2010.11.002.
Allwood, J.M., 2014. Squaring the circular economy: the role of recycling within a hierarchy of material management strategies. Handbook of Recycling. Elsevier Inc., Amsterdam, pp. 445–477.http://dx.doi.org/10.1016/B978-0-12-396459-5.00030-1.
Althaus, H., Blaser, S., Tuchschmid, M., Jungbluth, N., Classen, M., 2009. Life Cycle Inventories of Metals− Final Report Ecoinvent Data v2.1. EMPA Düben. ed., Dübendorf, CH No 10.
Bertram, M., Hryniuk, M., Kirchner, G., Pruvost, F., 2006. Aluminium Recycling in Europe. EAA/OEA Recycling Division, Brussels.
Blomberg, J., Söderholm, P., 2009. The economics of secondary aluminium supply: an econometric analysis based on European data. Resour. Conserv. Recycl. 53, 455–463.
http://dx.doi.org/10.1016/j.resconrec.2009.03.001.
Bruzek, C.E., Allais, A., Dickson, D., Lallouet, N., Allweins, K., Marzahn, E., 2015. Eco-Friendly Innovation in Electricity Transmission and Distribution Networks. Elsevierhttp://dx.doi.org/10.1016/B978-1-78242-010-1.00007-0.
Bureau of International Recycling, 2010. A Report on the environmental benefits of re-cycling—a critical review of the data for aluminium. Alum. Int. Today 4–7. Capral Aluminium, 2012. Aluminium Production Process [WWW Document]. Extrus.
Manuf. URLhttp://www.capral.com.au/Aluminium-Production-Process(Accessed 10.14.14).
Donnelly, K., Beckett-Furnell, Z., Traeger, S., Okrasinski, T., Holman, S., 2006. Eco-design implemented through a product-based environmental management system. J. Clean. Prod. 14, 1357–1367.http://dx.doi.org/10.1016/j.jclepro.2005.11.029.
ENTSO-E, 2015. DETAILED MONTHLY PRODUCTION FOR ALL COUNTRIES (IN GWh) [WWW Document]. Stat. from Eur. Netw. Transm. Syst. Oper. Electr. URLhttps:// www.entsoe.eu/db-query/production/monthly-production-for-all-countries
(Accessed 3.15.15).
European Aluminium Association (EAA), 2003. Aluminium for Future Generations: Progressing Through Dialogue.
European Aluminium Association (EAA),, 2006. Global Aluminium Recycling: A Cornerstone of Sustainable Development. International Aluminium Institute, London.
European Aluminium Association (EAA), 2008. Environmental Profile Report for the European Aluminium Industry 2008.
European Aluminium Association (EAA), 2010. Sustainability of the European Aluminium Industry.
European Aluminium Association (EAA), 2013. Environmental Profile Report for the European Aluminium Industry April 2013.
Frischknecht, R., Steiner, R., Jungbluth, N., 2009. The ecological scarcity method –eco-factors 2006. A method for impact assessment in LCA. Environ. Stud. 0906, 188.
Goedkoop, M., Oele, M., Leijting, J., Ponsioen, T., Meijer, E., 2013. Introduction to LCA with SimaPro. Pré Consultants, Netherlands.
Goodwin, F., Guruswamy, S., Kainer, K.U., Kammer, C., Knabl, W., Koethe, A., Leichtfried, G., Schlamp, G., Stickler, R., Warlimont, H., 2005. Metals. In: Martienssen, W., Warlimont, H. (Eds.), Handbook of Condensed Matter and Materials Data. Springer Berlin Heidelberg, Berlin, pp. 161–430. http://dx.doi.org/10.1007/3-540-30437-1_5.
Grimaud, G., Perry, N., Laratte, B., 2016. Reducing environmental impacts of aluminium recycling process using life cycle assessment. 12th Bienn. Int. Conf. EcoBalance 7.
http://dx.doi.org/10.1016/j.procir.2016.03.097.October.
Grisel, L., Osset, P., 2008. L’analyse du cycle de vie d’un produit ou d’un service: Applications et mises en pratique. Afnor éditions.
Hauschild, M.Z., 2015. Better–but is it good enough? on the need to consider both eco-efficiency and eco-effectiveness to gauge industrial sustainability. 22nd CIRP Conf. Life Cycle Eng. 29, 1–7.http://dx.doi.org/10.1016/j.procir.2015.02.126. Herrmann, I.T., Moltesen, A., 2015. Does it matter which Life Cycle Assessment (LCA)
tool you choose? A comparative assessment of SimaPro and GaBi. J. Clean. Prod. 86, Fig. 14. Presentation of the CABLEBOX system: a transportable recycling solution for cables (MTB Recycling, 2016).
163–169.http://dx.doi.org/10.1016/j.jclepro.2014.08.004.
Herrmann, C., Blume, S., Kurle, D., Schmidt, C., Thiede, S., 2015. The positive impact Factory–transition from eco-efficiency to eco–effectiveness strategies in manu-facturing. 22nd CIRP Conf. Life Cycle Eng 29, 19–27.http://dx.doi.org/10.1016/j. procir.2015.02.066.
Huber, R.P., De Schrynmakers, P., Schmidt, H.-J., Leroy, C., Klöpffer, W., Warsen, J., Bauer, C., 2009. Life cycle performance of aluminium applications. Int. J. Life Cycle Assess. 14, 1–102.
Huijbregts, M. a. J., Hauschild, M.Z., Jolliet, O., Margni, M., McKone, T., Rosenbaum, R.K., Van de Meent, D., 2010. USEtox User Manual.
International Aluminium Institute (IAI), 2013. Global Life Cycle Inventory Data for the Primary Aluminium Industry– 2010 Data. London.
International Aluminium Institute (IAI), 2014. Aluminium massflow Europe 2013. Regional Mass Flow Models− Part A. London p. 8.
International Standard Organization, 2006a. ISO 14040− Environmental Management — Life Cycle Assessment — Principles and Framework.http://dx.doi.org/10.1002/ jtr.International.
International Standard Organization, 2006b. ISO 14044, Environmental Management— Life Cycle Assessment— Requirements and Guidelines. Environmental Management, Geneva.
Jørgensen, T.H., Remmen, A., Mellado, M.D., 2006. Integrated management systems− three different levels of integration. J. Clean. Prod. 14, 713–722.http://dx.doi.org/ 10.1016/j.jclepro.2005.04.005.
JRC– Institute for Environment and Sustainability, 2010. Specific guide for life cycle inventory data sets– EUR 24709 EN. International Reference Life Cycle Data System (ILCD) Handbook– First Edition. European Commission, Brussels.http://dx.doi.org/ 10.2788/39726.p. 142.
JRC– Institute for Environment and Sustainability, 2011. ILCD Handbook: Recommendations for Life Cycle Impact Assessment in the European Context. Publications Office of the European Union European Commission, Brussels 10.278/ 33030.
JRC– Institute for Environment and Sustainability, 2012a. The international reference life cycle data system (ILCD) handbook. International Reference Life Cycle Data System (ILCD) Handbook− First Edition. European Commission, Brussels.http://dx. doi.org/10.2788/85727.p. 72.
JRC– Institute for Environment and Sustainability, 2012b. Characterisation Factors of the ILCD Recommended Life Cycle Impact Assessment Methods− EUR 25167. European Commission, Brussels.http://dx.doi.org/10.2788/60825.
Jolliet, O., Saadé, M., Crettaz, P., Shaked, S., 2010. Analyse du cycle de vie: Comprendre et réaliser un écobilan. PPUR Presses polytechniques.
Kengpol, A., Boonkanit, P., 2011. The decision support framework for developing eco-design at conceptual phase based upon ISO/TR 14062. Int. J. Prod. Econ. 131, 4–14.
http://dx.doi.org/10.1016/j.ijpe.2010.10.006.
Kulak, M., Nemecek, T., Frossard, E., Gaillard, G., 2016. Eco-efficiency improvement by using integrative design and life cycle assessment. The case study of alternative bread supply chains in France. J. Clean. Prod. 112, 2452–2461.http://dx.doi.org/10.1016/ j.jclepro.2015.11.002.
Lacarrière, B., Deutz, K.R., Jamali-Zghal, N., Le Corre, O., 2015. Emergy assessment of the benefits of closed-loop recycling accounting for material losses. Ecol. Modell. 315, 77–87.http://dx.doi.org/10.1016/j.ecolmodel.2015.01.015.
Leroy, Y., 2011. Ecodesign: tools and methods. Tech. l’Ingénieur 1–8.
Liu, G., Müller, D.B., 2012. Addressing sustainability in the aluminum industry: a critical review of life cycle assessments. J. Clean. Prod. 35, 108–117.http://dx.doi.org/10. 1016/j.jclepro.2012.05.030.
MTB Recycling, 2016. The Cable Box présentation [WWW Document]. MTB BOX, Plug’n Run. URLhttp://www.en.mtb-box.com/#!cable-box-1/w0e5e(Accessed 7.30.16). Niero, M., Olsen, S.I., 2015. Circular economy: to be or not to be in a closed product loop?
A life cycle assessment of aluminium cans with inclusion of alloying elements. Resour. Conserv. Recycl. 114, 18–31.http://dx.doi.org/10.1016/j.resconrec.2016. 06.023.
Norgate, T.E., Jahanshahi, S., Rankin, W.J., 2007. Assessing the environmental impact of metal production processes. J. Clean. Prod. 15, 838–848.http://dx.doi.org/10.1016/
j.jclepro.2006.06.018.
Ohno, H., Matsubae, K., Nakajima, K., Kondo, Y., Nakamura, S., Nagasaka, T., 2015. Toward the efficient recycling of alloying elements from end of life vehicle steel scrap. Resour. Conserv. Recycl. 100, 11–20.http://dx.doi.org/10.1016/j.resconrec. 2015.04.001.
Paraskevas, D., Kellens, K., Dewulf, W., Duflou, J.R., 2013. Sustainable metal manage-ment and recycling loops: life cycle assessmanage-ment for aluminium recycling strategies. 20th CIRP Int. Conf. Life Cycle Eng. 404–408. http://dx.doi.org/10.1007/978-981-4451-48-2_66.
Peças, P., Götze, U., Henriques, E., Ribeiro, I., Schmidt, A., Symmank, C., 2016. Life cycle Engineering–taxonomy and state-of-the-art. 23rd CIRP Conf. Life Cycle Eng. 48, 73–78.http://dx.doi.org/10.1016/j.procir.2016.04.085.
Pfister, S., Koehler, A., Hellweg, S., 2009. Assessing the environental impact of freshwater consumption in life cycle assessment. Environ. Sci. Technol. 43, 4098–4104. Pommier, R., Grimaud, G., Prinçaud, M., Perry, N., Sonnemann, G., 2016. LCA (Life Cycle
Assessment) of EVP– engineering veneer product: plywood glued using a vacuum moulding technology from green veneers. J. Clean. Prod. 124, 383–394.http://dx. doi.org/10.1016/j.jclepro.2016.02.130.
Powernext, 2014. Lots of Certified Energy Supplies to MTB Plant – Period. pp. 2012–2014.
Rombach, G., Friedrich, B., 2003. Future potential and limits of aluminium recycling. In: Kuckshinrichs, W., Martens, P.N. (Eds.), Resource-Orientated Analysis of Metallic Raw Materials, Matter and Materials, Jülich, p. 13.
Rosenbaum, R.K., Bachmann, T.M., Gold, L.S., Huijbregts a, M.J., Jolliet, O., Juraske, R., Koehler, A., Larsen, H.F., MacLeod, M., Margni, M., McKone, T.E., Payet, J., Schuhmacher, M., Meent, D., Hauschild, M.Z., 2008. USEtox—the UNEP-SETAC toxicity model: recommended characterisation factors for human toxicity and freshwater ecotoxicity in life cycle impact assessment. Int. J. Life Cycle Assess. 13, 532–546.http://dx.doi.org/10.1007/s11367-008-0038-4.
Ruiz Moreno, E., Weidema, B.P., Bauer, C., Nemecek, T., Vadenbo, C.O., Treyer, K., Wernet, G., 2013. Documentation of Changes Implemented in Ecoinvent Database 3.0, The Ecoinv. Ed. Ecoinvent Report No. 5 (v3). St. Gallen, Switzerland.
Ruiz Moreno, E., Lévová, T., Bourgault, G., Wernet, G., 2014. Documentation of Changes Implemented in Ecoinvent− Version 3.1. Ecoinvent. ed., Zurich.
Ruiz Moreno, E., 2014. New data in version 3.1, changes from v2.2. Ecoinvent User Meeting. Ecoinvent Centre, Basel p. 25.
Sauvé, S., Normandin, D., Mcdonald, M., 2016. L’économie circulaire: Une transition incontournable. Les Presses de l’Université de Montréal, Montréal.
Singh, J., Ordoñez, I., 2016. Resource recovery from post-consumer waste: important lessons for the upcoming circular economy. J. Clean. Prod. 134, 342–353.http://dx. doi.org/10.1016/j.jclepro.2015.12.020.
Stamp, A., Althaus, H., Wäger, P.A., 2013. Limitations of applying life cycle assessment to complex co-product systems: the case of an integrated precious metals smelter-re-finery. Resour. Conserv. Recycl. 80, 85–96.http://dx.doi.org/10.1016/j.resconrec. 2013.09.003.
Sverdrup, H.U., Ragnarsdottir, K.V., Koca, D., 2015. Aluminium for the future: modelling the global production, market supply, demand, price and long term development of the global reserves. Resour. Conserv. Recycl. 103, 139–154.http://dx.doi.org/10. 1016/j.resconrec.2014.03.007.
Union Technique de l’Électricité (UTE), 1990. UTE C30-202 − Insulated Cables and Flexible Cords− System for Cable Designation. Paris, France.
Weidema, B.P., Bauer, C., Hischier, R., Mutel, C., Nemecek, T., Reinhard, J., Vadenbo, C.O., Wernet, G., 2013. Overview and methodology. Data Quality Guideline for the Ecoinvent Database Version 3. Ecoinvent. ed. St. Gallen, Suisse.
Weidema, B.P., 2012. Ecoinvent Database Version 3?the Practical Implications of the Choice of System Model. St. Gallen, Switzerland.
Wernet, G., 2014. Introduction to the ecoinvent version 3.1 database. Ecoinvent User Meeting. Ecoinvent Centre, Basel p. 24.
Zhang, F., 2014. Intégration des considérations environnementales en entreprise: Une approche systémique pour la mise en place de feuilles de routes. Ec. Dr. I-MEP2– Grenoble INP Université de Grenoble.