Science Arts & Métiers (SAM)
is an open access repository that collects the work of Arts et Métiers Institute of Technology researchers and makes it freely available over the web where possible.
This is an author-deposited version published in: https://sam.ensam.eu Handle ID: .http://hdl.handle.net/10985/16936
To cite this version :
Marie BEDEL, Antonin SANITAS, Mohamed EL MANSORI - Geometrical effects on filling dynamics in low pressure casting of light alloys - Journal of Manufacturing Processes - Vol. 45, p.194-207 - 2019
Any correspondence concerning this service should be sent to the repository Administrator : [email protected]
Geometrical effects on filling dynamics in low pressure casting of
light alloys
M. BEDEL*, A. SANITAS and M. EL MANSORI
MSMP Laboratory (EA-7350), Arts et Metiers ParisTech, 2 cours des Arts et Metiers, 13617 Aix en Provence, France
*
Abstract
In aluminum low-pressure sand casting process, filling oscillations are observed when the metal front reaches a section change in a part. The effect of geometry on the filling oscillations is primary considered experimentally, including both mold cavity and filling system geometries. To highlight the geometric parameters impacting the oscillations, the pressurized melt flow is secondly studied numerically and analytically. A new analytical model of oscillation is developed to quantitatively predict the oscillations. It links the resulting filling velocity to both the low-pressure casting parameters and the mold cavity geometry. Considering oxides inclusion criterion from casting literature, new rules to avoid bi-films defects are recommended for making reliable low-pressure castings.
Keywords: low pressure casting, aluminum alloys, mold filling, fluid flow oscillations, oxide inclusions
Nomenclature
𝐸𝑐𝑖 Kinetic energy of the volume i 𝐽
𝐸𝑝𝑖 Potential energy of the volume i 𝐽
𝐹𝑝 External force 𝑁
𝑔 Standard gravity 𝑚 · 𝑠−2
ℎ Metal height above the bottom of the section change 𝑚
ℎ̇ Metal front velocity 𝑚 · 𝑠−1
ℎ𝑓 Metal height in the crucible above the tube bottom 𝑚
ℎ𝑚 Mold cavity height under the bottom of the section change 𝑚
ℎ𝑡𝑟𝑎𝑛𝑠 Section transition height 𝑚
ℎ𝑡𝑢𝑏𝑒 Tube height 𝑚
ℒ Lagrangian function 𝐽
𝑃̇ Pressure ramp 𝑃𝑎 · 𝑠−1
𝑅 Section change ratio in the mold cavity ( 𝑆𝑐/𝑆𝑡) −
𝑅(ℎ) Section change ratio evolution inside the section change (varying between 1 at ℎ = 0 and R at ℎ = ℎ𝑡𝑟𝑎𝑛𝑠)
− 𝑆𝑐 Mold cavity final horizontal cross section 𝑚2
𝑆𝑓 Crucible horizontal cross section 𝑚2
𝑆𝑡 Tube horizontal cross section 𝑚2
𝑆(ℎ) Mold cavity horizontal cross section at a height h from the mold bottom
𝑡 Time 𝑠 𝑡𝑡𝑟𝑎𝑛𝑠 Time when the metal reaches the section transition bottom 𝑠
𝑣𝑓 Vertical metal velocity in the crucible 𝑚 · 𝑠−1
𝑣𝑚𝑎𝑥 Maximal metal front velocity 𝑚 · 𝑠−1
𝑣max_0 Maximal metal front velocity when ℎ𝑡𝑟𝑎𝑛𝑠= 0 𝑚 · 𝑠−1
𝑣𝑡 Vertical metal velocity in the tube 𝑚 · 𝑠−1
𝑣0 Vertical metal front velocity according to Liu model 𝑚 · 𝑠−1
𝛽 Section restriction factor between tube and crucible ( 𝑆𝑡/𝑆𝑓) −
𝜌 Density 𝑘𝑔 · 𝑚−3
ν Cinematic viscosity kg. 𝑚−1. 𝑠−1
𝜙𝑓 Crucible diameter 𝑚
𝜙𝑖𝑡𝑢𝑏𝑒 Tube internal diameter 𝑚
𝜙𝑒𝑡𝑢𝑏𝑒 Tube external diameter 𝑚
1. Introduction
When considering sand mold casting, the part quality depends mainly on the filling velocity. Indeed, if too slow, the filling will not be complete before solidification occurs, inducing misrun [1]. Moreover, filling too slowly may damage the sand mold which can be damaged if submitted to high temperatures for a long time. This leads to veining, scabs, or even mold erosion before the filling completion, directly impacting the final part mechanical properties [1]. Therefore, there is an incentive to fill a mold as fast as possible. However, a too rapid filling flow is known to induce higher oxide content in the melt, which deeply reduces the final mechanical strength of the part. Melt surface turbulence may lead to surface oxide film folding over [1]. The formed bi-films are then entrained into the metal bulk, acting later as cracks [2].
To limit the entrainment of those oxides, Campbell proposed a maximal velocity criterion : it only depends on the melt properties and gives a maximal velocity of 0.5 m.s-1 in the case of aluminum alloys [1]. Runyoro et al. confirmed this criterion by experimentally studying the impact of metal in-gate velocity on the final part bending properties, in the case of gravity casting of aluminum plates [3]. A clear fall-off in bend strength was observed when considering in-gate entry velocities larger than 0.5 m.s-1; the melt rising as a jet could fall back, incorporating the oxides into the bulk. However, filling velocity was not the only oxide entrainment criterion ever considered. Kuo et al. proposed to consider the Reynolds number as an oxide entrainment criterion instead [4], while Cuesta et al. proposed to consider the Weber number [5]. Indeed, analyzing fluid flow simulation of different alloys and channels geometries, they highlighted the additional influence of the channel geometry in the flow
structure. Liu et al. attributed the surface crack formation to metal front backflow [6]. The surface oxide film would be folded by the flow back of the metal before rising again. However, the lack of experimental validation does not permit to favor one of those criteria. Nevertheless, they all depend on the metal velocity, which therefore needs to be quantitatively determined.
After choosing the appropriate criterion on velocity to avoid oxide film entrainment, the process parameters and filling system design have to be adapted to respect it. In gravity casting, the filling velocity cannot be controlled as the metal filling flow depends on the cast part geometry itself. A small fall height is sufficient to achieve the critical velocity [7]. On the opposite, in Low Pressure Casting (LPC), the filling is controlled with tailored furnace pressurization. Indeed, in LPC, the gas pressure increase above the metal in the furnace forces it to rise through a rising tube toward the mold. Therefore, it is theoretically possible to maintain the metal velocity below the critical value during the whole filling phase. This explains why LPC is regarded as an effective solution to avoid oxide film entrainment [1]. Liu et al. showed that the bending strength of an aluminum plate cast by LPC was significantly reduced when increasing the casting pressure ramp [8]. Similarly, Puga et al. highlighted that the porosity content was increased and the tensile strength was reduced in an aluminum alloy industrial part cast by LPC when considering higher pressure ramps [9]. Therefore, the relationship between the set gas pressure evolution and the induced metal filling flow is needed to optimize the process parameters.
By using the Pascal principle, a simple analytical expression was proposed by Hogg et al., linking linearly the metal front height to the gas pressure [10]. They measured a filling height delay in comparison with this simple model in the case of a magnesium automotive part, that they explained by pressure losses. A more developed model based on Bernouilli’s equation was proposed to link the pressure ramp and the system geometry to the metal gate velocity [11]. Considering the filling of a lost-foam casting with a sudden section restriction, the experimental results were in good agreement with the proposed model [11]. However, in the case of a plate-shape casting of aluminum alloy, some filling oscillations were experimentally identified, while they could not be explained based only on this analytical model [8]. Similarly, several metal and water analog experiments highlighted this oscillatory phenomenon during filling by LPC [12][13][14].
Recent work has been devoted to the understanding of the filling oscillations and their link with the process parameters in LPC. In [14], the authors identified the geometric parameters responsible for those oscillations as the horizontal sections of the furnace, the rising tube and the mold cavity. Fixing the low pressure system geometry, the impact of a sudden section change in the mold cavity has been quantified both experimentally and numerically. Moreover, the pressure ramp was shown to have a linear impact on the oscillation intensity. Liu et al. similarly studied the impact of a sudden section restriction on the filling flow and final cast part quality and proposed a maximal section ratio of 0.5 to avoid backflow [6]. Section changes more representative of real casting geometries were studied in [15] by comparing fluid flow simulation and water analog experiments in a progressive section enlargement. Fixing a constant transition angle, the transition height at which the critical velocity is reached was determined as a function of the pressure ramp and the expansion angle. Using the same method, Viswanath et al. studied the impact of three in-gate shapes on the filling dynamics, and showed that a cone-shape in-gate provided smoother filling flow than a flat bottomed in-gate [13]. Therefore, if the number of studies focusing on filling dynamics in LPC is increasing, there is still no general design rule permitting to properly fill a mold using this process.
The present work aims to define LPC design rules to fulfill this gap by studying the impact of the geometry on the filling dynamics. To do so, the effects of geometric parameters on filling velocity are experimentally and numerically studied. A new analytical model is proposed to characterize the melt flow and to deduce adapted design rules for the LPC process.
2. Experimental characterization of LPC filling flow
2.1.
Experimental setup
The geometry of the low-pressure system considered in this study is illustrated in Figure 1. The crucible diameter 𝜙𝑓 is 545𝑚𝑚, the tube length ℎ𝑡𝑢𝑏𝑒 is 953𝑚𝑚, the tube internal diameter 𝜙𝑖𝑡𝑢𝑏𝑒 is 70𝑚𝑚 and the tube external diameter 𝜙𝑒𝑡𝑢𝑏𝑒 is 100𝑚𝑚. Thus the furnace cross section is given
by 𝑆𝑓 =Π 4(𝜙𝑓
2− 𝜙𝑒
𝑡𝑢𝑏𝑒2 ) and the tube internal cross section by𝑆𝑡 =Π4𝜙𝑖𝑡𝑢𝑏𝑒2 . 3D printed furan resin bonded sand molds, with different inner geometries, are placed at the top of the rising tube.
About 100kg of Al-Si13% are melted in the crucible and held at 750°C 5°C by the electrical furnace. Therefore, the metal superheat is around 170°C. During filling, the metal is pushed through the tube toward the mold by increasing the air pressure in the furnace according to a chosen pressure ramp 𝑃̇, divided into five steps as described in [16]. The step of part filling is commonly made with a constant pressure ramp. The authors showed that the pressure ramp has a linear impact on oscillations [16]. Therefore, the same pressure evolution is considered in the whole study, with a unique and constant pressure ramp during mold filling of 𝑃̇=2500 Pa.s-1. Indeed, by considering a pressure ramp at the upper limit of the machine range (0-2500 Pa.s-1), the oscillation phenomena are intentionally amplified in order to increase measurement accuracy. The pressure servo regulator system has an accuracy of 100 𝑃𝑎 ∙ 𝑠−1.
In order to characterize the flow dynamics during filling, in-situ instrumentation was developed, as illustrated in Figure 1 in red. Steel rods of 1 mm diameter are inserted in the mold cavity every 10 mm in height, with a position precision of 2 mm. Each contact is linked to the electrical circuit, of initial tension 11V. When the metal reaches a new contact, the output tension is reduced. The output tension data collected at a 100 Hz fixed frequency permits to measure the passage time of the metal at each rod during filling.
Figure 1 : Vertical cross section view of the Low-pressure casting system and instrumented sand mold. Furnace and mold are in dark grey, liquid metal in light grey and air in the furnace in white.
2.2.
Geometric parameters impacting fluid flow
In order to study the geometry impact on filling dynamics, three geometric parameters potentially impacting the filling dynamics are identified: the total section change ratio defined as 𝑅 =𝑆𝑆𝑐
𝑡 (total cavity cross section over tube internal cross section), the local shape of the section change and the section transition height ℎ𝑡𝑟𝑎𝑛𝑠. Those three parameters are experimentally tested and the metal height evolution with time below, inside and above the section change is presented for each case in Figure 2 (ℎ = 0𝑚 corresponds to the bottom of the section change).
Mold cavities with different section change ratio (R=0.125 and R=0.5) are considered in Figure 2-(a). When the section restriction is stronger, the oscillatory phenomenon is clearly amplified, as already described in a previous study [14]. This parameter must definitely be considered when studying the geometry impact on filling dynamics. In the following, both section restrictions (R<1) and section enlargements (R>1) are considered. In Figure 2-(b), three section change shapes are tested, for the same global section ratio R=0.24. Indeed, industrial part geometries can almost never be regarded as cylinders of varying diameter. The filling flow is often split into several channels due to the cavity geometry. Therefore, for a fixed global section ratio R=0.24, the case of a single central bar is represented in red, the case of 6 narrower bars is shown in blue and the case of a ring is shown in green. These experiments permit to observe that the metal height evolution is very similar in the three cases. Although the local geometry impacts the flow regime by modifying Weber or Reynolds numbers (due to characteristics dimensions), it does not affect the filling velocity. Therefore, the local geometry can be set aside as an impacting parameter on velocity. Only central cylinders of varying diameter are considered in the further study, and the results on velocity could be extrapolated to more complex geometries.
When considering those two first parameters, the section variation was always considered to be sudden. However, this is not often the case in parts designed for foundry processes; sudden section changes are conducive to defects formation during solidification such as hot tears [1]. Therefore, the third studied parameter is the transition height. The metal height evolution is given for two mold cavities of same section ratio R=0.24 and different transition heights in Figure 2-(c). The section
change is either sudden (in red) or progressive with a total transition height ℎ𝑡𝑟𝑎𝑛𝑠 = 67𝑚𝑚 with a constant transition angle of 75° (in green). The first oscillation is seen to be delayed and eased when the section change is more progressive. Therefore, this parameter is also taken into account in the following study. Out of the three selected geometric parameters, the section change ratio R and the section transition height htrans are observed to actually impact the filling dynamics, and are thus studied
in the following.
(a) Impact of the global section ratio R
(b) Impact of the local shape
Figure 2 : Schematic mold cavity top view and vertical cross-section on the left and experimental metal height evolution with
time on the right for 𝑃̇ = 2500𝑃𝑎/𝑠 for (a) two different section ratio, (b) three shapes for the same section ratio R=0.24 and (c) two section transition heights htrans for the same section ratio R=0.24.(ℎ = 0𝑚 corresponds to the bottom of the
section change).
2.3.
Geometric parameters’ selection
The preliminary experimental study permits to define the pertinent mold cavity geometries to study. All the mold cavities are cylindrical in shape with a bottom of the section change at ℎ𝑚 = 100𝑚𝑚 from the mold bottom. The section change is defined by a ratio 𝑅 =𝑆𝑐
𝑆𝑡 and a section transition height ℎ𝑡𝑟𝑎𝑛𝑠. Here three different shapes are studied: (A) a constant transition angle, meaning a square variation of the section ratio in the transition zone, (B) a linear variation of the section ratio and (C) a square root variation of the section ratio. The ratio variation with height between the section transition bottom ℎ = 0 and the section transition top ℎ = ℎ𝑡𝑟𝑎𝑛𝑠 is given for these three transition shapes in Eq. (1): 𝑅𝐴(h) = S(h) St = (1 − (1 − √R) h h⁄ trans) 2 𝑅𝐵(h) = S(h) St = 1 − (1 − R) h h⁄ trans 𝑅𝐶(h) =𝑆(ℎ)𝑆 𝑡 = (1 − (1 − 𝑅 2) ℎ ℎ 𝑡𝑟𝑎𝑛𝑠 ⁄ )1/2 (1)
Examples of vertical cross-section view of studied mold cavities are given in Figure 3 for two values of section change ratio R, for three values of transition height ℎ𝑡𝑟𝑎𝑛𝑠 and for the three studied transition shapes (A), (B) and (C).
(a) Vertical cross-section for sudden section change (ℎ𝑡𝑟𝑎𝑛𝑠= 0)
(b) Vertical cross-section for progressive section change with ℎ𝑡𝑟𝑎𝑛𝑠= 𝜙𝑖𝑡𝑢𝑏𝑒/2
(c) Vertical cross-section for progressive section change with ℎ𝑡𝑟𝑎𝑛𝑠= 𝜙𝑖𝑡𝑢𝑏𝑒
(d) 3D view of mold and mold cavity for progressive section change with ℎ𝑡𝑟𝑎𝑛𝑠= 𝜙𝑖𝑡𝑢𝑏𝑒
Figure 3 : Illustration of studied mold cavity geometries for (A) transition shape in red, (B) transition shape in green and (C)
transition shape in blue, for three different values of section transition height ℎ𝑡𝑟𝑎𝑛𝑠 and for a section reduction defined by R=0.125 (on the left) and a section increase defined by R=8(on the right).
3. Modelling of filling dynamics
3.1.
Computational model
In order to enlighten the filling dynamics origin, fluid flow simulation of LPC filling is performed using ANSYS Fluent® simulation software. The effect of metal cooling and solidification on the filling dynamics is neglected. Therefore, the model will be less and less accurate over time, and only the first oscillations of the metal front after section change will be considered. Continuity and Navier-Stokes equations are solved using finite volume discretization. As the fluid flow in the tube is turbulent, the 𝑘 − 𝜖 turbulence model is used. Air and liquid metal are considered as non-miscible and the interface is tracked using the Volume Of Fluid method. More details about the model are given in Ansys Fluent Manual [17]. The two phases are considered as Newtonian fluids with constant density ρ and cinematic viscosity ν (respectively 2495 kg.m-3 and 1.13x10⁻³ kg.m-1.s-1 for liquid aluminum alloy [18] and 1.442 kg.m-3 and 0.10x10⁻³ kg.m-1.s-1 for air (Fluent 16.1 database)).
By studying several system geometries, the authors showed in a previous work that the metal in the tube has an impact on the filling dynamics while the metal in the crucible and the air in the furnace can be neglected [14]. Therefore, the modelled system is made of the mold cavity and the tube. The system geometry and boundary conditions are illustrated in Figure 4. The system is initially fully filled with air and a constant metal pressure ramp 𝑃̇ is applied at the bottom surface. Atmospheric pressure is imposed at the top surface and no mass exchange is allowed in the other system boundaries. A no-slip boundary condition is considered at the metal/mold interface. A 2D-axisymmetric system is considered and a 1 mm mesh
Figure 4 : 2D axi-symmetric
system geometry, initial and
boundary conditions considered
size is used. As the free surface of the metal is not necessarily flat and horizontal during filling, the metal height evolution with time is considered along the symmetry axis.
3.2.
Development of Lagrangian model
In order to characterize the geometry and the process parameters impact on the oscillatory phenomenon, an analytical model using the Lagrangian method is developed. This model was developed by the authors in the case of a sudden section change in [19]. Here this model is extended to progressive sections changes, to quantify the metal height evolution inside and above a progressive section change. To do so, the continuous liquid metal media is divided into five volumes as illustrated in Figure 5: (1) the metal in the furnace below the tube bottom, (2) the metal in the furnace above the tube bottom, (3) the metal inside the tube, (4) the metal in the section restriction, and (5) the metal above the section restriction. In volumes (2), (3), (4) and (5), the metal is assumed to be incompressible and non-viscous. The volume (1) cannot be considered in the Lagrangian model as the boundary conditions with elements (2) and (3) are different. Therefore the metal in the crucible bottom is not considered in the following energy balance, which may be a strong simplification. The dynamic and dissipative effects as well as the effect of metal direction change are neglected. The validity of this assumption is hence studied in the following paragraph.
Using the energy minimization principle, the motion equations of the system submitted to an external force 𝐹𝑝 (gas pressure in the furnace) is given by:
d dt( ∂ℒ ∂ḣ) − ∂ℒ ∂h= Fp with ℒ = Ec− Ep (2)
with ℒ the Lagrangian of the system. In each considered volume, the kinetic and potential energies are expressed as a function of the system geometry, the height h and the velocity ḣ of the metal front. When the metal front is in the transition zone (Step 1), h is the height of the metal above the bottom of the section change and when the metal front is above the section change top (Step 2), h is the height of the metal above the section change top, as shown in Figure 5. The different horizontal sections are expressed according to the furnace section and the section ratioβ and R (tube section St= βSf and final cavity section Sc= RβSf). The volumes velocities are expressed according to the free surface
metal velocity ḣ, simply considering the mass conservation. During Step 1, it corresponds to a metal velocity in the tube vt= R(h)ḣ and a metal velocity in the furnace vf= R(h)βḣ, with R(h) varying from 1 to final ratio R. During Step 2, it is simply vt = Rḣ and vf = Rβḣ.
Therefore the kinetic and potential energies of the five volumes can be expressed during Step 1 and during Step 2 as functions of the geometrical parameters. In particular, the kinetic and potential energies depend on the metal height in the crucible ℎ𝑓, which decreases when the metal fills the mold cavity. The analytical expressions of the furnace height and the corresponding kinetic and potential energies of the five metal volumes are given in Table 1 during the two steps. When the transition shape
is different, the terms hf(h), Ec3 and Ep3 are different, so only the (A) shape formula are given in
Table 1. The B and C shapes expressions are given in appendix.
At the beginning of Step 1, the metal front is supposed to be at the bottom of the section change and the metal front velocity is given by ℎ̇(0) =𝜌𝑔(1+𝛽)𝑃̇ [8]. Then when the metal front reaches the section transition top at t = ttrans, equations of Step 2 are solved, with an initial front velocity from Step 1. The external force is also expressed as it varies with the metal height in the furnace and the air pressure.
(a) Step 1 (b) Step 2
Figure 5 : Cross-section of the LPC system with the volumes considered for the Lagrangian model, (a) when the metal front is in the section change zone and (b) when the metal front is above the section change top.
Table 1 : Developed Langrangian motion model
Volume Step 1 Step 2
1 𝐸𝑐1= constant and 𝐸𝑝1= constant
2 𝐸𝑐2= 0.5𝜌𝑆𝑓𝛽2𝑅(ℎ)2ℎ𝑓(ℎ)ℎ̇2 𝐸𝑝2= 0.5𝜌𝑆𝑓𝑔 ((ℎ𝑓(h) − ℎ𝑡)2− ℎ𝑡2) 𝐸𝑐2= 0.5𝜌𝑆𝑓𝛽2𝑅2h𝑓(ℎ)ḣ2 𝐸𝑝2= −0.5𝜌𝑆𝑓𝑔 (2h𝑡+ 2h𝑡𝑟𝑎𝑛𝑠− h𝑓(ℎ)) h𝑓(ℎ) (3) 3 𝐸𝑐3= 0.5𝜌𝑆𝑓𝛽𝑅(ℎ)2ℎ𝑡ℎ̇2 𝐸𝑝3= −0.5𝜌𝑆𝑓𝑔𝛽ℎ𝑡2 𝐸𝑐3= 0.5𝜌𝑆𝑓𝛽𝑅2h𝑡ḣ2 𝐸𝑝3= 0.5𝜌𝑆𝑓𝑔𝛽(h𝑡𝑟𝑎𝑛𝑠2− (h𝑡𝑟𝑎𝑛𝑠+ h𝑡)2) (4) 4 𝐸𝑐4= 0.5𝜌𝑆𝑓𝛽𝑅(ℎ)3/2ℎℎ̇2 𝐸𝑝4= 𝜌𝑆𝑓𝛽𝑔ℎ2( 1 12+ √𝑅(ℎ) 6 + 𝑅(ℎ) 4 ) 𝐸𝑐4= 0.5𝜌𝑆𝑓𝛽𝑅3/2ℎ𝑡𝑟𝑎𝑛𝑠ḣ2 𝐸𝑝4= −𝜌𝑆𝑓𝛽𝑔ℎ𝑡𝑟𝑎𝑛𝑠2(𝑅2+23√𝑅(1 − √𝑅) +(1 − √𝑅) 2 4 ) (5) 5 𝐸𝑐5= 0.5𝜌𝑆𝑓𝛽𝑅ℎḣ2 𝐸𝑝5= 0.5𝜌𝑆𝑓𝑔R𝛽ℎ2 (6)
3.3.
Validation of the Lagrangian model
The objective of developing the Lagrangian model is to analyze the effect of different process parameters and geometries on the filling dynamics. To do so, the model has to be validated by comparison with experimental and numerical results on defined cases. Figure 6 presents the metal height evolution with time in the case of a section restriction R=0.24 and the experimental pressure ramp 𝑃̇ = 2500𝑃𝑎. 𝑠−1. Indeed, the section restriction is chosen to be representative of a standard section change in a part and the pressure ramp is taken at the upper limit of the system range in order to amplify the dynamics effects. Two section geometries are considered. In Figure 6-left the section change is sudden while in Figure 6-right, the transition angle is of 75°, corresponding to a transition height of 67 mm ((A) type). Those two section transitions are considered to be representative of the section changes that may occur in real parts.
A vertical cross-section of the considered cavity geometry is given in each graph. In both cases, the experimental results obtained from the tension acquisition system (in black) are compared with the Fluent simulation results (in blue) and the Lagrangian model results (in red). In addition, the continued metal rise in the case of no section change is given in black dashed line. The experimental points are presented with ∓2mm error bars corresponding to the position uncertainty of the contacts.
Figure 6 : Comparison of metal front height evolution with time obtained by experiment (black dots), by Fluent simulation
(blue lines) and by Lagrangian model (red lines) for the case R=0.24 and 𝑃̇ = 2500𝑃𝑎. 𝑠−1 and for 2 transition heights: null on the left and 67mm on the right (75° transition angle)
In both cases, the experimental results show a linear rise of the metal below the bottom of the section change. Then when the metal crosses the section change zone, it starts to oscillate until the end of filling. As already commented by the authors in [14], this behavior is qualitatively found back in both simulation and model results in the case of a sudden restriction. The present study permits to enlarge the conclusions to progressive section changes. The metal inertia is seen to be responsible for the oscillation formation. The discrepancies increase with time between experimental and numerical results can be explained by thermal effects: the viscosity, density and surface tension increase of the metal with cooling will tend to ease the oscillatory phenomena.
Going further, the oscillation period is found back and the first oscillation amplitude is even quantitatively predicted by the Lagrangian model, in both tested geometries. Moreover, the Lagrangian model results are seen to be very close to Fluent simulation results in the two tested configurations. The period, amplitude and shape of the oscillations are almost identical. The developed Lagrangian model permits to quantitatively predict the first oscillations induced by a section change, and thus the maximal velocity reached by the metal during filling. Therefore, only the Lagrangian model will be used in the filling dynamics investigation presented in the remainder of the study. As the impact of pressure ramp on the oscillations was shown to be linear [14], only one pressure ramp is studied in the following: 𝑃̇ = 2500𝑃𝑎. 𝑠−1.
4. Geometry impact on filling dynamics
4.1.
Sudden section change ratio effect
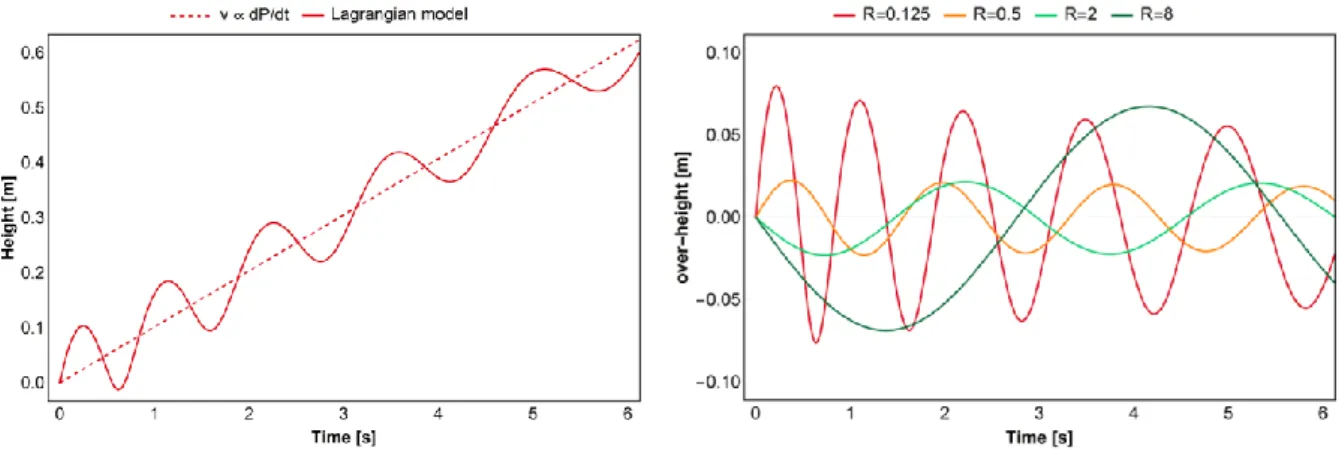
Using the Lagrangian model, the evolution with time of the metal front height is obtained above a section change of ratio R. It is illustrated in the case of R=0.125 in Figure 7. The graph origin corresponds to the moment when the metal front reaches the section change. This evolution is compared to the model of Liu et al.[8], linking linearly the pressure ramp to the resulting vertical velocity in the cavity:
𝑣0=𝜌𝑔(1 + 𝑅𝛽)1 𝑃̇ (7)
The Lagrangian model does predict an average metal height evolution following the Liu model. However, the filling velocity clearly oscillates around this average value, and the metal front even goes up and down during filling, even far from the section restriction.
Figure 7 : Evolution of the metal front height (from the mold
bottom) with time for R=0.125, in the case of a sudden
section change, by Lagrangian model
Figure 8 : Evolution of the metal front over-height with time
for four values of R, in the case of a sudden section change,
by Lagrangian model
In order to analyze the effect of R value on this oscillatory phenomenon, the metal front over-height (ℎ − 𝑣0𝑡) is given in Figure 8 for several R values. The impact of the section ratio R on the oscillatory behavior is clearly visible; the oscillation period increases with R and more importantly, the further is R from 1, the more the oscillation amplitude is important. The maximal velocity reached by the metal
front during filling is larger when the section restriction is more important but this effect is less visible in the case of section enlargement. Therefore, in order to generalize these observations to the machine range of pressure ramp and to a large variety of section change ratios, the maximal metal front velocity is given as a function of 𝑃̇ for six R values in Figure 9.
As shown in [14], the maximal velocity predicted by the Lagrangian model is proportional to the pressure ramp, but it additionally depends on the section change ratio. When considering a section restriction, the maximal velocity reached by the metal front strongly depends on R value. For example, the maximal velocity is multiplied by a factor 4 when the section restriction is 0.125 instead of 0.5. The R value impact on the maximal velocity is lower in the case of a section enlargement. The maximal velocity is almost unchanged when R=8 instead of 4, in the whole considered pressure ramp range. In order to quantify the impact of section ratio on the maximal front velocity according to the Lagrangian model, equation (8) is modified in equation (8) as:
𝑣𝑚𝑎𝑥=𝜌𝑔(1 + 𝑅𝛽)𝑓(𝑅) 𝑃̇ (8)
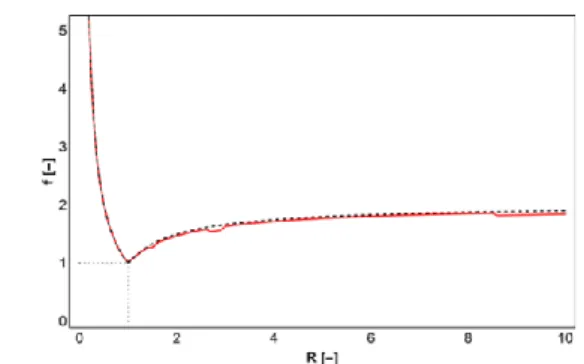
With 𝑓(𝑅) a function of the section ratio. 𝑓(𝑅) = 1 when R=1 as 𝑣𝑚𝑎𝑥= 𝑣0, and𝑓(𝑅) is higher than 1
for any other R value as a section change always induces a metal front velocity increase. This function can be fitted almost perfectly by equation (9), as illustrated in Figure 10 :
𝑓(𝑅) = { 1 𝑅𝑤ℎ𝑒𝑛𝑅 < 1 2 −1 𝑅𝑤ℎ𝑒𝑛𝑅 ≥ 1 (9)
The f(R) curve fitting by 1/R function when considering a section restriction highlights the predominant effect of inertia; flow rate conservation induces that the metal front velocity, initially equal to v0, is divided by the section ratio R when crossing the section change. When considering a
sudden section enlargement, the metal is first slowed down at vmin=v0/R before accelerating. The
maximal velocity can therefore be approximated by v0+(v0-vmin), which justifies the shape of f(R)
Figure 9 : Maximal reached velocity as a function of the
pressure ramp and the section change ratio in case of a
sudden section change, by Lagrangian model
Figure 10 : Variation of the proportionality coefficient f with
the ratio R in case of a sudden section change in red,
function 1/R for R<1 and function (2-1/R) for R≥1 , both in
dashed black lines, by Lagrangian model
The f(R) function permits to link the maximal velocity reached by the metal front to the considered pressure ramp, knowing the section ratio value. Thanks to this improved model, it becomes possible to define the maximal pressure ramp permitting not to exceed a desired maximal metal front velocity, for any horizontal sudden section change.
4.2.
Section change progressiveness effect
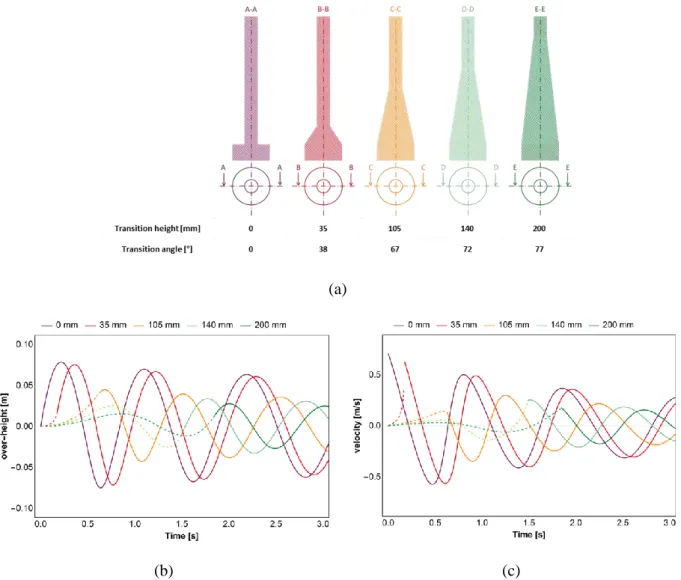
A rule has been defined to link the cavity geometry to the filling dynamics in the case of a sudden section change. In this section, the effect of the section transition smoothing is now considered. For a fixed section change ratio R, the impact of the transition height ℎ𝑡𝑟𝑎𝑛𝑠 on the oscillations is studied in the case of a transition shape of (A) type presented in table 1 (constant transition angle). Five values of transition height are considered in Figure 11 in the case of R=0.125. The five top views (identical as the same ratio R is considered) and the corresponding vertical cross-sections are illustrated in Figure 11-(a). The transition height is varied from 0 (sudden change) to 200 mm, corresponding to almost three times the tube diameter. The over-height and the velocity evolutions with time are given for those five geometries, respectively in Figure 11-(b) and Figure 11-(c). The evolution is given in dash line when the metal front is in the section transition zone and then in plain line when the metal front is above the section transition top.
Comparing the filling dynamics in the case of ℎ𝑡𝑟𝑎𝑛𝑠= 35𝑚𝑚 (in red, corresponding to 38° angle) to the sudden change case (in purple), one can see that the oscillations are very similar. Only a slight delay and a slight amplitude reduction are observed, but the oscillations period and general shape are conserved. The maximal velocity is reached in both cases at the transition zone top, during the first oscillation, as can be seen in Figure 11-(c). The transition height has to be as large as 105 mm (in orange, corresponding to 67° angle) to observe a noticeable impact. As the section transition zone is more progressive, the metal front acceleration inside and after the transition zone is reduced. The metal front velocity is lower and the transition zone is higher, which explains the delay to reach the transition top when increasing ℎ𝑡𝑟𝑎𝑛𝑠. Moreover, the maximal velocity is not reached at the transition zone top or during the first oscillation as previously, but above the transition top during the second oscillation, after 1.25s. Therefore, if the transition smoothing permits to reduce the metal acceleration inside the transition zone, the oscillations initiated inside are amplified above the section transition zone, justifying that considering the filling flow dynamics inside a section transition is not sufficient. When the transition height is even higher with ℎ𝑡𝑟𝑎𝑛𝑠 = 140𝑚𝑚(in green, corresponding to 72° angle), this phenomenon is amplified. A whole oscillation period occurs inside the transition zone and the oscillation amplitude is increased above the transition zone. The maximal velocity is reached just above the section transition top after 1.52s. Eventually, when ℎ𝑡𝑟𝑎𝑛𝑠= 200𝑚𝑚 (in dark green, corresponding to 77° angle), the oscillation amplitude increases inside the transition zone, to reach a maximal velocity at the transition top. By increasing more and more the transition height, one would reduce the maximal velocity until reaching the initial velocity 𝑣0 given by eq.(8) but also delay the maximal velocity reaching time to higher order oscillations.
(a)
(b) (c)
Figure 11 : (a) Top view and vertical cross-section of the five considered cavity geometries, corresponding to five values of
transition height (from 0 in purple to 200mm in dark green), and Lagrangian model results corresponding to those
geometries, for R=0.125:(b) evolution of the metal front over-height with time and (c) evolution of the metal front velocity
with time
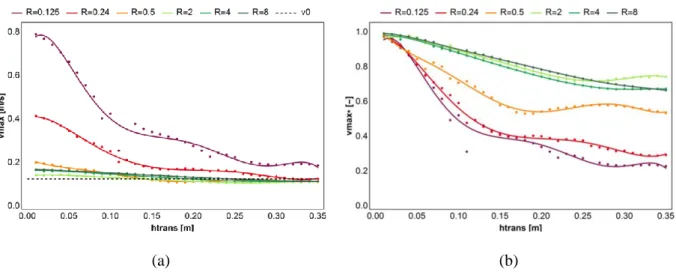
The maximal metal front velocity 𝑣𝑚𝑎𝑥 being considered as the critical parameter to characterize filling, it is given in Figure 12-(a) as a function of both R and ℎ𝑡𝑟𝑎𝑛𝑠. The dotted line corresponds to 𝑣0, the metal front velocity in case of theoretical instantaneous adaptation to the new cavity section. 𝑣𝑚𝑎𝑥 is observed to decrease when increasing ℎ𝑡𝑟𝑎𝑛𝑠, as expected. However, the impact of ℎ𝑡𝑟𝑎𝑛𝑠 on 𝑣𝑚𝑎𝑥 is seen not to be linear. Considering the case R=0.125, two inflexion points are observed at approximately ℎ𝑡𝑟𝑎𝑛𝑠= 100𝑚𝑚 and ℎ𝑡𝑟𝑎𝑛𝑠 = 225𝑚𝑚. They correspond to the change of oscillation of the maximal velocity: for transition heights smaller than 100 mm, 𝑣𝑚𝑎𝑥 is reached
during the first oscillation, for transition heights between 100 mm and 225 mm, during the second oscillation, and so on. Therefore, adding a transition height has an impact for small ℎ𝑡𝑟𝑎𝑛𝑠 values, but it seems that it is no use adding a very high transition height as its impact is more and more reduced. For example for R=0.125, a transition height of 85 mm permits to divide 𝑣𝑚𝑎𝑥 by a factor 2 compared to a sudden change. However, by considering a transition height twice larger, 𝑣𝑚𝑎𝑥 is additionally reduced by only 30%.
As expected, when the section change ratio is larger and tends to 1, the maximal velocity is lower, as can be seen in Figure 12-(a). In order to analyze the ℎ𝑡𝑟𝑎𝑛𝑠 impact for the different R values, the maximal velocity, function of ℎ𝑡𝑟𝑎𝑛𝑠, is normalized by the maximal velocity when the section change is sudden (noted 𝑣max_0) in Figure 12-(b), noted 𝑣𝑚𝑎𝑥∗= 𝑣𝑚𝑎𝑥/𝑣max_0. v0 is the metal front velocity before the bottom of the section change and vmax_0 is the maximal velocity reached by the metal in the case of a sudden section change.One can notice that increasing the transition height is less and less efficient in reducing the metal front velocity when the section ratio R is larger ; the transition height should be higher than 350 mm to divide the maximal velocity by a factor 2 when R=0.5 while ℎ𝑡𝑟𝑎𝑛𝑠 = 88𝑚𝑚 would permit to reach this objective when R=0.125. When considering a section enlargement instead of a section restriction, the impact of the section change ratio on the maximal velocity is even more eased. For the three R>1 values tested in Figure 12-(a), the transition height impact on 𝑣𝑚𝑎𝑥 is almost identical and rather inefficient. Even considering a transition height of 350 mm, it is not possible to reduce the maximal velocity by a factor 2 (Figure 12-(b)).
(a) (b)
transition height. Dots correspond to the Lagrangian model results, and lines are 6th-order polynomial fits.
Contrarily to the case of a sudden section change, it is not possible to express analytically the maximal metal front velocity in a progressive section change by only considering the metal inertia. At each height, the metal acceleration is induced by competition between inertia (leading to acceleration in a section restriction) and gravity (leading to deceleration to fit the predefined pressure ramp setting). The link between cavity geometry (through both section change ratio and transition height) and maximal front velocity, knowing the pressure ramp, is obtained numerically by solving the Lagrangian equations. The curves obtained for 𝑃̇ = 2500𝑃𝑎. 𝑠−1in Figure 12-(a) can be obtained for any pressure
ramp value by using the same method
4.3.
Section change shape effect
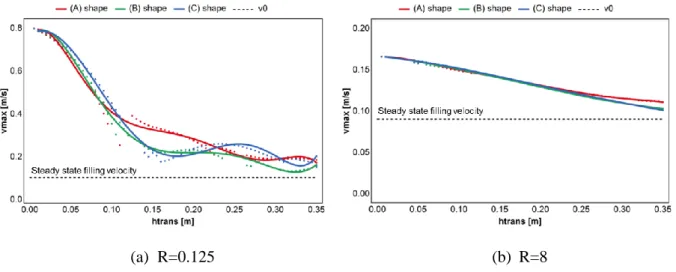
All the results presented in the previous section are obtained by the Lagrangian model considering a transition shape of (A) type (Figure 3), which means a constant transition angle. In this case, the section transition is not linear. When considering a section restriction, the section variation is stronger in the transition bottom part and weaker in the top part (Figure 3-(c)-left) and it is the opposite when considering a section enlargement (Figure 3-(c)-right). In order to characterize the impact of the transition shape on the filling dynamics, and potentially to identify an optimal section transition shape, three different shapes are studied, as presented in section 2.3. The (B) shape corresponds to a linear evolution of R(h) ratio from 1 at the transition bottom to final R ratio at ℎ = ℎ𝑡𝑟𝑎𝑛𝑠. The (C) shape corresponds to a square root evolution of R(h) ratio between the same limits. The impact of the transition shape on the maximal metal front velocity is illustrated in Figure 13 for two section change ratios: R=0.125 (Figure 13-(a)) and R=8 (Figure 13-(b)). In both cases, the results are very similar for the three section shapes. The impact of the transition height on the maximal metal front velocity, for a fixed pressure ramp and section ratio, is almost identical. In the case of the section restriction R=0.125 (Figure 13-(a)), the velocity decrease is only slightly faster when increasing the transition height for the (A) shape. This observation is only true when the transition height remains smaller than the tube
diameter as for higher transition heights; the model noise is larger than the shapes discrepancy. In the case of R=8, the shape effect is even less visible, except for very high transition heights. Therefore, the transition shape does not impact significantly the filling dynamics, only the transition height has a visible effect.
(a) R=0.125 (b) R=8
Figure 13 : Maximal velocity 𝑣𝑚𝑎𝑥 as a function of the transition height and for the three studied transition shapes, for (a) R=0.125 and (b) R=8. Dots correspond to the Lagrangian model results, and lines are 6th-order polynomial fits.
4.4.
Maximal filling velocity map
Thanks to the presented filling dynamics investigation, it is possible to define the relationship between the mold cavity geometry, the filling pressure ramp and the induced maximal velocity reached by the metal front during filling. If the filling criterion, not to have oxides defects, is chosen to be 0.5 m.s-1 for the maximal metal velocity, it is possible to directly link pressure ramp, section ratio and transition height, as shown in the map Figure 14.
The pressure ramp is limited at 3000 Pa/s in this study, corresponding to the machine extreme limit. Moreover, only section ratios smaller than 0.5 are represented in the graph. Indeed, for larger values, the maximal velocity remains under 0.5 m/s, whatever the transition height is (in the studied pressure ramp range). This conclusion is also true for any section enlargement. From these results, one can see that when the section ratio is larger than 0.25, it is no use adding any transition height: the metal front velocity would never exceed 0.5 m/s, as can be seen by the red dashed line in Figure 14. On the
opposite, when the section restriction is as small as 0.1, the transition height must be at least of 180 mm.
Figure 14 : Maximal pressure ramp not to exceed v=0.5 m/s during filling as a function of the section change ratio R
and the transition height ℎ𝑡𝑟𝑎𝑛𝑠
5. Design algorithm in LPC
The map given in Figure 14 is a precious tool in process parameters and design definition in LPC, as it permits to both determine the appropriate filling pressure ramp for any complex shape part and design the filling system adapted to low pressure casting. Therefore, the authors propose a specific methodology, presented in Figure 15. Knowing the geometry of a part cast in LPC, the casting parameters definition can be obtained by following the given algorithm:
- The N possible orientations of the part are selected by considering castability criteria. Indeed, the gates of the filling system, placed at the bottom of the part in LPC process, cannot be placed in any functional zone or in hot spots of the part. Moreover, some geometrical constrains can limit the access to certain zones of the part. Therefore, the possible casting orientations of a part are limited.
- For the N possible orientations, the maximal vertical section change R is determined, and the part orientation giving the smallest R value is selected.
- The height of this critical section change is determined.
- The section of the part bottom being known, the section change ratio of the filling system can be determined (for a known rising tube section).
- Given the R and htrans values of the part, the maximal filling pressure ramp can be found by
using the 3D map given in Figure 14 (or equivalent Lagrangian model results adapted to any LPC system).
- Considering that the filling system and the part are filled with the same pressure ramp and knowing R value of the filling system, the minimal transition height of the filling system can be found by using the 3D map given in Figure 14.
This simple route is the first one, to our best knowledge, offering a cast part design method tailored to the low pressure casting process. It open the validation way to define new design rules tailored to LPC to cast more complex part geometries.
Moreover, the oxide inclusions criterion of 0.5 m/s should be studied. Indeed, the Lagrangian model permits to characterize the fluid flow during filling. Therefore, a map equivalent to the one given in Figure 14 could be obtained for any other criterion. For example, if
backflow is more critical than metal front velocity for oxide entrapment, as proposed by Liu et al [6], the criterion applied to the Lagrangian model would simply be ḣ positive. To accurately define the flow criterion adapted in the case of LPC, an extensive experimental study is needed to link geometry and process parameters to the final mechanical properties of the cast parts. Such an experimental study could also be used to validate a numerical model of oxide formation and entrapment [20].
6. Conclusions
In this study, the effects of the section variations on metal oscillations appearing during filling by low pressure have been experimentally and numerically investigated. The findings of this work are as follows:
- An industrial-size experimental study permits to highlight the major impact of pressure ramp and total horizontal section variation on fluid flow oscillations. Moreover, for a given section change ratio, the section transition height increase is shown to lower the oscillatory phenomenon, while the section transition shape does not significantly impact the filling dynamics.
- A new analytical expression linking pressure ramp, system geometry and resulting maximal metal front velocity is proposed. This model based on Lagrangian is validated by CFD simulation and experimental results.
- New design rules tailored to LPC are recommended to limit oxide inclusion defects. An algorithm is proposed to determine the maximal filling pressure ramp and the minimum filling system height. This algorithm can be applied to any other oxide inclusion criterion or LPC system.
The authors would like to acknowledge the contribution of colleagues. Thanks are due to J. BOURGEOIS, J. NEGRE and S. BUSSETTA of the Arts et Métiers ParisTech for their precious technical support. Prof. S.KHELLADI from DynFluid laboratory of the Arts et Métiers ParisTech is thanked for its precious help on fluid flow simulation.
8. Bibliography
[1] J. Campbell, Castings principles : the new metallurgy of cast metals, Butterworth Heinemann, 2003.
[2] J. Campbell, Entrainment defects, Mater. Sci. Technol. 22 (2006) 127–145. doi:10.1179/174328406X74248.
[3] J. Runyoro, J., Boutorabi, S. M. A., & Campbell, Critical gate velocities for film-forming casting alloys: a basis for process specification, AFS Trans. 100 (1992) 225–234.
[4] J.-H. Kuo, F.-L. Hsu, W.-S. Hwang, Development of an interactive simulation system for the determination of the pressure-time relationship during the filling in a low pressure casting process, Sci. Technol. Adv. Mater. 2 (2001) 131–145. doi:10.1016/S1468-6996(01)00039-0. [5] R. Cuesta, A. Delgado, A. Maroto, D. Mozo, Numerically modeling oxide entrainment in the
filling of castings: The effect of the webber number, JOM. 58 (2006) 62–65. doi:10.1007/s11837-006-0229-z.
[6] S.-G. Liu, F.-Y. Cao, T. Ying, X.-Y. Zhao, J.-S. Liu, H.-X. Shen, S. Guo, J.-F. Sun, Formation Mechanism of Surface Crack in Low Pressure Casting of A360 Alloy, Metall. Mater. Trans. B. 48 (2017) 2826–2835. doi:10.1007/s11663-017-1035-4.
[7] M. Jolly, Prof. John Campbell’s ten rules for making reliable castings, JOM. 57 (2005) 19–28. doi:10.1007/s11837-005-0091-4.
[8] S.G. Liu, F.Y. Cao, X.Y. Zhao, Y.D. Jia, Z.L. Ning, J.F. Sun, Characteristics of mold filling and entrainment of oxide film in low pressure casting of A356 alloy, Mater. Sci. Eng. A. 626 (2015) 159–164. doi:10.1016/j.msea.2014.12.058.
[9] H. Puga, J. Barbosa, T. Azevedo, S. Ribeiro, J.L. Alves, Low pressure sand casting of ultrasonically degassed AlSi7Mg0.3 alloy: Modelling and experimental validation of mould filling, Mater. Des. 94 (2016) 384–391. doi:10.1016/j.matdes.2016.01.059.
[10] J.C. Hogg, H. Westengen, D.L. Albright, Low pressure sand casting of magnesium alloys, in: Extr. Refining, Fabr. Light Met., Elsevier, 1991: pp. 57–65. doi:10.1016/B978-0-08-041444-7.50012-3.
[11] Z.-T. Fan, S. Ji, Low pressure lost foam process for casting magnesium alloys, Mater. Sci. Technol. 21 (2005) 727–734. doi:10.1179/174328405X43199.
[12] J. Duan, D. Maijer, S. Cockcroft, C. Reilly, Development of a 3D filling model of low-pressure die-cast aluminum alloy wheels, Metall. Mater. Trans. A Phys. Metall. Mater. Sci. 44 (2013) 5304–5315. doi:10.1007/s11661-013-1654-6.
validation of free surface flows during low pressure casting process, J. Mater. Process. Technol. 244 (2017) 320–330.
[14] A. Sanitas, M. Bedel, M. El Mansori, Experimental and numerical study of section restriction effects on filling behavior in low-pressure aluminum casting, J. Mater. Process. Technol. 254 (2018). doi:10.1016/j.jmatprotec.2017.11.013.
[15] S. Liu, C. Luo, G. Li, W. Gao, Z. Lu, S. Dai, Effect of pressurizing speed on filling behavior of gradual expansion structure in low pressure casting of ZL205A alloy, China Foundry. 15 (2018) 276–282. doi:10.1007/s41230-018-8044-z.
[16] A. Sanitas, M. Bedel, M. El Mansori, Filling Characterization into a Section Restriction in Low-Pressure Casting, in: Proc. 3rd World Congr. Mech. Chem. Mater. Eng., 2017: pp. 6–7. doi:10.11159/mmme17.105.
[17] ANSYS Inc., Ansys Fluent Theory Guide, (2013).
[18] N.K. Kund, P. Dutta, Numerical study of solidification of A356 aluminum alloy flowing on an oblique plate with experimental validation, J. Taiwan Inst. Chem. Eng. 51 (2015) 159–170. doi:10.1016/J.JTICE.2015.01.002.
[19] A. Sanitas, Étude expérimentale et numérique de la coulée basse-pression de l’alliage de magnésium RZ5 dans des moules en sable imprimés en 3D, ENSAM, 2017. http://www.theses.fr/s134727 (accessed February 22, 2018).
[20] C. Reilly, N.R. Green, M.R. Jolly, The present state of modeling entrainment defects in the shape casting process, Appl. Math. Model. 37 (2013) 611–628. doi:10.1016/j.apm.2012.04.032.
9. Appendix
Table 2 : Initial and boundary conditions used in the Lagrangian model
Step 1 Step 2
Initial conditions
ℎ(0) = 0; ℎ̇(0) =𝜌𝑔(1+𝛽)𝑃̇ ℎ(0) = 0;ℎ̇(0) = ℎ̇(𝑡𝑡𝑟𝑎𝑛𝑠) from step 1 (A1)
External force 𝑭𝒑
𝐹𝑝= −(𝜌𝑔(ℎ𝑡− ℎ𝑓0) + 𝑃̇𝑡)𝑆𝑓
𝜕ℎ𝑓
𝜕ℎ 𝐹𝑝= 𝑆𝑓R𝛽 (𝜌𝑔(ℎ𝑡− ℎ𝑓0) + 𝑃̇(𝑡𝑡𝑟𝑎𝑛𝑠+ 𝑡))
(A2)
Table 3 : Terms of the Lagrangian motion model depending on the transition shape A, B or C, when the metal front is in the section transition (Step1)
Kinetic energy of Volume 3
{ 𝐸𝑐3_A= 0.5𝜌𝑆𝑓𝛽𝑅(ℎ)3/2ℎℎ̇2 𝐸𝑐3B = 0.5𝜌𝑆𝑓𝛽ℎ𝑡𝑟𝑎𝑛𝑠 𝑅 − 1𝑅(ℎ)2ln( 𝑅 − 1 ℎ𝑡𝑟𝑎𝑛𝑠ℎ + 1)ℎ̇ 2 𝐸𝑐3_C= 𝜌𝑆𝑓𝛽 ℎ𝑡𝑟𝑎𝑛𝑠 𝑅2− 1(√1 − 1 − 𝑅2 ℎ𝑡𝑟𝑎𝑛𝑠 ℎ − 1) 𝑅(ℎ) 2ḣ2 (A3)
Potential energy of Volume 3
{ 𝐸𝑝3_A= 𝜌𝑆𝑓𝛽𝑔ℎ2(121 +√𝑅(ℎ)6 +𝑅(ℎ)4 ) 𝐸𝑝3_B= 𝜌𝑆𝑓𝛽𝑔 ( ℎ2 2 + R − 1 ℎ𝑡𝑟𝑎𝑛𝑠 ℎ3 3) 𝐸𝑝3_C= 𝜌𝑆𝑓𝛽𝑔 2ℎ𝑡𝑟𝑎𝑛𝑠 3(1 − 𝑅2)( 2ℎ𝑡𝑟𝑎𝑛𝑠 5(1 − 𝑅2)(1 − ((1 − (1 − 𝑅2) ℎ ℎ𝑡𝑟𝑎𝑛𝑠) 5/2 ) − ℎ (1 − (1 − 𝑅2) ℎ ℎ𝑡𝑟𝑎𝑛𝑠) 3/2 ) (A4)
Metal height evolution in the furnace ℎ𝑓(ℎ) ℎ𝑓𝐴(h) = ℎ𝑓0− ℎ 𝛽 3(1 + √𝑅(ℎ) + 𝑅(ℎ)) ℎ𝑓𝐵(h) = ℎ𝑓0− 𝛽 (ℎ + 𝑅 − 1 ℎ𝑡𝑟𝑎𝑛𝑠 ℎ2 2) ℎ𝑓𝐶(h) = ℎ𝑓0+ 𝛽 2ℎ𝑡𝑟𝑎𝑛𝑠 3(1 − 𝑅2)((1 −(1 − 𝑅2) ℎ ℎ𝑡𝑟𝑎𝑛𝑠 ) 3/2 − 1) (A5)
Table 4 : Terms of the Lagrangian motion model depending on the transition shape, when the metal front is above the section transition top (Step2)
Kinetic energy of Volume 3
{ 𝐸𝑐3_A= 0.5𝜌𝑆𝑓𝛽𝑅3/2ℎ𝑡𝑟𝑎𝑛𝑠ḣ2 𝐸𝑐3_B= 0.5𝜌𝑆𝑓𝛽𝑅2 ℎ𝑡𝑟𝑎𝑛𝑠 𝑅 − 1𝑙𝑛𝑅ḣ2 𝐸𝑐3_C= 𝜌𝑆𝑓𝛽𝑅2ℎ𝑡𝑟𝑎𝑛𝑠 𝑅 + 1ḣ2 (A6)
Potential energy of Volume 3
{ 𝐸𝑝3_A= −𝜌𝑆𝑓𝛽𝑔ℎ𝑡𝑟𝑎𝑛𝑠2(𝑅 2+ 2 3√𝑅(1 − √𝑅) + (1 − √𝑅)2 4 ) 𝐸𝑝3_B= −𝜌𝑆𝑓𝛽𝑔ℎ𝑡𝑟𝑎𝑛𝑠2( 1 + 3𝑅 6 ) 𝐸𝑝3_C= 𝜌𝑆𝑓𝛽𝑔 2ℎ𝑡𝑟𝑎𝑛𝑠 2 3(1 − 𝑅2)(1 + 2 5 1 − 𝑅5 1 − 𝑅2) (A7)
Metal height evolution in the furnace ℎ𝑓(ℎ) ℎ𝑓_𝐴(ℎ) = ℎ𝑓0− ℎ𝑡𝑟𝑎𝑛𝑠 𝛽 3(1 + √𝑅 + 𝑅) − 𝑅𝛽h ℎ𝑓𝐵(ℎ) = ℎ𝑓0− (1 + R) 𝛽 2ℎ𝑡𝑟𝑎𝑛𝑠− R𝛽ℎ ℎ𝑓_𝐶(ℎ) = ℎ𝑓0− 2 3 1 − 𝑅3 1 − 𝑅2𝛽ℎ𝑡𝑟𝑎𝑛𝑠− R𝛽ℎ (A8)