produced by laserplasma interaction for aeronautical applications on AA 2024 based substrates
-Optics and Laser Technology - Vol. 141, p.107095 - 2021
Optics & Laser Technology 141 (2021) 107095
Available online 10 April 2021
0030-3992/© 2021 The Author(s). Published by Elsevier Ltd. This is an open access article under the CC BY-NC-ND license
(http://creativecommons.org/licenses/by-nc-nd/4.0/).
Full length article
Towards selective laser paint stripping using shock waves produced by
laser-plasma interaction for aeronautical applications on AA 2024
based substrates
Selen Ünaldi
a,*, Kosmas Papadopoulos
b, Alexandre Rondepierre
a,c, Yann Rouchausse
a,
Alexandra Karanika
d, Florent Deliane
e, Konstantinos Tserpes
e, Giannis Floros
b,
Emmanuel Richaud
a, Laurent Berthe
a,*aPIMM, UMR8006 ENSAM, CNRS, CNAM, 151 bd de l’Hˆopital, 75013 Paris, France
bLaboratory of Technology & Strength of Materials (LTSM), Department of Mechanical Engineering & Aeronautics, University of Patras, Patras 26504, Greece cTHALES LAS France, 78990 Elancourt, France
dHellenic Aerospace Industry S.A., P.O. Box 23, GR 320 09 Schimatari, Greece
eRESCOLL Soci´et´e de Recherche, 8 All´ee Geoffroy Saint Hilaire CS 30021, 33615 Pessac cedex, France
A R T I C L E I N F O
Keywords:
Laser paint stripping Adhesion tests Laser shock processes Epoxy
Polyurethane Water confinement
A B S T R A C T
Laser stripping is a process which typically includes different forms of ablation phenomena. The presented work investigates a mechanical stripping process using high pressure laser-induced shock waves in a water confined regime. Power density is studied as a parameter for selective laser stripping on painted specimens and for adhesion relations with single layer epoxy targets. A flashlamp-pumped Nd:YAG laser with fixed spot size (4 mm) is shot on single layer epoxy and several layers of polymeric paint applied on a AA 2024-T3 (Aluminium) substrate. After laser treatment, samples are investigated with optical microscopy, profilometer and chemical analysis (FTIR & TGA). The results show that selective laser stripping is possible between different layers of external aircraft coatings and without any visual damage on the substrate material. In parallel to the experi-mental work, a numerical model has been developed to explain the background of the physical mechanisms and to qualitatively evaluate the detailed stress analysis and interfacial failure simulation for a single layer of epoxy on an aluminium substrate. The predicted failure patterns agree with the surfaces of the tested specimens observed by a microscope.
1. Introduction
Paint stripping is an essential process in the aeronautical industry since aircrafts need restoration, maintenance and routine inspection during their life time [1]. In the 1970s, the Air Force Logistics Command started to inspect alternative stripping methods to reduce the environ-mental drawbacks caused by the hazardous chemicals and waste disposed from the chemical stripping process. They found that plastic media blasting and laser stripping are the most applicable techniques mostly due to the environmental concerns. Eventhough the plastic media blasting found replaceable by the chemical stripping, there were still limitations on the use of it. While operating plastic media blasting,
the sensitive areas of the airplanes should be covered and the dust should be treated both during the blasting and after stripping opera-tions. In addition, since plastic media blasting is not complete selective stripping process and in many cases damages the substrate surface (AA 2024-T3), laser stripping appeared as the most promising technique. Environmental friendliness, lower investment costs and the monitorable aspects of laser stripping process makes the application more favorable for industrial applications [2,3].
The external surface of aircrafts consists of a substrate with a surface treatment, a primer and a top coat. Substrates should be chosen from resistant materials like aluminium [4] with a surface treatment. The main function of the primer is to present a good level of adhesion
* Corresponding authors.
E-mail addresses: [email protected] (S. Ünaldi), [email protected] (K. Papadopoulos), [email protected] (A. Rondepierre),
[email protected] (Y. Rouchausse), [email protected] (A. Karanika), [email protected] (F. Deliane), [email protected]
(K. Tserpes), [email protected] (G. Floros), [email protected] (E. Richaud), [email protected] (L. Berthe).
Contents lists available at ScienceDirect
Optics and Laser Technology
journal homepage: www.elsevier.com/locate/optlastechttps://doi.org/10.1016/j.optlastec.2021.107095
between layers and protecting the substrate from corrosion. In general, primers for aircrafts are made of epoxy components while top coats consist of polyurethane. The role of a top coat in aeronautical applica-tions is to resist external environmental attacks (dust, sand, lightning strike) [5].
Laser paint stripping is common in the literature [6], however most research is focused on the paint ablation as a result of thermal effects such as Jasim et. al explained [7]. This paper presents a new stripping process which based on spallation phenomena produced by shock wave propagation via laser-plasma interaction from the back faces of speci-mens (aluminum side). This technique can be selective for thin coatings via (playing with the laser parameters) pure mechanical effects which is applied on a stack of AA 2024-T3 + External Aircraft Coatings (EAC) and AA 2024-T3 + Epoxy specimens.
The selective stripping capacity for polymeric painted layers as function of power density for AA 2024-T3 + EAC configuration is monitored. Moreover, laser stripping and adhesion relations on AA 2024-T3 + Epoxy are observed in order to obtain the process’s capability from the back face applications.
This paper mainly consists of three parts. Part I describes the laser shock stripping process, part II presents methods and experimental procedure and part III demonstrates results and discusses them by focusing on the capability of the process to control the stripping depth as function of power density. Moreover, specific stripping phenomena is considered and compared with modeling via LS-DYNA software for single epoxy layer samples.
2. Process description
When a high intensity pulsed laser source (1 J, 10 ns) is focused on a target, high pressure plasma (GPa range) is generated and a shock wave is induced inside the specimen. For applications, confined regime with water is preferred for many years (see Fig. 2) [8]. Compared to the direct ablation regime (without any confinement), generated pressure on the target is two times longer and four times higher with the water confinement [9,10].
To present the physical principle, Fig. 1 shows a space–time diagram of stresses during the propagation of a representative shock wave pro-duced by laser-plasma interaction with an accoustic approximation (pressure duration of “τ”) [11]. In Fig. 1a, S-coat (sub-coat) includes
structural and exterior primers. In addition, T-coat (top-coat) consists of base and clear coat. Fig. 1b describes the case of an AA 2024-T3 with single epoxy layer. The straight lines represent the shock wave and the dotted lines correspond to the release wave. The created shock wave travels up to the back free surface of the specimens as shown with red arrows and then becomes a release wave after being reflected from the free surface. Blue arrays represent the initial release wave and the
reflected shock wave (reflection of the release). When the reflected release wave and the initial release wave meet, tensile stress creation occurs as depicted by a circle in Fig. 1 [12]. If it is high enough, damage of the material and/or interface debonding could occur which based on the current spallation phenomena [11]. By changing the laser parame-ters (pulse duration, number of applied pulses and different configura-tions of them), the tensile stress location can be modified at the desired depths.
These 1D diagrams broadly represent the basic stripping process using shock produced by laser-material interaction. However more complex 3D simulations are required to describe the physical mecha-nism as it will be seen later.
3. Materials and methods
3.1. General view
The applied procedure can be categorized as:
• Initial State Properties (Thickness measurements & Chemical Analysis)
• Laser Shock Tests (Stripping Treshold Evaluation)
• Post Mortem Analysis for Material States (Optical Microscopy, Pro-filometer & Chemical Analysis)
• Numerical Work (Observe Local Stress Levels)
In order to determine each layer’s thickness (direct stack sizing) before any laser application, sample characterization is performed. To proceed the sample characterization, two methods are followed. One is performing the cut-off of samples to observe layer transitions and cor-responding layer thicknesses. The second one is physico-chemical analysis (FTIR and TGA) which are used both before and after laser impacts to quantify the amount of unstripped layers. Since organic layers are thermally unstable, especially TGA appears as a pioneering method. Also, to determine the stripped layer thickness, a profilometer is utilized. The effect of the power density is measured on a single layer epoxy and several layers of polymeric paint on AA 2024-T3. Moreover, in order to observe the specific stress distribution along the focal spot for AA 2024-T3 + Epoxy samples, numerical work is done.
3.2. Material properties under shock using back face velocity analysis
Shocks produced via laser, generate high pressure (GPa) and high stress rate (106s−1) within the material. To validate material modeling in
these extreme conditions, mechanical testing is done in-situ. Well controlled laser loading (see part 3.3) is applied on the front surface of the target and material response is extracted from time resolved rear free
surface velocity. The material response measured by well known VISAR (Velocity Interferometer for Any System) diagnostic which is based on the Michelson Interferometer (see Fig. 2) [13 14]. It measures the Doppler Shift of mono mode probe laser (532 nm) that is reflected on the back face of the accelerated target via shock wave [15]. Hence, this accurate time-resolved measurement of the rear-free surface velocity gives an information about the propagation of shock waves and release waves from the top surface (plasma generation) to the rear surface (VISAR measurement).
In this paper, VISAR technique has been used to validate the Johnson Cook model implemented for AA 2024-T3 alloys (see Fig. 11) which has also done previously by Peyre et al. [16]. Calculations also give a real-istic stress fields at the interface of the coatings, based on shock wave travel within the alloys (see part 5.1.3). Epoxy could not be tested by this technique since it is not reflective at the laser probe wavelength.
3.3. Laser set-up
Experiments were conducted at Hephaistos facility, PIMM lab, Paris, France. The laser used for the experiments is a Gaia HP laser from THALES company (France). It is a flashlamp-pumped Nd:YAG with a Gaussian temporal profile. The laser can produce 14 Joules of energy with 7.2 ns of pulse duration (FWHM) and 2 Hz of repetition rate at wavelength of 532 nm.
The obtained focal spots both with and without DOE (Diffractive Optical Element) obtained via camera (Camera Basler acA2040-25gm/ gc, Monochrome, CMOS 1′′with a Pixel Size of 5,5 μm × 5,5 μm) are
represented in Fig. 3.
As one can see in Fig. 3a, the spatial shape is not homogeneous around the focal spot which is due to diffraction effect during the beam transportation and amplification. Hence there is a strong connection between the pressure and intensity profile, in order to apply an equal pressure through the whole focal spot on specimens, DOE is used (see
Fig. 3b) [12]. The 4 mm focal spot was obtained by a focal length of 198 mm lens.
For the performed experiments, mono impact (single beam) config-uration is used. In addition, the energy output from the laser can be modified/controlled with the help of lambda quarter plate and polarizer rotated by motor. Energy measurement is done shot by shot and cali-brated before each set of experiment using a calorimeter (QE50LP-H- MB-QED, Gentec, Qu´ebec, QC, Canada).
3.4. Samples
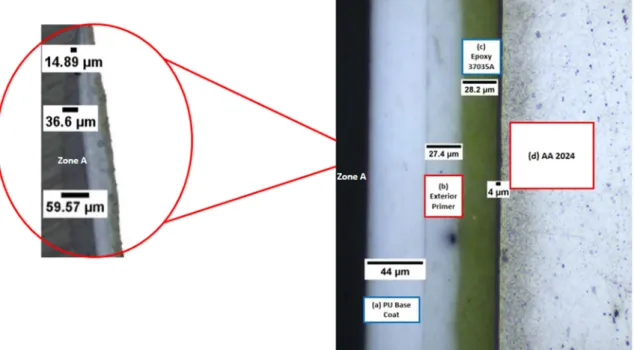
Three kind of samples are investigated which are described in Fig. 2, they were painted and prepared by manufacturers (RESCOLL, Akzo-Nobel & HAI). There are two different surface treatments for all sample types: Chromic acid anodization (CAA) and chemical etching (CE). The first sample type is AA 2024-T3 substrates which is used for VISAR ex-periments to monitor the shock wave behavior within the specimens (labeled as Sample A). The second type is AA 2024-T3 substrates with single epoxy layers with different surface treatments. Sample AA 2024- T3 CAA + Epoxy 37035A is labeled as Sample B and AA 2024-T3 CE + Epoxy CA 7049 is labeled as Sample C. The third type is AA 2024-T3 substrates with chromic acid anodization surface treatment plus External Aircraft Coatings (Sample D) as explained in Table 1. In order to determine the thickness of each layer, specimens are cut by a metallo-graphic cut-off machine then observed by an optical microscope (ZEISS Axio Imager 2). Fig. 4 shows typical view for Sample D.
The thickness of the AA 2024-T3 is 800 and 970μ m for all
config-urations. For the Sample B, the thickness of the epoxy layer is as 28.5μ m
and substrate surface has a chromic acid anodization surface treatment.
Fig. 2. Specimens Layer Configurations.
Fig. 3. Comparison of spatial shapes for 4 mm spot size, without & with DOE.
Table 1
Categorization of each sample with the thickness of each layer, respectively. CAA refers to Chromic Acid Anodization & CE is for Chemical Etching.
Base Material AA 2024-T3 (970μ m) -A AA 2024-T3 CAA (800μ m) -B AA 2024-T3 CE (970μ m) -C AA 2024-T3 CAA (800μ m) -D Structural
primer – Epoxy 37035A (28.5μ m)
Epoxy CA 7049 (28.1μ m) Epoxy 37035A (28.2μ m) Exterior Primer – – – Aerodur HS 2121 (27.4μ m) Base Coat – – – Aerobase (44μ
m) Clear Coat – – – Clearcoat UVR
For Sample C, the epoxy thickness is 28.1 ± 4μ m with a surface
treat-ment of chemical etching (all the stack sizing and descriptions are gathered in Table 1). Structural primer has a thickness range of 28.2 ± 4μ m and exterior primer is measured as 27.4 ± 2.5μ m for the
inves-tigated Sample D. Moreover, the polyurethane made base coat has a thickness of 44 ± 4.5μ m for analyzed samples. In addition, the final layer (clear coat) has a thickness in between 14.9 and 60μ m as labeled
as Zone A (Fig. 4). Since the clear coat is a transparent layer, we can not identify it without zooming out from the cross-section cut.
3.5. Depth profile analysis
Depth of stripped coating for Sample B and Sample C have been investigated using optical profilometer Dektak 150. After applied laser impacts, stripped areas along the scanned focal spots are obtained. Since there are thickness variations especially for the clear coat as explained previously in Fig. 4, we can not expect them to have the same thickness for the whole sample which makes the measurement less accurate for the
samples that have more than one layer. As a result, depth profile mea-surements are not performed for Sample D after laser impacts.
3.6. Physico-chemical characterization
FTIR (Fourier Transform InfraRed) spectra is collected in ATR (Attenuated Total Reflectance) mode using a Frontier 100 apparatus (Perkin Elmer) equipped with a diamond crystal and driven by the spectrum software. 16 scans are collected from 650 to 4000 cm−1 with a
2 cm−1 minimal resolution. FTIR analysis is performed to obtain signals
for Sample B without any laser impact & Sample D after laser impact. The purpose of that is to obtain an information about the remained organic components on the aluminum substrate for Sample D after applied laser impacts in comparison with Sample B.
Thermogravimetric Analysis (TGA) is a method for monitoring the alteration of the weight against the temperature and time by certain atmospheres such as nitrogen and oxygen [17,18,19]. Moreover, the obtained weight loss is linked to different phenomenas. In the case of
Fig. 4. Figure on the right is the cross-section cut of AA 2024-T3 CAA + EAC under the optical microscope. a) Polyurethane base coat, b) Exterior Primer, c) Structural Primer, 4μ m of surface treatment & the clear coat is labeled as Zone A. The figure left is the zoom-out of the cross section to demonstrate the thickness
variation for the clear coat layer.
epoxies, only volatilization of degraded polymer is expected
[20,21,22,23]. TGA (Thermogravimetric Analysis) was performed using a Q500 apparatus (TA Instruments) driven by TAQ series explorer. Tested samples were placed in platinum pans and were subjected to heating ramps from room temperature to 900 ◦C at a 10 ◦C min−1 rate
under 50 ml min−1 nitrogen gas flow. Results were interpreted using TA
Universal Analysis software.
4. Numerical model
The 3D model has been developed using the explicit FE (Finite Element) software LS-DYNA. The dimensions of the aluminum/epoxy plate modeled are 80 mm × 125 mm × 0.97 mm and the thickness of the epoxy primer is 28μ m. The aluminum plate and the epoxy primer is
modelled using 3D solid elements with one integration point (ELFORM =1). The mesh size through the thickness of the material is 5μ m. Fig. 5a
shows a typical FE mesh of the plate. As shown in Fig. 5b, for the load area, a denser mesh is used.
Failure of thematerials’ interface (stripping) is simulated using the CZM (Cohesive Zone Modeling) method. The interface is modeled using 4-point cohesive elements (ELFORM = 19) with zero thickness [24]. Damage initiation and propagation at the interface are simulated using a bi-linear mixed-mode I + II traction-separation law. This law follows an elastic behavior until a specific stress and after that point there is a degradation of the properties until final failure. The material model through which the CZM method is implemented in LS-Dyna the *MAT_138_COHESIVE_MIXED_MODE. This material model needs
separate parameters which are referred as fracture toughness properties of the interface. Due to lack of the required fracture toughness param-eters of the aluminum/primer interface, the properties, which are used as input to the CZM method, belong to an adhesive with similar pa-rameters to the epoxy primer.
To simulate the high strain rate dependent behavior of the aluminum and the hydrodynamic behavior of the epoxy, the simplified Johnson Cook plasticity model and the Grüneisen equation of state are used respectively. Implementation in LS-Dyna is done via *MAT_10_ELAS-TIC_PLASTIC_HYDRO & *MAT098_SIMPLIFIED_JOHNSON_ COOK ma-terial models respectively [25]. The elastic and hydrodynamic material properties [26,24,27,28] which are used as input to the material models, are presented in Table 2 and Table 3.
The applied boundary conditions restrict the displacement along z- axis (through the thickness) at the bottom right and left edge nodes. The pressure profile (see Fig. 6), is applied at the center of the front face of aluminum, with diameter of 4 mm. It is made to have a correlation between the experimental and the numerical results [29].
The peak value of each pressure profile that corresponds to a specific laser power density value, is calculated through experimental data. The applied pressure values for the power densities are given in Table 4.
5. Results and discussion
5.1. Stripping threshold
In order to observe the effect of an applied power density on laser stripping, laser impacts were applied from the back face of samples (aluminium side). Fig. 7 gathers direct observation analysis for each sample.
Results can be classified as : Power densities in which layers are removed/stripped (blue), debonded (green) and at initial state (purple). From Fig. 7, for both painted samples and single layer epoxy speci-mens, stripping thresholds can be extracted as the smallest power den-sity from which the first flight off of the coating is detected. While calculating the power densities, the laser’s pulse duration, laser’s energy and focal spot were the main parameters. As explained in part 3.3, the energy calibrated shot by shot and the laser pulse duration was constant as 7.2 ns. Hence, the main parameter creates a deviation for the power density values was the spot size. Spot size observations made with the camera (see part 3.3) and then measured with ImageJ software. After, the standard deviation is calculated for spot sizes and consequently for power density values. According to calculations there is ± 13% of relative standard deviation for mean power density values. For the presented work, used power densities are calculated for 4 mm spot size. Threshold values obtained as 2.77 GW/cm2 for Sample D, 0.68 GW/cm2
for Sample B and 1.75 GW/cm2 for Sample C for 4 mm spot size. Mean
power densities for 2.77 GW/cm2 calculated as 3.04 GW/cm2 (± 13%),
for 0.68 GW/cm2 as 0.75 GW/cm2 (± 13%) and for 1.75 GW/cm2 as 1.93
(± 13%) GW/cm2 with the focal spot deviation.
5.1.1. Visual analysis
Above the stripping threshold, the power density has been increased gradually at different locations on the target at 3.2 GW/cm2, 5.8 GW/
cm2 and 8.8 GW/cm2 through 4 mm focal spot size. Then, samples have
been investigated by optical microscope to observe the stripped surface status and layer characteristics, qualitatively. Fig. 8 presents the optical
Table 2
AA2024-T3 mechanical properties for Simplified Johnson Cook Model [28]. Symbol Parameter Value Unit (SI)
ρ Density 2700 kg/m3
E Young’s Modulus 73084 MPa
ν Poisson’s ratio 0.33
A Strain Yield limit 352 MPa B Strain hardening modulus 440 MPa n Strain hardening exponent 0.42
C Strain rate coefficient 0.0083
Table 3
Elastic Plastic Hydrodynamic - Grüneisen for Epoxy Primer CA7049 [26]. Symbol Parameter Value Unit (SI)
ρ Density 1700 kg/m3
G Shear Modulus 1600 MPa
c0 Speed of the wave 2000 m/s s Linear Hugoniot slope coefficient 1.493
γ0 Material constant 1.13
Fig. 6. The Pressure Profile as a function of time [29]
Table 4
Pressure values for the corresponding laser intensities. Power Density (GW/cm2) Pressure (GPa)
1.75 2.72
2.28 3.00
microscope analysis of Sample D specimen’s surfaces after laser impacts where green layer is the structural epoxy primer (Epoxy 37035A layer). As the surface appears visually more or less green (the structural primer color), these results show that, both at low and high applied power densities, structural primer stays present on the substrate. Therefore, the exterior primer coating + subcoating assembly are stripped for the Sample D type. However, with the increase of the power density, the structural primer presence is reduced on the bare surface. Eventhough, optical microscope analysis gives us a qualitative infor-mation about the layer status after laser impact, since there are thickness variations mostly due to clear coat thickness as explained previously, we can not expect them to have homogenously distributed thickness all around the sample. That’s why instead of profilometer analysis, physico- chemical characterization has done for this sample type to obtain more quantitative data.
For Sample B and Sample C, partial stripping (damage ring) and complete stripping phenomenas were studied. With the increase of the power density, laser stripping status has been observed on specimens. Regardless of the type of an epoxy, surface treatment and base material’s thickness, we obtained a common process window for the applied power density values. For Sample B, complete stripping was observed at 1.75 GW/cm2 whereas for Sample C, partial stripping (damage ring) occured
at the same applied power density. Also, one can see that for Sample C at 2.28 GW/cm2, damage ring formation is occured and for Sample B at
2.28 GW/cm2 also damage ring formation observed in a different size.
For both sample types, at 8.23 GW/cm2, the complete stripping occured.
In order to deeper investigate this phenomena, additional numerical work was followed for the cases of damage ring and complete stripping.
Fig. 9 shows the profilometer results for the stripped epoxy depth along the focal spot with corresponding microscope images for spots. Comparing the obtained depth vs scanning distance curves, we can have an idea about the surface health after the laser stripping process (since
the thickness of an epoxy layer is known before any laser impact). In addition, for partial stripped impacts, almost perfect top-hat shape was observed in the middle of the spots. As one can see from Fig. 9, in this power density range (for 1.75 & 2.28 GW/cm2), the stripped/affected
diameter becomes smaller with the increase of the power density. Whereas its 4080μ m for Sample B at 1.75 GW/cm2, then it decreases to
3452μ m at 2.28 GW/cm2. And for Sample C, the stripped/affected
diameter is 3632μ m at 1.75 GW/cm2 and it then also decreases to
3588μ m.
Since the epoxy thickness was 28.1–28.5μ m as a result of the depth
observations, the substrate was not damaged by the laser impacts except at the 2.28 GW/cm2 for Sample B hence at this power density, the
maximum depth reached more than 30μ m (See Fig. 9b).
5.1.2. Chemical analysis
Thermogravimetric Analysis and Fourier Transform Infrared Spec-troscopy analysis have been performed. The purpose of using TGA was to verify the remaining organic coatings after a laser impact in com-parison with a single layer epoxy specimen and a sample which includes all external aircraft coatings. For Sample D and Sample B also the weight losses are correlated with the obtained stripping thresholds previously (see 5.1).
It is known that epoxies are thermally unstable and get decomposed at temperatures approximately above 300 ◦C. When decomposition is
performed, there is no char residue [30,31] (contrarily to degradation under air). Also, polyurethane coatings would degrade at lower tem-peratures than epoxies [32,33,34]. Therefore, TGA has been used under pure nitrogen atmosphere as a simple method for quantifying the re-sidual content of organic layers on the aluminum samples.
After obtained degradation curves which agreed well with the literature, the results linked with the laser stripping status and obtained maximum temperatures that corresponds to the temperature at which
Fig. 7. Stripping Threshold as a function of power density. No stripping (purple), start of debonding (green) and stripping (blue).
the greatest weight change occurs . The weight loss obtained by TGA was maximum (10.07%) with the highest stripping threshold for Sample D and minimum for Sample B (1.22%) with the lowest stripping threshold. For, Sample D after applied power density of 5.8 GW/cm2 the weight loss
value was in between those two samples (3.42%) (see Table 5). Eventhough, TGA is helpful for quantifying the remaining organic contents, in order to better understand the nature of the remaining structure, FTIR was utilized [35,36]. The purpose of using FTIR
diagnostic is to have a comparison between the single epoxy layer and the samples which already had a laser impact to see the remained organic coating type. First, the epoxy signature has been observed alone, then the comparison made with after applied laser impact surfaces.
In order to better understand the nature of the remaining organic content structure, FTIR was utilized [35,36]. It is challenging to identify epoxy resins by FTIR since this family of thermoset contains a great amount of prepolymer-hardeners. However, in most cases, they can be tracked back by the presence of some specific groups such as phenyls (1610 cm−1) [37,38], secondary alcohols (2 hydroxy propyl ether) at
(3400–3420 cm−1), isopropyl groups (2966 cm−1) [39], ethers (Ar-O-
CH2) and alcohol (CH-OH) groups respectively at 1039 and 1109 cm−1
[39].
Eventhough whole FTIR curves are obtained, only the range which is a typical absorbant for the epoxy is monitored. Since the Epoxy 37035A layer remained after 3.2 GW/cm2 and 5.8 GW/cm2 for Sample D
ac-cording to the optical microscope observations, it was also verified by FTIR spectras (see Fig. 10). Although we can not conclude the result as
Fig. 9. Obtained depth profiles for different power density values and different type of epoxies. Table 5
Obtained weight losses and stripping thresholds. Sample Name Weight Loss
(%) Stripping Treshold (GW/cm2) Maximum Temperature (◦C) Sample D 10.07 2.77 453.26 Sample D after 5.8
GW/cm2 shot 3.42
– 472.88
complete selective stripping, the comparison of these two different power densities underlined the more similar characteristic behavior for the impact of 3.2 GW/cm2 with the single epoxy layer by taking into
acount the obtained peaks at (3666, 3384, 2974 and 2901 cm−1) see
Fig. 10a. Hence corresponding peaks do not have a correlation for Sample D after 5.8 GW/cm2 and Epoxy 37035A (see Fig. 10b).
5.1.3. Numerical results
5.1.3.1. Model validation. A first verification of the shock wave
propa-gation simulation capability of the model was performed by comparing the numerical back-face velocities for a pure AA 2024-T3 specimen which has a thickness of 970μ m (Sample A) with an experimental curve
constructed by VISAR measurements at 3 GW/cm2. The comparison is
shown in Fig. 11. As shown, a good correlation has been achieved. The two graphs are close enough at the first peak and pull-back value but with a deviation at the second and third. The deviation was mainly attributed to the material model used and to the uncertainty in the correlation of the intensity with the exact applied pressure value.
Fig. 10. Comparison of FTIR Spectras.
Fig. 11. Comparison of experimental and numerical velocities at 3 GW/cm2 .
Fig. 12. Predicted initiation and propagation of failure of the cohesive zone for the cases of 1.75 GW/cm2 (a,b,c,d) and 8.23 GW/cm2 (e,f,g,h) power densities,
5.1.3.2. Interfacial failure propagation. Interfacial failure propagation
was proceeded for the case of Sample B. The purpose of the findings was to couple them with the obtained experimental results. Fig. 12 shows the failure propagation as a function of time for 2 different power density values.
In Fig. 12, the predicted initiation and propagation of failure of the cohesive zone for the cases of I = 1.75 GW/cm2 and I = 8.23 GW/cm2
was depicted. Two different failure patterns were observed. For the lower intensity, a damage ring was formed (beige color represents the failure/stripping within the Sample B & the blue color represents the undamaged area) while for the higher intensity the entire circular area failed. The predicted final failure patterns for the two intensities agree with those observed experimentally, although a difference in the thickness of the damage ring was obtained for the lower intensity. This finding is a first verification of the model’s capability to simulate laser shock-induced stripping.
5.1.3.3. Stress analysis. In order to understand the failure process of the
aluminum/epoxy interface, a detailed stress analysis was performed. The analysis was focused on the normal σz stresses, which are respon-sible for the stripping. Fig. 13 plots the contour of σz stresses developed on the surface of the epoxy at the interface at various stages of wave propagation (bottom pictures). The area where results are presented is the circular loading area. The compressive stresses can be distinguished by the blue color while tensile stresses by the red color. Fig. 13a shows when the compressive shock front reaches for the first time the epoxy, with a uniform stress field. With the propagation of the wave, this stress field tends to concentrate at the center thus forming an outer ring of weaker compressive stresses.
At this ring, the maximum tensile stresses were developed while at the center of the circle lower values of compressive stresses remained due to the development of a mach stem by the reflection of the shock front at the back free surface (see Fig. 14). Fig. 14 shows a schematic of
(a) (b)
(c) (d)
the mach stem formation caused by the interaction of the reflection (dotted circle) of a shock wave (solid circle), at the back free surface, induced by a blast. When the mach stem gets weaker a ring of tensile stress, like before, tends to concentrate at the center of the specimen. This stress propagation pattern at the surface of epoxy continues for as long as shock propagates. Because of these stresses were developed at the surface of the epoxy and not in any solid volume there is no com-parison with the yield stress limit or strength limit of the epoxy primer. In other words, no damage occurs due to the amplitude of the stresses because they don’t correspond to stresses that can be compared with the strength limit or yield limit since they are at the surface and not in any volume, of the epoxy material.
6. Conclusions
This article investigated the mechanical stripping process of shock wave propagation created via laser-plasma interaction on various specimens of AA 2024-T3 with multiple painting stacks. The main parameter of interest is power density and how it affects the results in selective stripping for Sample D. Obtained results highlight that, with the modified power density values, laser stripping process is capable of removing both exterior primer coating + subcoating assembly. Optical microscope is used to examine the surface of specimens after laser im-pulse impacts. Fourier Transfrom Infrared Spectroscopy (FTIR) and Thermogravimetric Analysis (TGA) methods are used to analyse coating characteristics both before and after laser impulsions. By coupling the TGA, FTIR, optical microscope and profilometer results, one might conclude that selective stripping can be achievable at certain applied power density values.
In addition, for Sample B and Sample C, adhesion relations are examined. The findings suggest that, regardless of the substrate thick-ness, the type of an epoxy and the surface treatments, partial stripping (damage ring) phenomena occurs. In order to understand the physical phenomena behind the partial stripping and to qualitatively evaluate the experimental findings, a numerical simulation of shock wave propaga-tion into an aluminum/epoxy specimen is performed. The predicted interfacial failure patterns (annular and circular) agree well with the failure surfaces of the tested specimens. Moreover, the detailed stress analysis reveals that the distribution of stresses under the focal spot size is not homogeneous, which is explained by the mach stem formation phenomenon. The model, when fed with the actual material properties, is a promising contribution for future work that seeks to optimize the laser shock wave process and to conduct virtual testing.
Funding
This project has received funding from the Clean Sky 2 Joint
Undertaking under the European Union’s Horizon 2020 research and innovation programme.
Declaration of Competing Interest
The authors declared that there is no conflict of interest.
Acknowledgments
The authors acknowledge the support of Marc Vander Geest at Akzo Nobel, Netherlands, for his work on sample preparation. The authors also acknowledge discussions with Raoudha Seddik at ENSAM-Paris Tech, Paris.
References
[1] J. Kozol, An environmentally safe and effective paint removal process for aircraft , JOM (2001) 20–21. arXiv:https://doi.org/10.1007/s11837-001-0172-y , doi:doi. org/10.1007/s11837-001-0172-y . URL https://doi.org/10.1007/s11837-001- 0172-y.
[2] M. J. Then, The future of aircraft paint removal methods (1989). URL https://apps. dtic.mil/dtic/tr/fulltext/u2/a214946.pdf.
[3] S. Pantelakis, T. Kermanidis, G. Haidemenopoulos, Mechanical behavior of 2024 a1 alloy specimen subjected to paint stripping by laser radiation and plasma etching, Theoretical and Applied Fracture Mechanics 25 (1996) 139–146.
[4] G. Bierwagen, Next generation of aircraft coating systems , Journal of Coatings Technology 73 (2001) 45–52. arXiv:https://doi.org/10.1007/BF02730030 , doi: 10.1007/BF02730030 . URL https://doi.org/10.1007/BF02730030.
[5] L. Jinsong, L. Kin-tak, Multifunctional Polymer Nanocomposites, CRC Press, 6000
Broken Sound Parkway NW, Suite 300 Boca Raton (2010).
[6] F. Brygo, C. Dutouquet, F. Guern, R. Oltra, A. Semerok, J. Weulersse, Laser fluence,
repetition rate and pulse duration effects on paint ablation, Applied Surface Science 252 (2006) 2131–2138, arXiv:https://doi.org/10.1016/j. apsusc.2005.02.143, 10.1016/j.apsusc.2005.02.143. doi: 10.1016/j.
apsusc.2005.02.143.
[7] H. Jasim, A. Demir, B. Previtali, Z. Taha, Process development and monitoring in
stripping of a highly transparent polymeric paint with ns-pulsed fiber laser, Opt. Laser Technol. 93 (2017) 60–66, arXiv:https://doi.org/10.1016/j.
optlastec.2017.01.031, 10.1016/j.optlastec.2017.01.031. doi: 10.1016/j.
optlastec.2017.01.031.
[8] J.A. Fox, Effect of water and paint coatings on laser irradiated targets, Appl. Phys.
Lett. 24 (1974) 461–464, arXiv:https://doi.org/110.1063/1.1655012, 10.1063/
1.1655012. doi: 10.1063/1.1655012.
[9] N.C. Anderholm, Laser-generated stress waves, Appl. Phys. Lett. 16 (3) (1970)
113–115, arXiv:https://doi.org/10.1063/1.1653116, 10.1063/1.1653116. doi:
10.1063/1.1653116.
[10] R. Fabbro, J. Fournier, P. Ballard, D. Devaux, J. Virmont, Physical study of laser- produced plasma in confined geometry, Journal of Applied Physics 68 (2). [11] G. I. Kanel, S. Razorenov, V. Fortov, Shock-Wave Phenomena and Properties of
Condensed Matter, Springer, Springer-Verlag New York, Inc. , 175 Fifth Avenue, New York, NY 10010, USA, 2004.
[12] M. Sagnard, L. Berthe, R. Ecault, F. Touchard, M. Boustie, Development of the
symmetrical laser shock test for weak bond inspection, Optics and Laser Technology 111 (2019) 644–652, arXiv:https://doi.org/10.1016/j. optlastec.2018.10.052, 10.1016/j.optlastec.2018.10.052. doi: 10.1016/j.
optlastec.2018.10.052.
[13] L. Barker, R. Hollenbach, Laser interferometer for measuring high velocities of any reflecting surface, J. Appl. Phys. 43 (11) (1972) 4669–4675, https://doi.org/
10.1063/1.1660986.
[14] C. Le Bras, A. Rondepierre, R. Seddik, M. Scius-Bertrand, Y. Rouchausse, L. Videau, B. Fayolle, M. Gervais, L. Morin, S. Valadon, R. Ecault, D. Furfari, L. Berthe, Laser shock peening: Toward the use of pliable solid polymers for confinement, Metals 9,793 (3) (2019) 1–13. arXiv:https://doi.org/10.3390/met9070793 , doi:10.3390/ met9070793 . URL https://doi.org/10.3390/met9070793.
[15] A. Rondepierre, S. Ünaldi, Y. Rouchausse, L. Videau, R. Fabbro, O. Casagrande, C. Simon-Boisson, O. Besaucle, H.and Castelnau, L. Berthe, Beam size dependency of a laser-induced plasma in confined regime: Shortening of the plasma release. influence on pressure and thermal loading, Optics & Laser Technology 135 (2021) 3. doi:10.1016/j.optlastec.2020.106689.
[16] P. Peyre, L. Berthe, V. Vignal, I. Popa, T. Baudin, Analysis of laser shock waves and resulting surface deformations in an al-cu-li aluminum alloy, Journal of Physics D: Applied Physics 45 (33). doi:10.1088/0022-3727/45/33/335304.
[17] J.D. Ferry, Viscoelastic Properties of Polymer, John Wiley & Sons Inc., New York,
1980.
[18] J.W. Dodd, K.H. Tonge, Thermal Methods: Analytical Chemistry by Open Learning,
John Wiley & Sons Ltd, Chichester, UK, 1987.
[19] M.E. Brown, Introduction to Thermal Analysis, Kuwer Academic Publishers,
Dordrecht, the Netherlands, 1998.
[20] E. L. Charsley, Thermal analysis-technique & applications, The Royal Society of Chemistry.
[21] P. J. Haines, Thermal methods of analysis. principles, applications and problems, The Royal Society of Chemistry.
[22] E.A. Turi, Thermal Characterizationof Polymeric Materials, Academic Press, Calif,
San Diego, 1997.
[23] P. K. Gallagher, M. E. Brown, Handbook of thermal analysis and calorimetry, Elsevier Science B. V.
[24] I. Floros, K. Tserpes, T. Lobel, Mode-i, mode-ii and mixed-mode i+ii fracture
behavior of composite bonded joints: Experimental characterization and numerical simulation, Compos. B Eng. 78 (2015) 459–468, arXiv:https://doi.org/10.1016/j. compositesb.2015.04.006, 10.1016/j.compositesb.2015.04.006. doi: 10.1016/j.
compositesb.2015.04.006.
[25] LS-DYNA Keyword user’s manual, LS-DYNA R11, Volume I, II, III, Livermore Software Technology Corporation (LSTC).
[26] R. Ecault, Etude exp´erimentale et num´erique du comportement dynamique de composites a´eronautiques sous choc laser. optimisation du test adh´erence par ondes de choc sur les assemblages composites coll´es, Ph.D. thesis, ´ecole nationale sup´erieure de m´ecanique et d’a´erotechnique (2013). URL https://tel.archives- ouvertes.fr/tel-01242721.
[27] M. Buyuk, S. Kan, J. Loikkanen, Explicit finite-element analysis of 2024–t3/t351
aluminum material under impact loading for airplane engine containment and
fragment shielding, J. Aerosp. Eng. 22 (3) (2009) 287–295.
[28] G. Ivetic, Three-dimensional fem analysis of laser shock peening of aluminium alloy 2024-t351 thin sheets , Surface Engineering 27 (6). arXiv:https://doi.org/ 10.1179/026708409X12490360425846, doi:10.1179/
026708409X12490360425846 . URL https://doi.org/10.1179/ 026708409X12490360425846.
[29] M. Scius-Bertrand, L. Videau, A. Rondepierre, E. Lescoute, Y. Rouchausse, J. Kaufman, D. Rostohar, J. Brajer, L. Berthe, Laser induced plasma characterization in direct and water confined regimes: new advances in experimental studies and numerical modelling, Journal of Physics D: Applied Physics 54 (5). doi:10.1088/ 1361-6463/abc040.
[30] V. Bellenger, E. Fontaine, A. Fleishmann, J. Saporito, J. Verdu, Thermogravimetric
study of amine cross-linked epoxies, Polym. Degrad. Stab. 9 (4) (1984) 195–208, arXiv:https://doi.org/10.1016/0141-3910(84)90049-1, 10.1016/0141-3910(84)
90049-1. doi: 10.1016/0141-3910(84)90049-1.
[31] M.F. Mustafa, W.D. Cook, T.L. Schiller, H.M. Siddiqi, Curing behavior and thermal
properties of tgddm copolymerized with a new pyridine-containing diamine and with ddm or dds, Thermochimica Acta 575 (2014) 21–28, arXiv:https://doi.org/ 10.1016/j.tca.2013.09.018, 10.1016/j.tca.2013.09.018. doi: 10.1016/j.
tca.2013.09.018.
[32] J. Liu, Z. Li, L. Zhang, J. Hou, Z. Lu, Z. Peiqing, B. Wang, N. Jin, Degradation behavior and mechanism of polyurethane coating for aerospace application under atmospheric conditions in south china sea , Progress in Organic Coatings 136. arXiv:https://doi.org/10.1016/j.porgcoat.2019.105310 , doi:10.1016/j. porgcoat.2019.105310. URL https://doi.org/10.1016/j.porgcoat.2019.105310.
[33] G. Cai, H. Wang, D. Jiang, D. Zehua, Degradation of fluorinated polyurethane
coating under uva and salt spray. part i: Corrosion resistance and morphology, Progress in Organic Coatings 123 (2018) 337–349, arXiv:https://doi.org/10.1016/ 10.1016/j.porgcoat.2018.07.025, 10.1016/j.porgcoat.2018.07.025. DOI: 10.1016/
10.1016/j.porgcoat.2018.07.025.
[34] M. Kathalewar, N. Dhopatkar, B. Pacharane, A. Sabnis, P. Raut, V. Bhave, Chemical recycling of pet using neopentyl glycol: Reaction kinetics and preparation of polyurethane coatings , Progress in Organic Coatings 76 (2013) 147–156. doi: 10.1016/j.porgcoat.2012.08.023. URL https://doi.org/10.1016/j.
porgcoat.2012.08.023.
[35] N. Bakar, H. Cui, A.-S. A., S. Li, A review of spectroscopy technology applications in transformer condition monitoring, In Proceedings of the International Conference on Condition Monitoring and Diagnosis (CMD), Xi’an, China.
[36] H. Cui, A. Abu-Siada, S. Li, Islam, Correlation between dissolved gases and oil spectral response , In Proceedings of the 1st International Conference on Electrical Materials and Power Equipment (ICEMPE); Xi’an, China arXiv:https://doi.org/ 10.1109/ICEMPE.2017.798204 , doi:10.1109/ICEMPE.2017.7982046 . URL https://doi.org/10.1109/ICEMPE.2017.798204.
[37] J. CANAVATE, X. COLOM, P. PAGES, F. CARRASCO, Study of the curing process of an epoxy resin by ftir spectroscopy , Polymer-Plastics Technology and Engineering 39 (5) (2007) 937–943. arXiv:https://doi.org/10.1081/PPT-100101414 , doi: 10.1081/PPT-100101414 . URL https://doi.org/10.1081/PPT-100101414.
[38] O.R. Allen, P. Sanderson, Characterization of epoxy glues with ftir, Appl. Spectrosc.
Rev. 24 (3–4) (2006) 175–187, arXiv:https://doi.org/10.1080/ 05704928808060457, 10.1080/05704928808060457. doi: 10.1080/
05704928808060457.
[39] J. Delozanne, N. Desgardin, N. Cuvillier, E. Richaud, Thermal oxidation of
aromatic epoxy-diamine networks, Polymer Degradation and Stability 166 (2019) 174–187, arXiv:https://doi.org/10.1016/j.polymdegradstab.2019.05.030, 10.1016/j.polymdegradstab.2019.05.030. doi: 10.1016/j.
![Fig. 3b) [12]. The 4 mm focal spot was obtained by a focal length of 198 mm lens.](https://thumb-eu.123doks.com/thumbv2/123doknet/7355825.213403/4.892.63.845.75.540/fig-mm-focal-spot-obtained-focal-length-lens.webp)
![Fig. 6. The Pressure Profile as a function of time [29]](https://thumb-eu.123doks.com/thumbv2/123doknet/7355825.213403/6.892.486.805.113.180/fig-pressure-profile-function-time.webp)