MÉTABOLISME DE LA COMMUNAUTÉ MICROBIENNE
ET FLUX DE CARBONE À COURT TERME DANS LE
GOLFE SAN JORGE, PATAGONIE (ARGENTINE)
Mémoire présenté
dans le cadre du programme de maîtrise en océanographie en vue de l’obtention du grade de maître ès sciences
PAR
© VALÉRIE MASSÉ-BEAULNE
Composition du jury :
Karine Lemarchand, présidente du jury, Université du Québec à Rimouski Gustavo A. Ferreyra, directeur de recherche, Université du Québec à Rimouski Gesche Winkler, codirectrice de recherche, Université du Québec à Rimouski Christian Nozais, codirecteur de recherche, Université du Québec à Rimouski Michael Scarratt, examinateur externe, Institut Maurice-Lamontagne (MPO)
UNIVERSITÉ DU QUÉBEC À RIMOUSKI Service de la bibliothèque
Avertissement
La diffusion de ce mémoire ou de cette thèse se fait dans le respect des droits de son auteur, qui a signé le formulaire « Autorisation de reproduire et de diffuser un rapport, un mémoire ou une thèse ». En signant ce formulaire, l’auteur concède à l’Université du Québec à Rimouski une licence non exclusive d’utilisation et de publication de la totalité ou d’une partie importante de son travail de recherche pour des fins pédagogiques et non commerciales. Plus précisément, l’auteur autorise l’Université du Québec à Rimouski à reproduire, diffuser, prêter, distribuer ou vendre des copies de son travail de recherche à des fins non commerciales sur quelque support que ce soit, y compris l’Internet. Cette licence et cette autorisation n’entraînent pas une renonciation de la part de l’auteur à ses droits moraux ni à ses droits de propriété intellectuelle. Sauf entente contraire, l’auteur conserve la liberté de diffuser et de commercialiser ou non ce travail dont il possède un exemplaire.
À ma mère, Geneviève Massé, que j’ai vue sacrifier ses rêves pour que je poursuive les miens.
REMERCIEMENTS
Merci à Québec-Océan, l’Institut des sciences de la mer de Rimouski, Université du Québec à Rimouski et nos collaborateurs Argentins, Agencia Comodoro Conocimiento, Provincia de Chubut, Ministerio de Ciencia, Tecnologia e Innovacion Productiva-Presidencia de la Nacion, Universidad National de la Patagonia San Juan Bosco, le Service aux étudiants de l’UQAR (Bourse de soutien pour séjour à l’étranger) et la Fondation de l’UQAR (Bourse Estelle-Laberge) pour le soutien financier, merci à mes directeurs Gustavo Ferreyra, Gesche Winkler et Christian Nozais, merci pour l’opportunité inoubliable et cette belle aventure, vos conseils, l’incroyable soutien, votre temps, votre patience, le plaisir et les rires, votre écoute et votre disponibilité. Merci aux membres de mon jury d’évaluation : Karine Lemarchand, Michael Scarratt, Gustavo Ferreyra, Gesche Winkler et Christian Nozais. Merci à mon complice indispensable à bord, à l’ISMER et dans la vie, Gilles Desmeules. Merci à Sylvain Blondeau, Mathieu Babin, Pascal Rioux, Claude Belzile, Dominique Lavallée, Pascal Guillot, Simon Senneville, Marjolaine Blais, Michel Gosselin, Mélanie Simard et Bruno Cayouette pour les innombrables heures d’analyses en laboratoire, vos conseils, votre temps, votre prêt de matériel et votre expertise. Merci à mon bras droit Rachel Brien Lavergne, sans qui je n’aurais pu assurer la réussite et l’atteinte des objectifs de ce projet autant professionnels que personnels, mes acolytes David «mon hippocampe» Beauchesne, Julie Corriveau, Julie-Anne Dorval et Noémie «Nono» Friscourt avec qui j’ai partagé depuis le tout début de la maîtrise, les hauts et les bas de la vie, les défis, les échecs et les réussites, la compassion et les encouragements jusqu’au dernier grand droit. Merci à mes complices et partenaires de mission en Argentine Elena Fabro, Juan «Juancho» Gossn, Aline «Lali» Carrier, Philippe «Philou» Klotz et Serge Demers. Merci à mon mentor pour les soucis en informatique, statistique, de logiciels et bien plus encore, Alain Caron. Merci à Cédric Chavanne, Dany Dumont, Irene Schloss, José Louis Esteves, Philippe Archambault, Marcel Fréchette,
Louise Gendron, Lotus Bouchard Pereira, Mélany Belzile, Mariève Bouchard Marmen, Pascal Tremblay et Alexandre «Papy» Palardy pour vos avis et conseils personnels, professionnels et scientifiques. Merci à tous les participants au projet MARES et MARGES, de près ou de loin, tous ceux qui ont veillé à son bon déroulement ainsi qu’à tous les membres de l’équipage du R.V. Coriolis II durant la mission. Merci au NÉMO et sa belle gang, nos personnes ressources indispensables à l’administration de l’ISMER ainsi qu’à tous mes collègues et amis à l’ISMER. Merci à mes collègues de laboratoire, la gang d’Argentine et particulièrement à Houssem Gaaloul et Souad Annane pour l’entraide. En plus de personnes déjà mentionnées, merci à Sabrina Nadeau, Angélique Ollier, Roxanne Sage, Zoé Amorena, Marie Legaré, Laurence Deneault-Tremblay, Laurence Paquette, Laurence Lévesque, Christian Nozais (pour la visite à l’hôpital), Quentin Duboc, Rachel Picard, Claudie Tessier-Bolduc et Catherine Gonthier. Merci à mes parents Pierre Beaulne et Geneviève Massé, ma famille entière et à mes amis chers pour leur support exceptionnel et leur écoute dans cette grande étape de ma vie universitaire. Merci à tous ceux qui m’ont visité et été d’une aide incomparable lors de mon séjour à l’hôpital et au cours de mes six mois de rétablissement. Merci pour le support matériel et moral, les corrections, les encouragements, les relectures et votre aide en cas de pépin, les fabuleux conseils personnels, professionnels ou scientifiques, Jaëlle Brien, Maxime Durocher-Demers, Ella Danis, Renaud Brien, Chantal Dicaire, Jean-Claude Brien, Marie-Pier Bertrand, Natasha Dargis, Anne-Sophie Guérard, Véronique Drolet-Gratton, Anne Tremblay-Gratton, Antoine Querry et Andréane Latour. Vous faites tous partie de ce grand projet d’une quelque façon par votre implication et votre souci de son avancement et de sa réussite. Enfin, merci particulièrement à ma mère, Geneviève Massé, qui a investi de toutes les manières possibles une grande part d’elle et qui m’a accompagnée dans toutes les sphères de ce chapitre de ma vie, qui m’a permis de trouver des solutions à toutes les contraintes au cours de mon cheminement et sans qui l’aboutissement de ce projet n’aurait pas vu le jour. Cette maîtrise, tu l’as complétée à mes côtés, elle te revient et je te la dédicace. Merci d’avoir cru en moi et de m’avoir permis d’accomplir ce que je croyais impossible.
RÉSUMÉ
La pompe biologique comprend divers processus induisant des variations dans le métabolisme de la colonne d’eau et dans les flux de matière organique particulaire (MOP) vers le fond marin. Le Golfe San Jorge (GSJ, Argentine) est l’une des zones les plus productives au monde, mais où aucune étude sur le métabolisme et les flux de carbone n’a été réalisée à ce jour. Le but de cette recherche est d’étudier le rôle de la communauté microbienne sur le métabolisme du GSJ et de caractériser les flux de carbone dans la zone centrale sur une courte échelle temporelle journalière. Les principales hypothèses sont que 1) les ratios de biomasse entre les autotrophes et les hétérotrophes (RA/H) de la communauté étudiée sont influencés par le cycle journalier, 2) que les (RA/H) expliquent le métabolisme de la colonne d’eau, 3) que la matière organique qui sédimente est de source planctonique autochtone et 4) que les flux de carbone varient avec la profondeur. L’échantillonnage a été réalisé à bord du navire de recherche Coriolis II au cours de la période estivale du 6 au 13 février 2014 à une station fixe (dont 36 heures pour l’étude du métabolisme). Les principaux résultats démontrent que les conditions environnementales et les RA/H varient très peu sur la courte période d’étude, mais que les taux métaboliques démontrent une variabilité. De plus, le cycle de la lumière et les RA/H n’expliquent pas les taux métaboliques. Ceci suggère que des facteurs non considérés dans cette étude (microhétérotrophes et bactéries attachées aux particules) pourraient jouer un rôle important sur la respiration dans la couche profonde aphotique. Pour la deuxième partie de l’étude, les flux de carbone sont plus importants à 40 m et peuvent être expliqués principalement par une grande contribution de fèces. Ces résultats suggèrent une forte influence des migrations et du broutage du zooplancton, particulièrement de Munida sp. (macrozooplanton). De plus, la matière organique particulaire (MOP) récoltée dans les pièges à sédiments est de source phytoplanctonique. Toutefois, la présence de microzooplancton et de bactéries attachées aux particules pourrait expliquer la signature isotopique de la MOP ainsi que la forte respiration. Enfin, le métabolisme de la colonne d’eau du GSJ au cours de la période estivale, sur une échelle journalière, serait principalement influencé par la respiration sous la couche euphotique, mené par une forte dégradation de la matière organique qui y sédimente.
Mots clés : taux métaboliques, station fixe, court terme, communauté microbienne, ratios de biomasse, flux de carbone, pelotes fécales
ABSTRACT
The biological pump includes several processes that induce variations in the water column metabolism and in fluxes of particulate organic matter (POM) towards the seabed. The San Jorge Gulf (SJG, Argentina) is one of the world’s most productive zones, but where no studies on the metabolism and carbon fluxes have been conducted to date. The purpose of this research project was to study the role of the microbial community on metabolism and to characterize carbon fluxes in the central zone on a short daily time scale in the SJG. The main hypotheses were that 1) biomass ratios between autotrophs and heteorotrophs (RA/H) of the studied community is influenced by the daily cycle 2) that RA/H ratios explain water-column metabolism, 3) that sinking organic matter is from autochthonous planktonic sources and 4) that carbon fluxes vary with depth. The sampling was conducted on board the research vessel Coriolis II during the summer period from February 6 to 13th 2014 at a fixed station (including 36 hours for the metabolism study). The main results showed that environmental conditions and RA/H did not vary much over the short time period, but that metabolic rates showed variability. Furthermore, the light cycle and RA/H did not explain the metabolic rates. This suggested that external factors not considered in this study (microheterotrophs and particle-attached bacteria) could play an important role on respiration in the deeper aphotic layer. For the second part of the study, carbon fluxes were more important at 40 m, mainly explained by a great contribution of feces. This result suggested a strong influence of zooplankton migrations and grazing, from Munida sp. in particular (Macrozooplankton). Furthermore, particulate organic matter (POM) collected in sediment traps originated from phytoplanktonic sources. However, the presence of microzooplankton and particle-attached bacteria might explain the isotopic signatures of POM and the strong respiration. Finally, the daily metabolism in the water column of the SJG during summer would mainly be influenced by the respiration in the aphotic zone, leaded by a strong degradation of the sinking organic matter.
Keywords: metabolic rates, fixed station, short term, microbial community, biomass ratios, carbon fluxes, feces
TABLE DES MATIÈRES
REMERCIEMENTS ... ix
RÉSUMÉ ... xi
ABSTRACT ... xiii
TABLE DES MATIÈRES ... xv
LISTE DES TABLEAUX ... xviii
LISTE DES FIGURES ... xx
LISTE DES ABRÉVIATIONS, DES SIGLES ET DES ACRONYMES ... xxii
INTRODUCTION GÉNÉRALE ... 1
CHAPITRE 1 : ESTIMATION À COURT TERME DES TAUX MÉTABOLIQUES DE LA COMMUNAUTÉ MICROBIENNE DANS LA COLONNE D’EAU DU GOLFE SAN JORGE, PATAGONIE (ARGENTINE) ... 11
1.1 RÉSUMÉ ... 11
1.2 ABSTRACT ... 12
1.3 SHORT TERM ESTIMATION OF THE METABOLIC RATES IN THE WATER COLUMN OF THE SAN JORGE GULF, PATAGONIA (ARGENTINA): THE ROLE OF THE MICROBIAL COMMUNITY ... 13
1.4 INTRODUCTION ... 13
1.5 MATERIAL AND METHODS ... 16
1.5.1 Study area ... 16
1.5.2 Sampling design ... 17
1.5.3 Physical and chemical properties of the water column ... 18
1.5.5 Metabolism measurements ... 22
1.5.6 Statistical analyses ... 25
1.6 RESULTS ... 26
1.6.1 Properties of the water column ... 26
1.6.2 Microbial community ... 30
1.6.3 Metabolism of the water column ... 34
1.7 DISCUSSION ... 38
1.7.1 Microbial community ... 38
1.7.2 RA/H ratios of the microbial community ... 39
1.7.3 Metabolic rates ... 40
1.8 CONCLUSIONS ... 46
CHAPITRE 2 : FLUX À COURT TERME DU CARBONE ORGANIQUE PARTICULAIRE DANS LA ZONE CENTRALE DU GOLFE SAN JORGE, PATAGONIE (ARGENTINE) ... 47
2.1 RÉSUMÉ ... 47
2.2 ABSTRACT ... 48
2.3 SHORT TERM PARTICULATE ORGANIC CARBON FLUXES IN THE CENTRAL ZONE OF THE SAN JORGE GULF, PATAGONIA (ARGENTINA) ... 49
2.4 INTRODUCTION ... 49
2.5 MATERIAL AND METHODS ... 51
2.5.1 Study area ... 51
2.5.2 Vertical particles fluxes ... 52
2.5.3 Carbon and nitrogen quantification, stable isotopes ... 52
2.5.4 Physical properties of the water column ... 54
2.5.5 Statistical analyses ... 54
2.6 RESULTS ... 55
2.6.1 Stable isotopes signature and C/N ratios ... 55
2.6.2 Fluxes of poc and large feces ... 58
2.7 DISCUSSION ... 63
2.7.1 Source and quality of POMf and large feces ... 63
2.7.2 Fluxes of POC and large feces ... 67
2.7.3 Relative importance of large feces in total POC ... 71
2.8 CONCLUSIONS ... 73
CONCLUSION GÉNÉRALE ... 75
RÉFÉRENCES BIBLIOGRAPHIQUES ... 80
LISTE DES TABLEAUX
Table 1. Comparisons of annual NCP with other coastal marine systems ... 41 Table 2. Fluxes of POC in other coastal ecosystems and shallow depth sampling waters ... 69 Table 3. Relative importance of feces in other regions and ecosystems ... 72
LISTE DES FIGURES
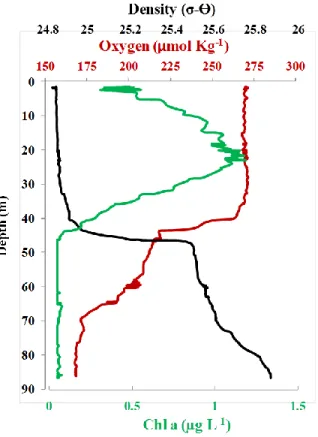
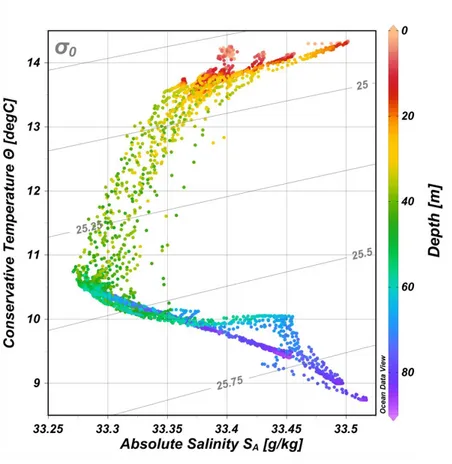
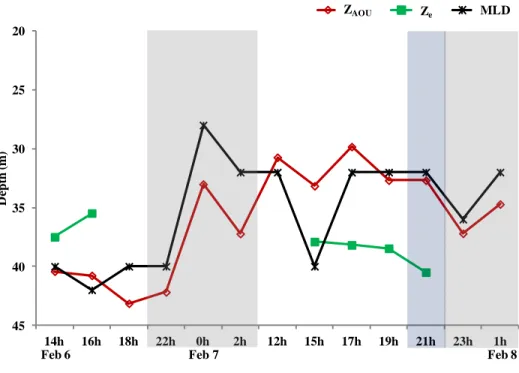
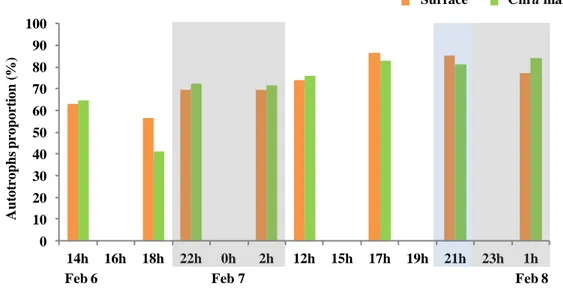
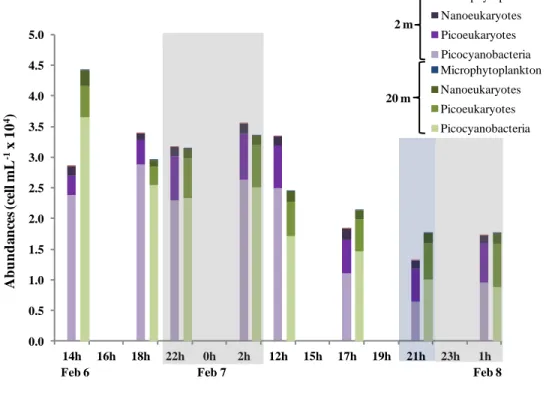
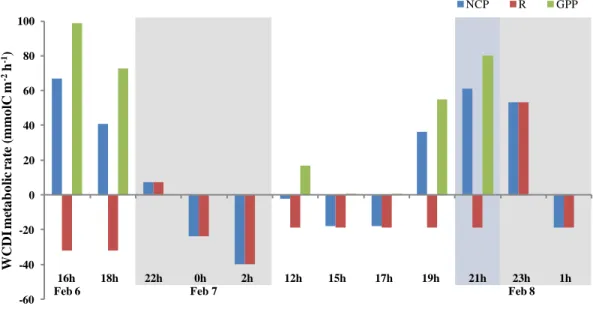
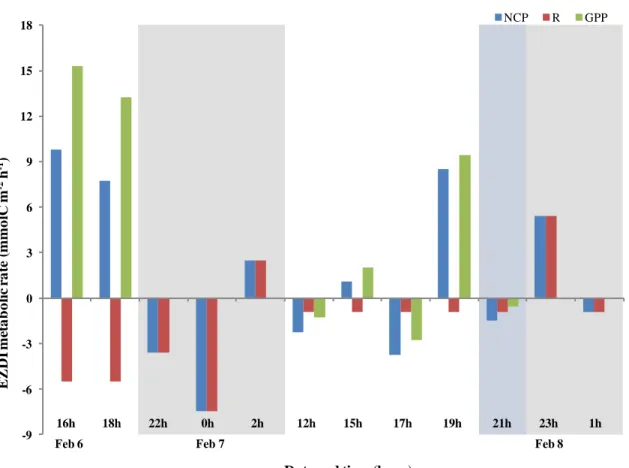
Figure 1. Patron général de circulation océanique de la région du plateau continental Patagonien ... 8 Figure 2. a) Location of the San Jorge Gulf in Patagonia, Argentina b) Approximate location of the fixed station in the SJG ... 17 Figure 3. Profiles of Chl a, oxygen and density at the fixed station ... 27 Figure 4. Water masses at the fixed station determined from T-S diagram ... 28 Figure 5. Depths of ZAOU, Ze, and MLD over time ... 30 Figure 6. The RA/H ratios over the short period at surface and Chl a max ... 31 Figure 7. Autotroph cells abundancess ... 32 Figure 8. Free-living heterotrophic bacteria abundances ... 34 Figure 9. Water column depth-integrated (WCDI) metabolic rates ... 35 Figure 10. Euphotic zone depth-integrated (EZDI) metabolic rates ... 36 Figure 11. Cylindrical feces > 250 µm collected in traps ... 56 Figure 12. Isotopic signatures and C/N ratios for the POMf in the two sediment traps and large feces ... 57 Figure 13. Daytime, nighttime, and daily POCf fluxes ... 59 Figure 14. Daytime, nighttime, and daily fluxes of large feces ... 60 Figure 15. Daily total POC fluxes (POCf + large feces) ... 61 Figure 16. Daily proportions of feces in total POC fluxes ... 62
LISTE DES ABRÉVIATIONS, DES SIGLES ET DES ACRONYMES A Autotroph(s) / Autotrophe(s)
AOU Apparent oxygen utilization BWL Bottom water layer
Chl a max Chlorophyll a maximum
COD Carbone organique dissous (DOC) COP Carbone organique particulaire (POC)
DO Dissolved oxygen
DOC Dissolved organic carbon (COD) EZDI Euphotic zone depth-integrated GPP Gross primary production (PPB) GSJ Golfe San Jorge (SJG)
H Heterotroph(s) / Hétérotrophe(s) MLD Mixed layer depth
MOP Matière organique particulaire (POM) N2 Buoyancy force (Brünt-Väisälä) NCP Net community production PIC Particulate inorganic carbon
PIN Particulate inorganic nitrogen
PNC Production nette de la communauté (NCP)
POC Particulate organic carbon, considered as a part of POM. (COP) POCf Filtered fraction (< 250 µm) of particulate organic carbon. POM Particulate organic matter. Contains POC and PON.
POMf Filtered fraction (< 250 µm) of paticulate organic matter. Contains POCf and filtered particulate organic nitrogen (< 250 µm).
PON Particulate organic nitrogen, considered as a part of POM. PPB Production primaire brute (GPP)
R Respiration
RA/H Ratio de biomasse / Biomass ratio. RA/H = A / (A+H)
Ri Richardson number
SJG San Jorge Gulf (GSJ)
SW Seawater
SWL Surface water layer
UPWL Under pycnocline water layer WCDI Water column depth-integrated Z Depth strata or depth (in meters).
Zaou Depth at which the community respiration induces an apparent change in ambient concentrations of oxygen (AOU) in the water column.
INTRODUCTION GÉNÉRALE
LE MÉTABOLISME
Le phytoplancton, qui représente à lui seul 50% de la production primaire de la planète, est situé à la base du réseau trophique marin et joue un rôle clé dans le cycle du carbone de l’océan (del Giorgio & Duarte, 2002; Falkowski & Raven, 2007). Le phytoplancton est constitué de cellules autotrophes qui, grâce à la photosynthèse, assimilent le carbone inorganique dissout dans l’eau de mer en carbone organique et produisent de l’oxygène. L’intensité de la production primaire dépend des conditions environnementales telles que la disponibilité des nutriments et de la lumière (Venkiteswaran et al., 2007). Le carbone organique est alors produit dans la couche euphotique, où les conditions de lumière et de nutriments sont propices. Le carbone organique produit représente une source d’énergie pour les organismes hétérotrophes tels que les bactéries et les organismes des niveaux trophiques supérieurs (Schloss et al., 2007). La respiration est le processus biologique permettant aux hétérotrophes (incluant les organismes mixotrophes; (Sherr & Sherr, 2002) d’acquérir leur énergie pour soutenir leur métabolisme (Burris, 1980; Reynolds, 2006). Contrairement à la photosynthèse, la respiration consomme de l’O2 et produit du CO2 (Legendre & Rassoulzadegan, 1996; Rivkin & Legrendre, 2001; del Giorgio & Duarte, 2002)
La majeure partie du cycle du carbone des océans consiste donc en la balance entre ce qui est produit par les autotrophes (A) et ce qui est respiré par les hétérotrophes (H) et les autotrophes eux-mêmes (Rivkin & Legrendre, 2001; Mouriño-Carballido & Anderson, 2009; Bianchi et al., 2013). Outre la photosynthèse, les échanges gazeux entre l’atmosphère et la surface de l’eau représentent une source d’oxygène dissout pour la respiration (Emerson et al., 2008). La différence entre 1) l’oxygène disponible par photosynthèse
(Production primaire brute; PPB) combiné aux échanges gazeux et 2) la respiration (R) résulte en 3) une balance métabolique : une concentration nette d’oxygène dans la colonne d’eau. Grâce à la mesure de ces concentrations nettes d’oxygène dissout, il est possible d’estimer le métabolisme de la colonne d’eau et de convertir des taux métaboliques calculés en termes de production nette de carbone (production nette de la communauté; PNC; Venkiteswaran et al., 2007).
La première estimation du métabolisme en eaux libres, basée sur les concentrations en oxygène dans la colonne d’eau, fut réalisée par Odum en 1956. Depuis, plusieurs études sur la balance métabolique ont été réalisées dans les milieux marins et lacustres à différentes échelles temporelles et spatiales (Smith & Kemp, 2001; Arístegui et al., 2004; Serret et al., 2009; Coloso et al., 2010; Sadro et al., 2011; Staehr et al., 2012; Cloern et al. 2014). Plusieurs techniques, à ce jour, permettent d’estimer le métabolisme dont la méthode par intégration des concentrations volumétriques d’oxygène dans la colonne d’eau (Gazeau et al., 2005a; Cole et al., 2010; Sadro et al., 2011; Staehr et al., 2012; Christensen, 2013). Les PNC, PPB et R sont alors exprimés en taux métaboliques intégrés par unité de temps (mmolC m-2 h-1). Il a été démontré que la méthode par intégration est équivalente aux autres méthodes en eaux libres et qu’elle est plus fiable, puisqu’elle permet de prendre en considération les échanges d’oxygène pouvant avoir lieu entre deux couches d’eau (Sadro et al., 2011). Étant en milieu marin, cette technique est utilisée dans cette étude, étant considérée comme la plus convenable et présentant le plus d’avantages techniques.
LA COMMUNAUTÉ MICROBIENNE
Étant responsable de la photosynthèse, de la production de carbone organique et de la consommation de ce dernier via la respiration, la communauté microbienne a une grande influence sur le métabolisme en milieu aquatique (Azam et al., 1983; Smith & Kemp, 2001; Rivkin & Legrendre, 2001) La PNC représente la différence entre la PPB et la R de la totalité des organismes dans la communauté microbienne (Iriarte et al., 1991; Gazeau et al., 2005a; Mouriño-Carballido & Anderson, 2009). Toutefois, la respiration (R) par la plus petite classe de taille du plancton, particulièrement les bactéries, représente le puits
d’oxygène principal suite à la consommation directe du carbone produit par photosynthèse (Azam et al., 1983; Linley et al., 1983; Iriarte et al., 1991; Smith & Kemp, 2001; Rivkin & Legrendre, 2001). Cette étude se concentre donc sur le rôle majeur des bactéries libres (hétérotrophes) sur le métabolisme, et non sur toute la communauté microbienne hétérotrophe.
Afin de mieux interpréter le rôle de la communauté microbienne sur le métabolisme, il est possible de déterminer un ratio de biomasse entre les autotrophes et les hétérotrophes (bactéries libres). Ce ratio représente, à titre indicatif, l’état trophique de la communauté. Le pourcentage de biomasse de cellules autotrophes par rapport à la biomasse totale (RA/H), peut varier (augmenter ou diminuer au profit des autotrophes ou des hétérotrophes) selon les paramètres environnementaux et l’hydrodynamisme de la colonne d’eau (Kiørboe, 1993; Teira et al., 2001; Arístegui et al., 2004; Schloss et al., 2007). Ces contraintes environnementales peuvent varier à long terme (annuel, saisonnier) et à court terme (mensuel, hebdomadaire, journalier; Buesseler et al., 2007). Suivant les variations environnementales, les variations du RA/H induisent des variations dans la PNC (Kiørboe, 1993; Lam et al., 2011) selon l’intensité de la productivité et de la respiration de la communauté microbienne. Cette étude vise à déterminer, à l’échelle journalière, si le RA/H est bien à la source des variations du métabolisme de la colonne d’eau du GSJ.
Enfin, la balance métabolique de la communauté microbienne détermine si la consommation du carbone organique est plus importante que ce qui est produit (R > PPB), ou à l’opposé, si la production de carbone organique est plus importante que sa consommation (PPB > R). Dans ce cas, une production de carbone en excès permet de contribuer aux exports verticaux de carbone dans la colonne d’eau (Mouriño-Carballido & Anderson, 2009; Schloss et al., 2007). Il s’avère alors essentiel d’étudier le rôle de la communauté microbienne sur la balance métabolique, ayant une grande influence sur les flux de carbone potentiels dans la colonne d’eau. Cette étude vise donc, comme second objectif central, d’étudier les flux de carbone dans le GSJ.
LES FLUX DE CARBONE
L’ensemble des processus marins, incluant les flux de CO2 entre l’atmosphère et l’océan, la transformation du carbone inorganique en carbone organique particulaire (COP) et l’exportation de ce carbone vers les fonds marins où il est séquestré, s’englobent sous un concept clé nommé la pompe biologique (Volk & Hoffert, 1985; Ducklow et al., 2001; Eppley & Peterson, 1979; Lam et al., 2011). La pompe biologique est donc un système biogéochimique et physique divisé en quatre compartiments interalliés : la production, l’export, les flux de matière vers le fond de la colonne d’eau et finalement la séquestration (Lutz et al., 2007). Selon ce concept, le carbone organique produit par le phytoplancton via la photosynthèse dans la zone euphotique (Volk & Hoffert, 1985; Ducklow et al., 2001) peut être en partie assimilé par le zooplancton et ainsi être exporté sous forme de pelotes fécales (Legendre, 1990). D’une autre part, si le phytoplancton n’est pas consommé, il peut être transporté directement par sédimentation sous la couche euphotique sous forme de cellules mortes ou intactes (Legendre & Le Fèvre, 1991). La pompe biologique est donc le processus majeur pouvant contribuer à la production et à l’exportation de matière organique Eppley & Peterson 1979; Lam et al., 2011) vers le fond marin.
Dans la colonne d’eau, les flux de matière organique incluent une fraction particulaire du carbone et de l’azote (matière organique particulaire; MOP) et une fraction dissoute (matière organique dissoute; MOD; Rivkin & Legrendre, 2001). Les études sur les flux de matière organique visent traditionnellement les flux de carbone organique particulaire (COP), malgré qu’elles sous-estiment les flux totaux de carbone (del Giorgio & Duarte, 2002). En effet, la fraction dissoute des flux de matière organique (MOD) représente de 10 à 30% du carbone produit par la production primaire. Cette fraction est importante, mais elle est principalement minéralisée et retransformée en carbone organique particulaire (COP) par l’activité bactérienne (del Giorgio & Duarte, 2002; Fenchel & Barker Jørgensen, 1977). La matière organique qui sédimente et qui peut être éventuellement séquestrée est donc majoritairement sous forme de carbone organique particulaire (COP). Cette étude se concentre donc sur les flux de COP, soit le troisième compartiment du système de la pompe
biologique, en considérant toutefois qu’ils ne représentent pas la totalité des flux de carbone. Les flux de COP dépendent des processus biologiques et physiques tels que la production primaire mentionnée précédemment, la consommation, le mélange par turbulence, le transport par les courants et la resuspension, la décomposition bactérienne, et la migration, le broutage et la production de pelotes fécales par le zooplancton (Buesseler et al., 2007; De La Rocha & Passow, 2007; Kellogg et al., 2011). Ces processus divers qui ont lieu à différentes échelles temporelles, annuelles, saisonnières et à très court termes telle que journalière (Buesseler et al., 2007).
Les flux de carbone ont été étudiés depuis les dernières décennies à différentes échelles temporelles et spatiales dans diverses régions des océans, que ce soit en milieu océanique ou côtier, dans les eaux de surface et dans les grandes profondeurs (Fowler, Small, & La Rosa, 1991; Jickells et al., 1996; Trull et al., 2001; Arístegui et al., 2004; Caron, Michel, & Gosselin, 2004; Forest et al., 2010; Hung et al., 2013; Miquel et al., 2015). Eppley & Peterson (1979) furent les premiers à estimer qu’il y avait un lien entre la production nouvelle dans la couche euphotique et la quantité de matière organique pouvant être exportée depuis la production totale, et ce, sans affecter la production globale d’un écosystème. Les flux de carbone représentent une composante importante dans la compréhension du cycle global du carbone (Siegel et al., 2013). Les études portant sur les flux de carbone utilisant des pièges à sédiments peuvent mener à l’estimation de l’intensité de la pompe biologique et à une meilleure compréhension de l’importance des particules sédimentaires dans la dynamique d’un écosystème (Buesseler et al., 2007). Le contenu des pièges représente un indice de l’importance des migrations verticales du zooplancton et de l’importance de la contribution relative des pelotes fécales aux flux de carbone (Miquel et al., 2015).
Il est reconnu que les pelotes fécales produites par le zooplancton jouent un rôle clé dans les flux verticaux de MOP (Urban-Rich et al., 1999; Turner, 2002). Plusieurs études ont démontré que la contribution relative des pelotes fécales dans les pièges à sédiments varie énormément dépendamment des régions étudiées et peuvent contribuer de <1 à 100%
du POC (Urban-Rich et al., 1999). De plus, selon leur taille, les pelotes peuvent atteindre des vitesses de sédimentation allant jusqu’à 1000 m/jour dans les milieux océaniques (Bruland & Silver, 1981) et représenter une source d’énergie de bonne qualité pour les communautés benthiques (Schnack-Schiel & Isla, 2005).
Outre l’intensité des flux et la forme dans laquelle la MOP sédimente, il est important de considérer son origine afin de mieux comprendre le fonctionnement écologique de l’écosystème. L’utilisation des isotopes stables comme indicateurs écologiques naturels permet de déterminer les interactions dans les réseaux trophiques, de déterminer la composition en carbone et en azote de la matière organique, son origine, son temps de résidence et son état de dégradation (Fry, 2006a; Michener & Lajtha, 2007; Philp, 2007). L’utilisation des isotopes stables permet de déterminer si la matière qui sédimente dans la colonne d’eau est de source planctonique (autochtone), terrestre ou externe au système étudié (allochtone) et permet ainsi de mieux comprendre le cycle des éléments dans un écosystème (Peterson & Fry, 1987; Michener & Lajtha, 2007). Les éléments, tels que le carbone (12C) et l’azote (14N), ont tous plus d’un isotope dans la nature (par exemple : le carbone 12C possède un isotope stable, 13C). La composition de la matière organique en isotopes stables de ces éléments peut être mesurée avec précision grâce à la spectrométrie de masse (Peterson & Fry, 1987). Le principe de l’analyse des isotopes stables consiste à déterminer la fraction des isotopes stables (éléments plus lourds, ex : 13C) sur les isotopes plus légers (12C). Cette fraction, notée delta (δ), est définie en pour mille (‰) et se nomme une signature isotopique (voir Éq.11, chapitre II; Peterson & Fry, 1987; Fry, 2006a). La signature isotopique est unique pour chaque niveau trophique, selon l’origine (terrestre, lacustre ou marine) et l’état de dégradation de la matière organique (Fry, 2006b; Michener & Lajtha, 2007). Dans cette étude, l’analyse des isotopes stables est utilisée afin de déterminer l’origine et l’état de la matière organique qui sédimente dans la colonne d’eau du GSJ.
PROBLÉMATIQUE ET OBJECTIFS
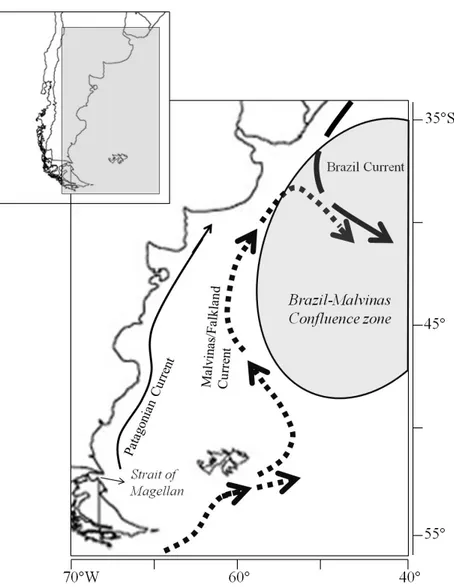
En somme, les flux de MOP sont le résultat du bilan métabolique et trophique dans la colonne d’eau. Plusieurs études sur le métabolisme et les flux de carbone ont été réalisées dans plusieurs régions océaniques (Tableaux 1 et 2). Les zones côtières sont parmi les plus productives et représentent près de 20% de la production primaire des océans (Wollast, 1998; Cossarini, Querin, & Solidoro, 2015). Selon Garcia et al., (2008), une des zones les plus productives au monde en termes de production primaire se situe en Patagonie de l’Atlantique sud, sur la marge continentale et les zones côtières du plateau Argentin (Ferreira et al., 2009). Le GSJ est un bassin océanique semi-ouvert peu profond (~ 90 m), de 33 000 km2, situé dans la région centrale de la Patagonie. Sous l’influence de la dynamique de la circulation océanique du plateau continental Patagonien (Figure 1), menée par les courants Patagonien côtier, du Brésil et des Malouines/Falkland (Garcia et al., 2008; Ferreira et al., 2009; Olguín Salinas et al., 2015; Ulibarrena & Conzonno, 2015), ce golfe présente des caractéristiques environnementales variant au sein des saisons et à l’échelle journalière. Il subit l’effet de fortes marées (amplitudes ~ 6 m, vives-eaux et mortes-eaux de 6 à < 1 m), de fronts tidaux et est situé sous les quarantièmes degrés de latitudes sud, où des épisodes de forts vents d’ouest sont enregistrés à l’année sur cette région semi-désertique (Acha et al., 2004; Ulibarrena & Conzonno, 2015).
Figure 1. Patron général de circulation océanique de la région du plateau continental Patagonien. La carte est modifiée de Olguín Salinas et al., (2015) et Ulibarrena & Conzonno (2015). La mince flèche uniforme représente le courant Patagonien en provenance du détroit de Magellan, la grande flèche pointillée représente le courant des Malouines/Falkland, la grande flèche en tirets représente le courant du Brésil, la zone grise représente la zone de confluence des courants Malouines/Falkland-Brésil. Les coordonnées géographiques sont présentées à titre indicatif.
Quelques études ont eu lieu dans le golfe et dans la région du Sud-ouest de l’Atlantique au cours de la dernière décennie, notamment sur : les conditions physico-chimiques affectant les floraisons phytoplanctoniques (Schloss et al., 2007; Garcia et al., 2008; Ferreira et al., 2009; Olguín Salinas et al., 2015; Ulibarrena & Conzonno, 2015), la
dynamique des courants de la région de la Patagonie, le bassin et la géologie du GSJ (Willson & Rees, 2000; Sylwan, 2001; Acha et al., 2004; Tonini, Palma, & Rivas, 2006; Gianni, Navarrete, & Folguera, 2015), la caractérisation de l’environnement benthique (Fernández et al., 2005) et enfin sur les pêches et certaines espèces clés de l’écosystème (Roux, Fernandez, & Bremec, 1995; Romero et al., 2004; Vinuesa, Varisco, & Vinuesa, 2007; Varisco, Vinuesa, & Góngora, 2015; Glembocki et al., 2015). Selon une étude antérieure menée par Fernández et al., (2005), la matière organique se déposant au fond du golfe serait principalement de source planctonique. Malgré ces études récentes, les connaissances sur les aspects et processus biologiques de la colonne d’eau du golfe se font rares. À ce jour, aucune étude n’a été réalisée dans le golfe sur la communauté microbienne et sa balance métabolique, ni sur les flux de carbone organique qui en résultent. De plus, contrairement à plusieurs recherches menées en milieu marin, les études des changements du métabolisme sont plutôt rares à courte échelle temporelle, soit horaire et journalière, et particulièrement dans le GSJ. L’exploitation des hydrocarbures et les pêches commerciales et artisanales représentent des intérêts économiques importants pour le GSJ (Roux et al., 1995; Sylwan 2001; Fernández et al., 2005). Les flux de carbone tendent à être plus élevés dans les zones de grande productivité (Eppley & Peterson, 1979) et il est possible que cette grande productivité soit à la source de la richesse et de l’importance économique des pêches du GSJ. Puisque les flux de carbone résultent de la balance entre ce qui est produit et assimilé dans la colonne d’eau, il est d’un grand intérêt d’étudier le métabolisme et les flux de matière qui en résultent, étant possiblement à la source de notre compréhension du fonctionnement de l’écosystème très productif du GSJ.
Dans ce contexte, l’objectif de cette étude est d’estimer le rôle de la communauté planctonique microbienne sur les taux métaboliques (énergie produite, consommée et nette dans le temps) du GSJ et les flux de carbone qui en résultent en relation avec certains facteurs environnementaux. Les objectifs spécifiques du chapitre I visent à déterminer et estimer à l’échelle journalière dans la zone centrale du Golfe San Jorge : 1) le ratio de biomasse autotrophes/hétérotrophes (RA/H) de la communauté microbienne et leurs abondances respectives 2) le métabolisme de la colonne d’eau 3) si le RA/H dépend du cycle
journalier de la lumière et 4) s’il explique à lui seul le métabolisme de la colonne d’eau. Les objectifs spécifiques du chapitre II visent à estimer, caractériser et quantifier à court terme : 1) les flux de carbone dans la colonne d’eau 2) la qualité et la source de matière organique dans le golfe et 3) l’importance relative des pelotes fécales dans les flux de carbone.
CADRE DU PROJET
Le sujet de recherche s’insère dans le cadre d’un projet international en collaboration avec l’Argentine : PROMESSE (Programme multidisciplinaire de recherche en océanographie pour l’étude de l’écosystème, de la géologie Marine du Golfe San Jorge et de la côte de la province de Chubut; Patagonie argentine) ayant pour objectif principal d’étudier la structure et le fonctionnement de l’écosystème du Golfe San Jorge (GSJ) aux niveaux biologique, chimique, physique et géologique. Le projet s’insère dans le projet cadre MARine Ecosystem health of the San Jorge Gulf (MARES). L’objectif général de ce projet de grande envergure est l’étude de la santé et la capacité de résilience de l’écosystème du golfe face aux perturbations d’origine anthropique.
CHAPITRE 1
ESTIMATION À COURT TERME DES TAUX MÉTABOLIQUES DE LA COMMUNAUTÉ MICROBIENNE DANS LA COLONNE D’EAU DU GOLFE
SAN JORGE, PATAGONIE (ARGENTINE)
1.1 RÉSUMÉ
La pompe biologique comprend divers processus induisant des variations dans le métabolisme d’un écosystème. Le Golfe San Jorge (GSJ, Argentine) est l’une des zones les plus productives au monde, mais où aucune étude sur le métabolisme n’a été réalisée à ce jour. L’objectif de ce premier chapitre est d’étudier le rôle de la communauté microbienne sur le métabolisme du Golfe San Jorge (GSJ ; Argentine) dans la zone centrale sur une échelle journalière. L’étude porte sur la variabilité des ratios de biomasse (RA/H), les densités des autotrophes et hétérotrophes de la communauté microbienne et le métabolisme intégré sur la profondeur de la colonne d’eau. Les principales hypothèses étaient que les RA/H de la communauté étudiée sont influencés par le cycle journalier et qu’ils expliquent le métabolisme de la colonne d’eau. L’échantillonnage s’est fait à bord du navire de recherche Coriolis II du 6 au 8 février 2014 à une station fixe située dans la zone centrale du GSJ. Plusieurs variables ont été étudiées aux fins d’analyse, principalement : la fluorescence, les conditions environnementales, les abondances et les biomasses de la communauté microbienne et les concentrations volumétriques de l’oxygène dissous intégrées sur la profondeur. Les principaux résultats démontrent que la plus petite gamme de taille de cellules domine la communauté. Les conditions environnementales et les ratios de biomasse ne varient pas significativement sur la courte période journalière étudiée (RA/H moyen de 72%), mais que les taux métaboliques démontrent une grande variabilité (NCP = 67 à -40 mmolC m-2 h-1). Le cycle journalier de la lumière et le RA/H n’expliquent pas la variabilité des taux métaboliques. La respiration, qui est indépendante de la lumière, joue un rôle majeur sur le métabolisme de la colonne d’eau dans cette étude. Ceci suggère que les microhétérotrophes et les bactéries attachées aux particules pourraient avoir joué un rôle important sur la respiration dans la couche aphotique. En conclusion, il est de grande importance de considérer les microhétérotrophes (ex : protistes) et les bactéries attachées aux particules pour expliquer le métabolisme dans le cas du GSJ en été.
1.2 ABSTRACT
The biological pump includes several processes that induce variations in ecosystem metabolism. The San Jorge Gulf (SJG, Argentina) is one of the world’s most productive zones, but where no studies on the metabolic balance have been conducted to date. The purpose of this first chapter is to study the role of the microbial community on metabolism in the San Jorge Gulf (SJG; Argentina) in the central zone on a short daily time scale. The study focuses on abundances and biomass ratios of autotrophs and heterotrophs (RA/H) in the microbial community and water-column depth-integrated metabolism. The main hypotheses are that the RA/H of the studied community are influenced by the daily light cycle and that they explain the metabolism of the water-column. The sampling was executed on board the research vessel Coriolis II from February 6 to 8th 2014 in the central zone of the SJG. Several variables were used for analysis, mainly: fluorescence, environmental conditions, abundances and biomass ratios of the microbial community, and depth-integrated volumetric concentrations of dissolved oxygen. The main results show that the smallest cell size range dominates the community. Environmental conditions and RA/H do not vary significantly over the short period (average RA/H of 72%), but that metabolic rates show a great variability (NCP = 67 à -40 mmolC m-2 h-1). The daily light cycle and the RA/H do not explain the variability of metabolic rates. Respiration, which is independent of light, plays an important role on the metabolism of the water-column in this study. This suggests that microheterotrophs and particle-attached bacteria could have played an important role on respiration in the aphotic zone. In conclusion, it is of great importance to consider microheterotrophs (ex: protists) and particle-attached bacteria to explain the metabolism in the case of the SJG during summer.
1.3 SHORT TERM ESTIMATION OF THE METABOLIC RATES IN THE WATER
COLUMN OF THE SAN JORGE GULF, PATAGONIA (ARGENTINA): THE ROLE OF THE
MICROBIAL COMMUNITY
1.4 INTRODUCTION
Phytoplankton is responsible for 50% of Earth’s total primary production, is at the base of the marine food web and plays a key role in the carbon cycle in the ocean (Falkowski & Raven, 2007; Schloss et al., 2007). Phytoplankton consists of autotrophic cells which, through the process of photosynthesis, assimilates inorganic carbon from dissolved atmospheric CO2 into organic carbon and produces oxygen (Burris, 1980; Reynolds, 2006). The intensity of this primary production depends on environmental conditions, such as nutrient availability and light (Venkiteswaran et al., 2007), as well as stratification and turbulence (Mann & Lazier, 2006c). Hence, the organic carbon is produced within the mixed layer, as long as it is equal or higher than depth of the euphotic zone (Ze; Serret et al., 2009). The organic carbon represents a source of energy for heterotrophic organisms (Schloss et al., 2007). While consuming oxygen, respiration is the biological process allowing those organisms to acquire energy by the oxidation of organic carbon (Burris, 1980), which process produces CO2 that can return to the atmosphere (Legendre & Rassoulzadegan, 1996; Rivkin & Legrendre, 2001; del Giorgio & Duarte, 2002).
Apart from gas exchange with the atmosphere, the major part of the marine carbon cycle consists in the balance between what is produced through autotrophs (A) and what is respired through heterotrophs (H) and autotrophs as well (Mouriño-Carballido & Anderson, 2009). The difference between gross primary production (GPP) and respiration by the organisms in the microbial community (autotrophic and heterotrophic; R) represents the net microbial community production (NCP; Iriarte et al., 1991; Gazeau et al., 2005a; Mouriño-Carballido & Anderson, 2009). Heterotrophic bacterial respiration has been found to be one of the major direct consumers of photosynthetically-produced carbon and a significant sink
of oxygen (Azam et al., 1983; Smith & Kemp, 2001; Calvo-Díaz et al., 2011). Deemed to have a great influence on metabolism in an ecosystem, it is of great interest to study the role of the microbial community on metabolic rates. It is possible to determine the trophic state of the microbial community and use it as a useful indicator of the proportions of autotrophs and heterotrophs. The trophic state of the microbial community is expressed as the ratio between the carbon biomass of autotrophic and heterotrophic bacteria (RA/H). Variation in the RA/H may induce variations in the ecosystem net metabolism (Kiørboe, 1993; Lam et al., 2011). The ratio itself may vary depending on hydrodynamics and environmental parameters in the water column (Kiørboe, 1993; Teira et al., 2001; Arístegui et al., 2004; Schloss et al., 2007). In turn, these environmental parameters can vary on different time scales (Buesseler et al., 2007). It is then essential to study the role of the microbial community on metabolism as a function of the temporal variations of environmental parameters that could influence the metabolic rates of the organisms. This leads to a better understanding of the ecosystems functioning, not only through seasonal and annual environmental variations, but on the short term as well (daily and hourly environmental variations).
In recent decades, techniques have been developed in aquatic and marine ecosystems to estimate metabolic rates (GPP, NCP, R), including one method based on dissolved oxygen (DO) concentrations measurements. Odum (1956) was the first to bring this approach and estimate respiration and production in free-waters using daily modifications in the oxygen concentration. Among the techniques that were developed, one integrates free-water volumetric concentrations of DO through the water column (Gazeau et al., 2005a; Cole et al., 2010; Sadro et al., 2011; Staehr et al., 2012; Christensen, 2013). The NCP, GPP and R are hence expressed as integrated metabolic rates per unit of time (mmolC m-2 h-1). It has been shown that the integration method is equivalent to other methods (for example: whole-water volume-weighted, whole-water upper-mixed-layer approaches) and that it allows to take account of oxygen exchanges that could occur between water layers (Sadro et al., 2011). This approach is more reliable in a turbulent marine environment where environmental conditions can change on a daily scale. As
mentioned above, sources of DO for respiration come mainly from photosynthesis and fluxes between atmosphere and the water surface (Emerson et al., 2008). The fluxes of oxygen between atmosphere and the water surface must be considered to estimate global metabolism (Cole et al., 2010; Staehr et al., 2012) as they do not represent the oxygen produced from GPP. However, they still can be used for respiration that occurs through the whole water column. Respiration and production of oxygen lead to a net oxygen concentration in the water column, from which metabolism estimations from DO concentrations can be deduced and converted in terms of carbon production (Venkiteswaran et al., 2007). To date, several studies on metabolism have been carried out in many marine coastal environments (Cloern et al., 2014 and references therein). However, there are still many productive coastal zones in which metabolism has not yet been studied, such as the San Jorge Gulf (SJG).
The SJG is an oceanic semi-open shallow basin (~ 90 m) in the central area of Patagonia in Argentina. The continental shelf and coastal zones of the Argentinean plateau, are one of the world’s most productive zones regarding primary production (Garcia et al., 2008). Under the influence of the Patagonian continental shelf circulation dynamics influenced by the Argentinean shelf waters (Figure 1), the Patagonian Current, the Brazil Current and the Malvinas/Falkland Current (Garcia et al., 2008; Ferreira et al., 2009; Olguín Salinas et al., 2015; Ulibarrena & Conzonno, 2015), the coastal zone of the gulf presents environmental characteristics that vary over seasons and over shorter time scales such as large tides and tidal fronts (Ulibarrena & Conzonno, 2015). The SJG has great economic importance due to oil exploitation and fisheries (Roux et al., 1995; Sylwan, 2001; Fernández et al., 2005), but knowledge on biological aspects that could explain its great productivity still remains scarce. To date, there is no study on the microbial community and the metabolic rates in the gulf in the short term, neither on a daily nor on an hourly scale. It is essential to know this information, which could help explain the source of variability of metabolism within the summer season in the SJG.
In this context, the main objective of this project was to study the role of the microbial community on the metabolic rates in the central zone of the SJG. The specific objectives were, on short-term daily and hourly scales: 1) to determine RA/H and the abundances of autotrophs and heterotrophic bacteria in the microbial community and 2) to estimate hourly metabolic rates. We hypothesized that 1) RA/H will vary between day and night periods 2) metabolic rates (GPP, NCP and R) will vary on the same time scale and 3) that RA/H is correlated with the NCP.
1.5 MATERIAL AND METHODS
1.5.1 STUDY AREA
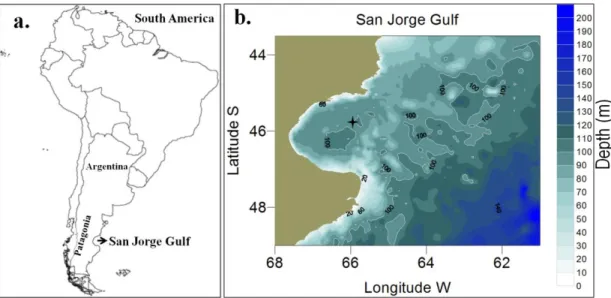
This research was conducted in summer during 36 consecutive hours from the 6th to 8th of February 2014 on board the R.V. Coriolis II in the SJG during the summer period. The Gulf is a half-opened shallow basin (~ 90 m) located in the Patagonia region (Argentina; Figure 2a; 45-47°S and 65°30’-67°40’W; Fernández et al., 2005). The Patagonian region is dominated by strong westerly winds and large semi-diurnal tides (~ 6 m, spring and neap tides from 6 to < 1 m) and is mainly influenced by oceanic circulation (Garcia et al., 2008). The area of the central zone of the Gulf is approximately 10 620 km2.
Figure 2. a) Location of the San Jorge Gulf in Patagonia, Argentina b) Approximate location of the fixed station in the SJG (four-pointed star). The map represents the bathymetry of the Gulf in meters. It has been designed based on the Hydrographic Naval Service of the Argentine Navy data.
1.5.2 SAMPLING DESIGN
This study was performed at a fixed station (Figure 2b; 45°56’S 65°33’W). Water column profiles of physicochemical data were obtained every two (2) hours between the surface and ~ 85 m depth at a speed of 0.5 m s-1. Data were measured with a rosette equipped with a Sea-Bird 19 plus V2 SeaCAT Profiler CTD and several probes to determine: salinity (PSU), temperature (°C), Photosynthetically Active Radiation (PAR, µEm−2 s−1), dissolved oxygen concentration (DO; mmolO2 m-3), fluorescence (chlorophyll a; Chl a; µg L-1) and density (σ-θ Kg m-3). Discrete seawater (SW) samples were collected every four (4) hours with 12 L Niskin bottles attached to the rosette at four (4) depths in the water column: surface (~ 2 m), chlorophyll a maximum (Chl a max: ~ 20 m), below the pycnocline (~ 70 m) and bottom (~ 85 m).
1.5.3 PHYSICAL AND CHEMICAL PROPERTIES OF THE WATER COLUMN
The properties of the water column determined were the surface mixed layer depth (MLD), the depth of the euphotic zone (Ze), the apparent oxygen utilization (AOU), nutrients concentrations and turbulence zones. The Brunt-Väisälä frequency (expressed as N) allowed us to estimate the surface mixed layer depth (MLD), and hence the average depth of the pycnocline. Using the density profiles data from the CTD, N was calculated as:
Eq. 1. N =
where g is gravitational acceleration (~9.8 m s-2), ρ is the density (~1025 kg m-3) and z is the depth. The dρ and dz represent the density and depth gradients. N indicates the particle oscillation frequency against hydrostatic equilibrium disturbances. In other words, it indicates the depth at which the oscillations occur when the pycnocline is displaced by buoyancy forces and returns to its resting position (Mann & Lazier, 2006c). N > 0 indicates a stable hydrostatic equilibrium, while N < 0 indicates a broken equilibrium, resulting in an unstable density gradient (Bougeault & Sadourny, 2001b). The square of the Brunt-Väisälä frequency (N2) represents the strength of the buoyancy and was used to estimate MLD (in m). The highest values of N2 for each density profile resulted in the highest buoyancy forces, corresponding to MLD.
The light attenuation coefficient (Kd, 400-700 nm), depth of euphotic zone (Ze: 1% of surface light), and surface irradiance (I0) were estimated from PAR according to the Beer-Lambert law:
Eq. 2.
Eq. 3. Kd =
where Kd = is determined as the slope of the linear regression of irradiance (I; regressions with r2 > 0.9), and Ze (Mann & Lazier, 2006a). The oxygen solubility (O2’) in the water column was calculated with temperature and salinity data according to the equation from Benson & Krause (1984) and was used to estimate the AOU (O2’-O2; Ito et al., 2004). To determine nutrients concentrations, seawater was sampled at each depth mentioned above using 250 mL glass bottles (pretreated with acid) in two replicates per depth and stored immediatly at -20°C until analyses. Nutrients concentrations were determined with an autoanalyzer Skalar at LOQyCA-CENPAT in Argentina following the Skalar protocols (Skalar Analytical, 2005). To evaluate the possibility of nutrient pumping between layers caused by turbulence, we determined the Richardson numbers (Ri) in the water column. Current velocity measurements were performed with a hull-mounted RDI 150 kHz Acoustic Doppler Current Profiler (ADCP). The depth at which a shear is observed in the water column was determined with the Richardson number (Ri), using current speed data from ADCP, and the buoyancy force (N2) as follows:
Eq. 5. Ri =
where is N2 and is the square of the current velocity gradient as a function of depth (Mann & Lazier, 2006b). Values of Ri > 0.25 indicates a stable layer, whereas Ri < 0.25 indicates a layer with high turbulence, and thus of shear possibility (Bougeault & Sadourny, 2001a).
1.5.4 MICROBIAL COMMUNITY ANALYSES
1.5.4.1 Phytoplankton
Single samples for analysis of Chl a were filtered (~500-1500 mL of SW depending on depth) through 25 mm Whatman GF/F filters (0.7 µm porosity) at 3 depths (surface, Chl a max and below the pycnocline). We considered there are week or no Chl a concentration at the bottom of the water column. Filters were preserved on board at -80°C before extraction. Chl a and phaeopigments were extracted on board in acetone (90%) for a period of 12 to 24 hours in the dark. Fluorescence measurements were performed on board in the dark with a Turner Designs 10-AU fluorometer according to the Parsons et al., (1984) method. These data were used to convert to Chl a concentrations the fluorescence data from the sensor installed in the rosette.
For the analysis of cyanobacteria and pico-nanophytoplankton, 5 mL samples were collected at the surface and Chl a max. Based on the method described in Belzile et al., (2008), samples were fixed with 20 µL of glutaraldehyde (25%; final concentration 1%) and were preserved at -80°C until analysis. Before the analysis, each sample was thawed and immediately mixed with a vortex. One (1) mL of each sample was pipetted in tubes, in which 1 µL of a beads suspension (10 µm) was added. Samples were analyzed by flow cytometry with a Beckman Coulter Epics Altra cytometer (Belzile et al., 2008). Given the size of cells < 20 µm, we assumed that each cell had a spherical biovolume. Biovolumes for cyanobacteria, picophytoplankton, and nanophytoplankton were converted to carbon biomass according to Arístegui et al., (2004). We used 250 fgC cell-1, 2100 fgC cell-1and 4400 fgC cell-1, for cyanobacteria, picophytoplankton and nanophytoplankton respectively, as conversion factors.
Samples of 12 mL were fixed with 96 µL of glutaraldehyde (25%; final concentration 0.2%) for analysis of microphytoplankton (>20 µm). Single samples were collected at surface and Chl a max. All samples were preserved at -80°C and were thawed at ambient temperature for analysis. A TE 10X buffer solution in filtered SW was prepared (10%
solution) and then filtered through a 25 mm Nylon Acrodisc filter (porosity 0.2 µm) with a 60 mL syringe. In each thawed sample, 1 mL of TE 10X buffer (10%) and 200 µL of a beads suspension (10 µm) were added. The analysis was undertaken with a Cytobuoy Cytosense Benchtop flow Cytometer (particle size range: from sub micron up to 1.5 mm diameter, channel : SWS, acquisition time : 180 s, speed pump : maximum, trigger level : ~14-20 mV) associated with the CytoClus 3 3.7.3.2 Software (CytoBuoy BV). Biovolumes of cells were determined with the mean lengths measured in FWS (Forward scatter mean length) and SWS (Sideward scatter mean length) by the Cytosense. Only the cells > 20 µm have been considered and biovolumes were converted to carbon biomass using a conversion factor of 0.11 pgC cell-1(Anderson & Rudehäll, 1993). The fraction < 20 µm was not considered with this instrument, but were considered with the Epics Altra cytometer for its higher resolution for small cell sizes.
1.5.4.2 Bacteria
For each cast, single samples of 4 mL at the 4 depths mentioned above were sampled. Each sample was fixed with 20 µL of glutaraldehyde (25%; final concentration ~0.1%) and preserved at -80°C until analysis. For the enumeration of bacteria, 200 µL of each thawed sample were added to 800 µL of TE 10X buffer in tubes (same buffer as mentioned above). Afterward, 0.3 µL of SYBR Green I (Invitrogen) was added to each sample, then mixed again with the vortex and left in the dark for 10 minutes (Belzile et al., 2008). This step allows the staining of bacterial nucleic acids. The analysis provided the total free bacteria counts in samples and was executed by flow cytometry with a Beckman Coulter Epics Altra cytometer (Belzile et al., 2008). Bacteria cell counts were converted in biovolumes, considering each cell has a spherical biovolume given their small size. Biovolumes were then converted to heterotrophic bacteria carbon biomass according to Arístegui et al., (2004), with a conversion factor of 20 fgC cell-1.
1.5.4.3 Carbon biomass ratios of autotrophs/heterotrophs
The RA/H ratios were calculated as: RA/H = A/(A+H) and were expressed in percentage (%). It is defined as the autotroph carbon biomass (A; picocyanobacteria, pico and nanophytoplankton, and microphytoplankton) to the total carbon biomass (autotrophs + heterotroph free-living bacteria; H). We have established the RA/H for the first two depths sampled, surface and Chl a max (mentioned above in the phytoplankton section) where active autotrophs could be sampled (Ze > 40 m).
1.5.5 METABOLISM MEASUREMENTS
1.5.5.1 The depth-integrated measurement approach
We estimated the whole-column metabolism using the depth-integrated approach. The free-water depth-integrated measurement technique surely presents methodological challenges but has a lot of advantages. Compared to the bottle incubation method, the free-water method is generally more realistic to characterize integrated metabolic rates, being more integrative across the water column and thus avoiding artifacts, generated by organisms being confined to small containers (Lauster, Hanson, & Kratz, 2006; Sadro et al., 2011). It includes many physical and biological processes that can modify volumetric oxygen concentrations such as: internal waves, mixing, zooplankton migrations, exchanges of gas in between water layers when pycnoclines are present, respiration occurring under the euphotic zone and it encompasses limits generated by the depth gaps between MLD and Ze (Sadro et al., 2011; Staehr et al., 2012; García-Muñoz et al., 2014). The depth-integrated approach does not require the volumetric mass balance accounting for vertical fluxes of DO between depth strata in the water column. It increases the sensitivity by incorporating the signal from the bottom of the water column and yields to more accurate whole-water column estimates of the community metabolism (Sadro et al., 2011). According to Staehr et al., (2012), the results obtained with this method in free water were comparable to other methods to estimate metabolic rates and accounted well for the physical fluxes between
depth strata. The calculation of NCP requires change in DO volumetric rates over a time interval within the same water mass (Mouriño-Carballido & Anderson, 2009). It also requires to take account of the gas exchange with the atmosphere and the MLD in which the exchange of oxygen can occur (Coloso et al., 2010). Hence, these gas flux estimates require accurate estimates of the MLD, which is the parameter that defines the layer of measurement and affects the calculation of gas-exchange fluxes (Coloso et al., 2010). To meet these requirements, NCP were corrected with the air-sea flux estimates derived from winds (described below). Like Staehr et al., (2012), we recognize that there may be a deviation between the magnitude of oxygen flux estimates and their true value, following a possible deviation between estimates and the true MLD at the moment of sampling.
1.5.5.2 Depth-integrated metabolism calculations
Volumetric dissolved oxygen concentrations (DO; mmolO2 m-3) from each CTD cast were calibrated with the Winkler method (Winkler, 1888; Parsons et al., 1984). Each cast of DO was divided into nine depth strata (z) of 10 m and DO concentrations were averaged in each stratum. The areal proportion (PAZ) of each depth stratum in the water column was computed using a 50 m radius (Christensen, 2013 and references therein). Environmental parameters in the central zone of the gulf showed few spatial variations (not shown). We can then assume that the fixed station can give a good representation of the metabolism in the central zone. Based on measurements described in Sadro et al., (2011), the areal proportion was then multiplied by the DO concentration (mmolO2 m-3) of each depth stratum for each cast. The resulting values of each stratum were integrated with depth with a simple trapezoidal rule. Integration yielded single areal values for the mass of DO for each cast for the whole water column (Melack, 1982) following this equation:
Eq. 6. DOI =
where DOI represents the water column depth-integrated (WCDI) DO concentration (mmolO2 m-2) and was used to estimate WCDI NCP (NCPI; mmolO2 m-2 h-1) as:
Eq. 7. NCPI =
where ΔDOI is the change in areal depth-integrated DO (mmolO2 m-2) between casts, Δt is the time step between casts and DA (mmolO2 m-2) represents the oxygen exchange between the atmosphere and the surface water. Oxygen exchange is a function of the gradient between the surface seawater and the atmosphere and can be negative (sink into the seawater) or positive (out of the seawater). The coefficient of oxygen exchange Ks in seawater was determined as Ks (Wanninkhof, 1992). The oxygen exchange between surface water and atmosphere can be computed as follows:
Eq. 8. DA=
where Ks (cm h-1) is the gas exchange coefficient for DO at ambient temperature, DOwater is the concentration of DO (mmolO2 m-3) in the first depth stratum at the water surface and DOatmo is the concentration of DO at 100% saturation at ambient temperature (mmolO2 m-3). To determine Ks, the value of K660 was calculated as:
Eq. 9. K660 =
where U10 is the wind speed recorded on board the ship at 10 m height, assuming steady winds at the moment of measurement (Wanninkhof, 1992). K660 is the gas transfer velocity at a Schmidt number (Sc) of 660 in seawater for oxygen. The Schmidt number is defined as the kinematic viscosity of water divided by the diffusion coefficient of the gas. The Sc for O2 in seawater was calculated using the empirical equation described in Wanninkhof (1992):
Eq. 10. Sc =
where T is the given temperature at the surface in degrees Celsius (°C).
Net community production (NCP) was calculated considering day and night oxygen profiles over the 36 hours of sampling, and used it to estimate GPP and R. Casts corresponding to at least 1 h before and after sunset and sunrise were excluded, considering that during nighttime photosynthesis (GPP) does not occur. During nighttime, the only oxygen-demanding process occurring is respiration, so we considered that RI (night) is equal to nighttime NCPi (night) (Gazeau et al., 2005a; Coloso et al., 2008; Sadro et al., 2011; Christensen, 2013). We estimated daytime RI(day) by averaging the nighttime RI(night) from the same day period because it cannot be measured directly. Daytime GPPI was computed as the sum of NCPI(day) and RI(day) (positive values) as: GPPI = NCPI(day)+RI(day). This method to estimate metabolic rates assumes that there is no variability of RI (day) during daytime and leads us to underestimate daytime R and GPP. Even though there is evidence that daytime R may be higher than nighttime R (Sadro et al., 2011), it does not have an influence on NCP, which is the result of the balance between GPP and R (Cole et al., 2000; Staehr et al., 2012). GPPI, RI and NCPI were converted to carbon metabolic rates (mmolC m-2 h-1) considering a photosynthetic quotient (PQ) of 1.3 (Redfield et al., 1963; Lenton & Watson, 2000) and a respiratory quotient (RQ) of 1 (Hopkinson & Smith, 2005). To lighten the reading, we consider that GPP, NCP and R in the text are equivalent acronyms for GPPI, NCPI and RI, respectively.
1.5.6 STATISTICAL ANALYSES
Comparisons of means using two-tailed and one-tailed parametric Student’s t-tests were computed to determine if significant differences exist over the short period between: metabolic rates (GPP, NCP and R), RA/H ratios (surface vs. Chl a max and over the time period), and abundances of phytoplankton and bacteria cells (among depths and in among