T
T
H
H
È
È
S
S
E
E
En vue de l'obtention duD
D
O
O
C
C
T
T
O
O
R
R
A
A
T
T
D
D
E
E
L
L
’
’
U
U
N
N
I
I
V
V
E
E
R
R
S
S
I
I
T
T
É
É
D
D
E
E
T
T
O
O
U
U
L
L
O
O
U
U
S
S
E
E
Délivré par l’Université Toulouse III – Paul SabatierCotutelle international avec
l’Université d’Etat de Tomsk (Russie)
Discipline ou spécialité : Hydrologie
JURY
Alexei Kouraev,Maître de Conférance, Université Toulouse III,Directeur de thèse Valeriy Zemtsov, Professeur, Université d’Etat de Tomsk, Co-Directeur de thèse, Russie
Nick Hall, Professeur, Université Toulouse III, Président du jury Dmitriy Burakov, Professeur, Université de Krasnoyarsk, Russie
Valentina Gorbatenko, Professeur, Université d’Etat de Tomsk, Examinatrice, Russie
Ecole doctorale :Science de l’Univers,de l’Environnement et de l’Espace (SDU2E)
Unité de recherche : Laboratoire d’Etudes en Géophysique et Océanographie Spatiales
Rapporteurs : Jürgen Herget, Professeur, Université de Bonn, Allemagne Présentée et soutenue par Maria KOLMAKOVA
Le 17 décembre 2012
Titre : La variabilité hydrologique et climatique dans les bassins versants de la
Sibérie Occidentale (selon les données des stations météorologiques, de ré-analyse météorologique et d’altimétrie satellitaire)
Acknowledgements
This Ph.D. thesis was supported by the French Governement scholarship for the joint supervision of thesis (2008-2011) as well as within the support grants of Tomsk State University Tomsk, Russia), Paul Sabatier University (Toulouse, France), Laboratory of Studies of Space Geophysics and Oceanography (LEGOS) and Russian Foundation for Basic Research. The Ph.D. thesis is a part of CAR-WET-SIB («Biogeochemical cycle of carbon in wetlands of West Siberia») international project between France and Russia.
First of all, I would like to address my sincere gratitude to my advisors Valeriy Zemtsov and Alexei Kouraev as well as to co-authors of the publications Elena Zakharova, Sergey Kirpotin, Nelly Mognard for ideas, consultations and help during my PhD thesis.
I’m also very grateful to Irina Kuzhevskaya from Tomsk State University and Sylvan Biancamaria from LEGOS in Toulouse for invaluable help in climate data processing and its analysis. A special thank to Rinat Manasypov – a Ph.D. student from Tomsk State University for his help during the field campaign in the north of West Siberia.
I would like to extend my sincere gratitude to all colleagues and Ph.D. students of LEGOS as well as to CROUS (Centre régional des œuvres universitaires et scolaires) of Toulouse for support and encouragement during my stay in France.
Finally, I would like to thank all my family and my friend Stéphane for their patience and support throughout this period. I would not have gone so far without their unfailing support and encouragement.
Résumé
Pertinence du sujet. Actuellement, le changement climatique est confirmé par de nombreux faits. La hausse de la température globale moyenne à la surface de la terre au cours du XXème siècle, selon l’estimation de divers auteurs (Brohan et al., 2006 ; Hansen et al., 2005), est de 0,6 à 0,7°C. De paire avec les changements de régime thermique, l’humidification générale des sols change ainsi que le régime hydrologique (crues, inondation, sècheresse, etc). L’impact des facteurs naturels et anthropiques, se superposant les uns aux autres, provoquent des changements sur les ressources en eau à l’échelle régionale.
Pour prédire les futurs changements climatiques, des données à long terme sur les conditions climatiques et hydrologiques sont requises, et peuvent être obtenues non seulement à l’aide des observations obtenues dans les stations hydrométéorologiques, mais aussi à l’aide des données de ré-analyse météorologique et d’altimétrie satellitaires.
Le caractère fortement marécageux du territoire de la Sibérie occidentale et la rareté des stations d’observations hydrométéorologiques compliquent le suivi du régime hydrologique des bassins versants. Dans une telle situation, la prise en compte des données de ré-analyse météorologique et d’altimétrie satellitaires, assurant une couverture régulière de l'ensemble du territoire étudié de la plaine de Sibérie occidentale, permet de compléter les observations in situ et d'élargir considérablement la portée des recherches, ce qui détermine la pertinence de ce travail.
Le but du présent travail est d’évaluer la variabilité des disponibilités en chaleur et en humidité de diverses zones climatiques et hydrologiques sur le territoire de la Sibérie occidentale en utilisant conjointement les données des stations météorologiques, de ré-analyse météorologique et d’altimétrie satellitaire dans un contexte de changement climatique.
Objectif de la recherche :
• analyser les tendances annuelles et saisonnières des températures de l’air et des précipitations atmosphériques sur une période de plusieurs années en utilisant les données des stations météorologiques et selon la ré-analyse ERA-40;
• définir la valeur seuil du coefficient de rétrodiffusion d’énergie pour chaque bassin versant étudié. Cette valeur seuil, couplée aux données d'altimétrie satellitaire, permet de distinguer les surfaces inondées des surfaces sèches, avec pour but l’évaluation objective de la quantité d’eau;
• évaluer la variabilité dans le temps (saisonnière et annuelle) du régime d’humidification des bassins versants de zones aux caractéristiques hydrométéorologiques contrastées par la méthode de l’altimétrie satellitaire (années de 1993 à 2008).
Objets d’étude. Des bassins fluviaux de superficie intermédiaire se trouvant dans 4 types de zones hydrologiques, climatiques et marécageuses de la Sibérie occidentale :
I. Zone d’humidification excessive et d’insuffisance de chaleur, zones de marécages mamelonnés : déversoirs des rivières Polouï, Nadym, Pour, Taz.
II. Zone d’humidification excessive et de tourbières bombées oligotrophes : déversoirs des rivières Sosva du Nord, Konda, Tavda, Kazym, Nazym, Liamine, Tromégan, Vakh, grande Iougan, Vassiougan, Tym et Ket.
III. Zone d’humidification principalement excédentaire et suffisante dans son extrême sud et de chaleur suffisante, correspondant à la zone d'eutrophisation plate et de tourbières mésotrophes : déversoirs des rivières Toura et Om dans leurs cours supérieurs.
IV. Zone d’humidification insuffisante et de chaleur suffisante, zone d'eutrophisations concaves et de marais salins : s’y trouvent la partie basse du bassin de l’Om et la zone d’écoulement interne (ou la région endoréique) de la zone située entre les fleuves Ob et Irtych.
La nouveauté scientifique de ce travail se décline en plusieurs points :
• Pour les bassins fluviaux (21 déversoirs), selon les données de ré-analyse, l’évolution de la température de l’air et des précipitations atmosphériques est analysée sur de nombreuses années.
• Emploi d’une nouvelle approche d'évaluation du niveau d’eau de la zone étudiée à l'aide de données d'altimétrie satellitaire en analysant le signal réfléchi ou le coefficient de rétrodiffusion exprimé en décibels.
• Mise en évidence d’une relation entre le degré d’inondation selon les données d'altimétrie satellitaire et les précipitations de la période d’été selon les données de ré-analyse pour la série de bassins versants étudiés.
• Les données d'altimétrie satellitaire sont représentatives de l’évolution dans le temps du niveau d’eau.
• Sur les bassins versants étudiés, une zonation géographique est proposé en fonction du caractère saisonnier du coefficient d’inondation.
Portée pratique du présent travail et mise en valeur des résultats. La thèse est réalisée dans le cadre du projet international franco-russe CAR-WET-SIB « Cycle Biogéochimique du carbone dans les paysage marécageux de Sibérie occidentale » avec le soutien de l’ambassade de France (bourse d’études du gouvernement français sous une double gestion scientifique 2008-2011), ainsi qu’avec le soutien de la bourse de recherche du fond russe de la recherche fondamentale.
Le présent travail montre comment la méthode de l'altimétrie satellitaire peut être utilisée non seulement pour mesurer la hauteur des nappes d’eau, mais aussi pour évaluer la variabilité saisonnière d’une année sur l’autre du niveau d’eau dans les bassins fluviaux.
Les principales conclusions et les résultats des travaux sont utilisés lors de la préparation et l'enseignement des cours du programme de maîtrise en « hydrométéorologie », en « hydrologie-sol » ainsi qu’en « hydrologie et géo-écologie des zones marécageuses pétrolières et gazières » à l'Université d'Etat de Tomsk.
Approbation des résultats de l’étude. Les principales conclusions de cette thèse ont été présentées et discutées lors de conférences internationales et en Russie : Union européenne des géosciences (European Geosciences Union, Vienne, Autriche, 2009, 2010); Agence spatiale européenne (ASE) «Observation de la Terre par satellite et cycle de l'eau : vers une approche complexe du cycle de l’eau » («Earth observation and the water cycle: towards a water cycle multi-mission strategy ») (Frascati, Italie, 2009); Union européenne des géosciences «Leonardo» sur les enjeux actuels des ressources en eau (EGU Leonardo Topical Conference Series on the hydrological cycle – 2010) (Luxembourg, 2010); Enviromis-2010 (Tomsk, 2010); «Les problèmes fondamentaux de l'eau et des ressources en eau» (Barnaoul, 2010); au séminaire tripartite Russo-Franco-Allemand « Le rôle de régulateur climatique des écosystèmes forestiers et marécageux : aspects paysagers, écologiques et sociaux » (The climate regulating role of forest-bog ecosystems: landscape-ecological and social aspects) (Hambourg, Allemagne, 2010).
Sur les données de cette thèse ont été publiés 5 articles, dont deux dans les revues « Journal of Hydrology and Meteorology » (2011) et dans le « Messager de l’université d'Etat de Tomsk », toutes deux incluses dans la liste des publications et des revues scientifiques.
Le premier chapitre décrit les principaux facteurs physiques et géographiques et les lois qui ont déterminé le développement de la zone d'étude et les caractéristiques de son climat.
Le deuxième chapitre est consacré aux méthodes d’étude qui sont utilisées dans la présente thèse. Au début une brève description des objets d'étude est fournie, puis les méthodes mêmes de l’étude. Le chapitre expose en détail le principe de fonctionnement de la méthode d'altimétrie satellitaire, résume les méthodes de télédétection, et également expose la méthode de ré-analyse à l’aide de laquelle sont étudiées les caractéristiques climatiques.
Le troisième chapitre présente les résultats des travaux accomplis 1) L’analyse des disponibilités en chaleur et en humidité de diverses zones climatiques et hydrologiques marécageuses, 2) L’analyse de la variabilité de la quantité d’eau dans les bassins fluviaux selon les données d'altimétrie satellitaire.
Les principales conclusions et les résultats des travaux sont les suivants :
1. Selon les données météorologiques des stations et celles de ré-analyse sont analysés les changements de température de l’air et la somme des précipitations atmosphériques dans les bassins de rivières situées dans diverses zones climatiques et hydrologiques marécageuses. L’analyse des données sur les températures moyennes de l’air sur de nombreuses années (1926-2005) montre notamment que le réchauffement le plus élevé est observé dans la partie septentrionale de la plaine dans les déversoirs des rivières Nadym et Taz (0,37°C sur 10 ans), et une augmentation significative de la somme des précipitations atmosphériques est observée dans les régions proches de l’Oural (Sosva du Nord, Konda, Tavda, Toura) et dans les déversoirs des rivières Pour, Taz, Nazym et Vakh. Une tendance à l’augmentation de la somme des précipitations atmosphériques est observée sur toutes les zones de plaine, à l’exception des déversoirs des rivières Chtchoutchia, Vassiougan et Om, qui se caractérisent par des indices négatifs de leur tendance générale.
2. L’analyse des changements de température de l’air et de la somme des précipitations atmosphériques selon les particularités saisonnières ont mis en évidence ce qui suit :
• On observe une augmentation significative de la température de l’air dans la période de printemps (de mars à mai) avec le réchauffement le plus élevé dans le nord de la plaine, et également à la station Barabinsk (0,4-0,8°C sur 10 ans)
• On observe une augmentation significative de la somme des précipitations atmosphériques dans les périodes d’hiver, de printemps et d’été. Cependant, au printemps, on observe une augmentation significative des précipitations dans la plupart des déversoirs des rivières de plaine situées dans chaque zone climatique et hydrologique marécageuse.
Le changement de température de l’air et de la somme des précipitations atmosphériques amène à un changement dans le régime d’inondation du territoire, qui a été évalué à l’aide de la méthode d’altimétrie satellitaire.
3. La méthode d’altimétrie satellitaire a permis d’évaluer la quantité et la variabilité interannuelle et saisonnière du degré d’inondation des déversoirs des rivières du bassin fluvial de l’Ob.
4. Pour l’évaluation des changements sur de nombreuses années du coefficient d’inondation des déversoirs étudiés dans la période d’été et ses changements à l’intérieur de chaque saison dans l’année, une valeur seuil du coefficient de rétrodiffusion a été déterminée pour chaque déversoir à l’aide des données satellites TOPEX/Poseidon et ENVISAT.
5. D’après les données du satellite TOPEX/Poseidon, a été proposée une classification des bassins fluviaux selon le critère de progression du coefficient d’inondation minimal en été
d’une année sur l’autre, et ont également été mis en relief quatre zones géographiques. La classification en question concorde bien avec la classification de V.A. Zemtsov (2003), basée sur la similitude de la variabilité sur de nombreuses années de l’écoulement annuel et mensuel des rivières.
6. Des groupes de déversoirs sont mis en évidence, pour lesquels la variabilité de la quantité d’eau d’une année sur l’autre d’après les données du satellite TOPEX/Poseidon concorde bien avec la somme des précipitations atmosphériques par la méthode de ré-analyse sur la période de 1993 à 2001.
7. Il est établi qu’avec le temps on observe une baisse significative de la quantité d’eau (TOPEX/Poseidon) dans la zone d’écoulement interne entre les fleuves Ob et Irtych ainsi que dans le déversoir de la rivière Om.
8. En utilisant les données du satellite ENVISAT, a été réalisée une classification des déversoirs sur le critère de progression du coefficient d’inondation d’une année sur l’autre. Quatre zones géographiques ont également été mises en évidence qui coïncident dans l’ensemble avec les zones définies par les données du satellite TOPEX/Poseidon. L’augmentation de la quantité d’eau a été détectée dans les déversoirs des rivières de la région proche de l’Oural, dans les régions boisées de Sourgout, dans la zone située entre les fleuves Ob et Ienisseï, et également dans le déversoir de la rivière Vassiougan.
Dans l’ensemble, les études réalisées ont montré la représentativité des données d’altimétrie satellitaire en matière d’évaluation du degré d’inondation des déversoirs fluviaux et de sa variabilité spatio-temporelle.
Perspectives pour les études ultérieures. Les études ultérieures seront orientées vers l’ajout de précisions concernant les valeurs seuil du coefficient de rétrodiffusion afin de subdiviser les paysages se différenciant par leur degré d’inondation et de réchauffement, et vers l’étude des dynamiques de leur inondation selon les saisons et sur une période de nombreuses années.
Abstract
GENERAL DESCRIPTION OF THE STUDY
Relevance of the study. For the climate change prediction in the future there is a necessity in reliable and long-term data of climate and hydrological parameters that are available from meteorological and hydrological stations as well as from reanalysis and satellite radar altimetry data.
A meteorological reanalysis is the analysis of past observational data using a fixed, tried-and-tested, data assimilation system. Model reanalysis is widely used among various scientific groups both in Russia and abroad (Serreze et al., 2005; Hansen et al., 2005; Brohan et al., 2006; Kabanov, 2008; Ippolitov et al., 2008; Gordov, 2007). ERA-40 is one of the most reliable reanalysis today.
Satellite radar altimetry is one of the active remote sensing methods. Although satellite radar altimetry was initially designed for oceanographic applications such as sea level change, ocean circulation, and ocean tides (Fu, Cazenave, 2001), it has been demonstrated to be applicable to non-ocean surfaces for monitoring continental surfaces over ice sheets (Zwally et al., 1983) and surface topography in Antarctic and Greenland (Legresy, Remy, 1997; Remy et al., 1999), for water level measurements (Birkett 1995, Cazenave et al. 1997, Alsdorf et al. 2001) as well as for the detection of flooded zones (Zakharova, 2009). The latter aspect is very important in studying the hydrology and geoecology of the West Siberian Plain that is characterized by high level of swamping. Flooded zone is understood to be a relative area of the territory permanently or temporarily covered with moisture (lakes, rivers, bogs of different types, flood plains, swamps). It changes with space and time and reflects a moisture pattern of the territory. In this study we use the flooding coefficient as an equivalent of moisture coefficient proposed by V.S. Mezentsev and I.V. Karnatsevich (1969).
Because of high level of swamping in West Siberia and a sparse network of hydrometeorological stations, monitoring of hydrological regime is hindered. In such a situation, it is necessary to involve model reanalysis and satellite altimetry data that ensure the regular coverage of the whole West Siberian Plain, making it possible to supplement field studies and to considerably expand the area of research. This determines the relevance of the thesis.
The main goal of the study is to estimate the dynamic of air temperature and precipitation in different hydrological and climatic zones of West Siberia in the context of climate change from meteorological stations data, reanalysis and satellite altimetry.
Objectives:
• to analyze annual and seasonal trends of air temperature and precipitation from meteorological stations data and ERA-40 reanalysis;
• to apply satellite altimetry data for estimation of flooded zones using the threshold value of the backscatter coefficient for each watershed in order to differentiate flooded and water-free surfaces;
• to estimate the temporal (seasonal and interannual) variability of moisture regime of watersheds in different landscape zones from satellite radar altimetry (1993-2008).
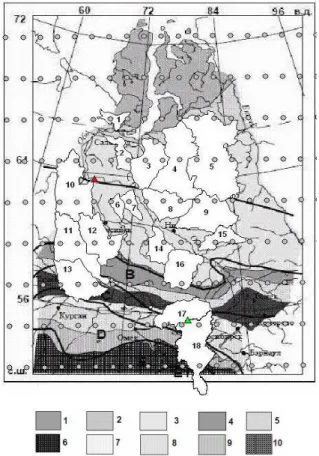
Objects of the study are watersheds (fig. 1) situated in different hydrological and climatic zones as well as wetland zones:
I. Zone of excessive moistening and insufficient heat and moisture, zone of palsa bogs include watersheds of Poluy, Nadym, Pur and Taz rivers.
II. Zone of excessive moistening and oligotrophic bogs include watersheds of Severnaya Sosva, Konda, Tavda, Kazym, Nazym, Lyamin, Tromyegan, Vakh, Bolshoi Yugan, Vasuygan, Tym and Ket rivers.
III. Zone of mostly excessive and sufficient heat and moisture in the southern border of Western Siberia, zone of flat eutrophic and mezothrophic bogs include watersheds of Tura and upper Om rivers.
IV. Zone of insufficient moistening and sufficient heat and moisture, zone of eutrophic salt fens include watershed of lower Om river and Inner watershed of Ob and Irtysh interfluve area. Subject of the study is various indicators of heat and moisture of watersheds in different hydrological and climatic zones of West Siberia from meteorological stations, reanalysis and satellite altimetry.
Satellite radar altimetry, cartographical and statistical methods are used in the study.
Data used in the study. Meteorological data for the years 1926-2005 were obtained from the daily temperature and precipitation data for Barabinsk and Berezovo stations dataset, available online at the All-Russian Research Institute of Hydrometeorological Information-World Data Center (RIHMI–WDC) (www.meteo.ru). Daily six-hour temperature and precipitation data ERA-40 for the years 1958-2001 were retrieved from the European Center for Medium-Range Weather Forecasts (ECMWF) website (www.ecmwf.int).
Satellite radar altimetry data of TOPEX/Poseidon and ENVISAT were used to estimate the variability and extent of flooded zones of the 21 watersheds in West Siberia. Altimetry data were obtained from the Centre of Topography of the Oceans and the Hydrosphere (CTOH) website (http://ctoh.legos.obs-mip.fr/). The following materials were used in the analysis: 1) vegetation map of West Siberia (1:1500000 map scale) (1976), 2) hydrographical characteristics data
(percentage of lakes + percentage of swamps) from the Water Surface Resources of West Siberia (1971-1975 and 2009).
Scientific originality of the study is 1) to use ERA-40 model reanalysis data for evaluation of air temperature and precipitation variability for 21 watersheds; 2) to use satellite altimetry data for estimation of spatial and temporal variability of flooded zones based on the analysis of a reflected signal or backscatter coefficient (BSC), expressed in decibels, a threshold value of this coefficient is selected for each watershed and compared with historical data; 3) in establishing the correlation between the extent of inundation and summer precipitation data from model reanalysis for a number of watersheds; 4) in validation the representativity of satellite altimetry data for estimating time dynamics of flooded watersheds; 5) the classification of the Ob’s basin rivers based on the seasonal dynamics of the backscatter coefficient.
Implementation of results. Satellite radar altimetry is applicable not just to measure height above the surface but also to estimate the variability of various flooded zones (seasonal and interannual). The temporal variability of flooded areas is given in this study.
The main results and conclusions of this work are used for lecture courses within the master programs in «hydrometeorology», «land hydrology», «hydrology and environmental studies of swamped oil-and-gas territories» in Tomsk State University as well as for hydrological monitoring of the West Siberian river basins.
Principle defended statements:
1. ERA-40 reanalysis is reliable data for estimation of air temperature and precipitation variability in the watersheds of the West Siberian Plain.
2. Satellite altimetry is reliable data for estimation the extent and temporal variability of flooded zones.
3. Satellite altimetry is applicable for geographic division of the study area basing on the seasonal and interannual variability of the extent of flooded zones.
Individual contribution. The author of the study has been taken part in statement of objectives and results interpretation. The main results of the study have been obtained by the author of the thesis. Altimetry data processing has been implemented together with A. Kouraev and E. Zakharova colleagues from LEGOS in Toulouse.
Conferences and seminars. The main results of the study have been discussed on the international and regional conferences: EGU (European Geosciences Union, Vienna, Austria, 2009, 2010); ESA (European Space Agency) «Earth observation and the water cycle: towards a water cycle multi-mission strategy» (Frascati, Italy, 2009); EGU Leonardo Topical Conference Series on the hydrological cycle (Luxemburg, 2010); Enviromis-2010 (Tomsk, Russia, 2010); «Fundamental problems of water and water resources» (Barnaul, Russia, 2010); trilateral
seminar (Russia, France and Germany) «The climate regulating role of forest-bog ecosystems: landscape-ecological and social aspects» (Hamburg, Germany, 2010); «Climatology and hydrology of West Siberia» (Tomsk, Russia, 2012).
It has been published 6 articles in co-authorship including two articles in the peer-reviewed journals.
Thesis organization and its volume. The manuscript is composed of 2 extended abstracts in French and English, introduction, three chapters, conclusions (in Russian) and bibliography. All tables, figures and pictures in the text, if it’s not explained other, are done by the author of this dissertation.
DESCRIPTION OF THE STUDY
Chapter 1. General description of the territory
This chapter describes the physic and geographic factors as well as mechanisms that determined the evolution of the West Siberian Plain. Climate change of various regions has its particular characteristics and differs from the global state. Ippolitov et al. (2008) and Kabanov (2008) have stated that climate warming in Siberia for the last 30 years is characterized by the heterogeneous sub-regional structure with «hot spots» in some regions up to 0,5°C/decade. There is a significant change in the general moisture of the territory as well as in the hydrological regime. Moreover the wetland hydrographic net and its characteristics describe in details because the wetland formation on the territory of West Siberia plays a very important role providing special hydrological conditions (Zemtsov, 1976) and must be considered in its monitoring.
Chapter 2. Methods
This chapter is devoted to methods used in the study. The following sources were used as initial data for estimation of the climate change pattern based on air temperature and atmospheric precipitation: 1) archives of the All-Russian Research Institute of Hydrometeorological Information – World Data Center” (RIHMI-WDC) (www.meteo.ru) – daily records from meteorological stations of West Siberia, 2) ERA-40 model reanalysis data from the European Center for Medium-Range Weather Forecasts (ECMWF) (www.ecmwf.int). The monitoring results from meteorological stations were used for control of model reanalysis data. These data are summarized below.
The analysis of the air temperature and atmospheric precipitation data was carried out for the Berezovo station from 1936 to 2005 (69 years of observations) and the Barabinsk station from 1926 to 2005 (79 years). The first station is located nearly at the mouth of the Severnaya
Sosva river, the second one is positioned near the northern boundary of the inner watershed of Ob’-Irtysh interfluve area. The archive data in relation to temperature and precipitation are regularly adjusted. The sequences of precipitation data are corrected for exclusion of discontinuity. They are adjusted for wetting and transition from rain gauges to precipitation gages. However, the precipitation data contain a significant element of instrumental discontinuity, which is partly associated with underestimation of solid precipitation, especially those that accompanied with snowstorms and strong winds (Estimation Report…, 2008).
The ERA-40 reanalysis archive contains the data from September 1957 to August 2002, with the spatial resolution of 2.5° along the latitude and longitude at regular grid points and the time resolution of 6 hours. We analyzed the air temperature and precipitation data from 1958 to 2001 by arithmetic averaging of the data at all regular grid points that fell into the area of each specific watershed (fig. 1).
Average annual air temperatures and total atmospheric precipitation were analyzed for a calendar year. Seasonal temperature and precipitation time series were conventionally taken with fixed boundaries: winter (December of the previous year – February, DJF), spring (March – May, MAM), summer (June – August, JJA), autumn (September – November, SON). For estimating statistical significance of trends using the Student’s test, a confidence level was set at 5% (α = 0,05).
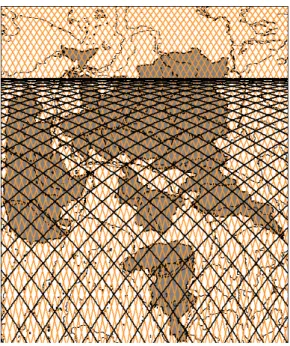
We used the satellite altimetry method to estimate the moistening mode of the territory (or more exactly its inundation extent). This method has some great advantages as compared with field observations. The classification of remote sensing methods based on different criteria, such as equipment installed on the system, radiation bands and an operating principle (fig, 2) is presented. The short description of passive and active remote sensing systems is given.
This thesis uses the satellite altimetry method, which is one of the active remote sensing methods. The operating principle is as follows: the radar altimeters permanently transmit signals to Earth (towards the nadir (upright), and receive the echo from the surface. Altimetry satellites basically determine the distance from the satellite to a target surface by measuring the satellite-to-surface round trip time of a radar pulse (fig. 2).
Hydrologic and climatic zones [by Mezentsev, Karnatsevich, 1969]:
А. Excessive moistening in moderate and wet years and optimal
moistening in dry year at a frequency of once every 5 years;
B. Zone of excessive moistening and insufficient heat supply in
wet year at a frequency of once every 5 years and optimal moistening in moderate and wet years at a frequency of once every 5 years;
С. Zone of optimal moistening and heat supply in moderate
year and in wet year, at a frequency of once every 5 years and insufficient moistening in dry year at a frequency of once every 5 years;
D. Zone of insufficient moistening and excessive heat supply in
dry year at a frequency of once every 5 years and optimal moistening in moderate year and in wet year at a frequency of once every 5 years;
E. Zone of highly insufficient moistening and excessive heat
supply in moderate and dry years at a frequency of once every 5 years, as well as insufficient moistening in wet year at a frequency of once every 5 years;
А1. Zone of highly excessive moistening and insufficient heat
supply;
Е1. Zone of highly insufficient moistening and excessive heat
supply.
Natural zones [by Bulatov, 1996]:
1. tundra; 2. forest tundra; 3. northern and middle taiga; 4. southern taiga; 5. sub-taiga (mixed forests); 6. small-leaved forests; 7. northern forest steppe; 8. central forest steppe; 9. southern forest steppe; 10. steppe.
Figure 1
– Map of coverage of study watersheds with the coordinate grid of ERA-40 model
reanalysis (watersheds: 1 – Shchuchya, 2 – Poluy, 3 – Nadym, 4 – Pur, 5 – Taz, 6 – Nazym, 7 – Lyamin, 8 – Tromyegan, 9 – Vakh, 10 – Severnaya Sosva, 11 – Tavda, 12 – Konda, 13 – Tura, 14 – Bolshoy Yugan, 15 – Tym, 16 – Vasyugan, 17 – Om, 18 – Inner watershed of Ob and Irtysh interfluve area) – marked with circles. Red triangle – Berezovo meteostation, green triangle – Barabinsk meteostation.Figure 2 – Altimetric measurement scheme (www.aviso.oceanobs.com; Aviso User handbook, 1996); A – general view; B – in details
А
Therefore, the satellite altimetry method can be used for measurement of the distance between the satellite and the reflective surface, as well as the waveform, which carries the information on nature and properties of the surface (Vignudelli et al., 2011). Waveform represents a time change in value and shape of an incoming signal. One of the waveform elements is energy of an altimetry signal, which is expressed as backscatter coefficient (BSC)
(σ0). It is measured in dB and used in this thesis for analyzing inundation extent of study watersheds. Open water surface gives a higher BSC value that less moistened surface. Its value also depends on type of underlying surface – on relief, soil, and vegetation. For example, in the case of open water surface the signal is strong: BSC ≥ 15 dB. The reflected signal is weaker, e.g. in mountain areas with a high diversity of elementary surfaces, from which a signal is reflected at different angles with high energy losses, as well as in dry meadows densely covered with grass, and, in a greater degree, in forests.
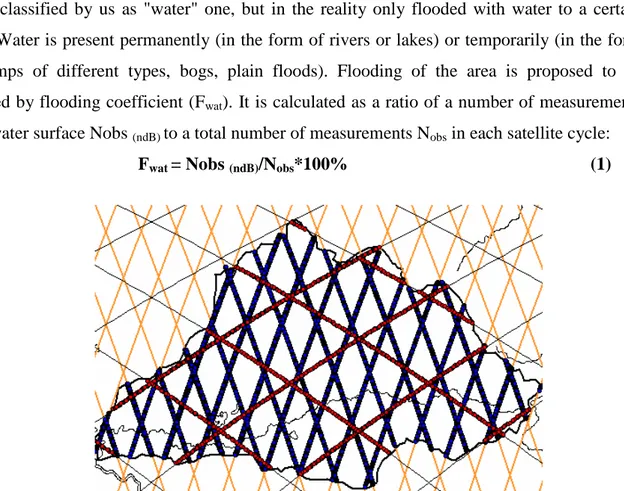
The thesis uses the data obtained from satellite altimeters TOPEX/Poseidon and ENVISAT. A time repetition interval (cycle) of measurements along the satellite tracks is equal to 10 and 35 years, respectively. The zone of coverage with satellite tracks is secured within 66° of north latitude up to 66° of south latitude for TOPEX/Poseidon and 82.4° of north latitude up to 82.4° of south latitude for ENVISAT (fig. 3).
Figure 3 – TOPEX/Poseidon and ENVISAT tracks’ coverage of watersheds (TOPEX/Poseidon – black; ENVISAT – orange)
Altimetry data processing
1. The initial satellite altimetry data were obtained using CTOH software (http://ctoh.legos.obs-mip.fr/ French Observation Service dedicated to satellite altimetry studies), taking into account instrumental errors and adjustments for environment effect. The data
represented an averaged signal with a 0,1 sec range values from radar echoes corresponding to along-track ground spacing of 580 m for TOPEX/Poseidon and 380 m for ENVISAT. The distance between satellite tracks is 315 km for TOPEX/Poseidon and 85 km for ENVISAT (fig. 4). The points along the track correspond to satellite signals. Points of intersection of tracks with watershed boundaries were taken using MapInfo software.
2. We determined a total number of altimetry measurements in each cycle, as well as a number of measurements from among them that fall into water surface, or more exactly the surface classified by us as "water" one, but in the reality only flooded with water to a certain extent. Water is present permanently (in the form of rivers or lakes) or temporarily (in the form of swamps of different types, bogs, plain floods). Flooding of the area is proposed to be measured by flooding coefficient (Fwat). It is calculated as a ratio of a number of measurements
above water surface Nobs (ndB) to a total number of measurements Nobs in each satellite cycle:
Fwat = Nobs (ndB)/Nobs*100% (1)
Figure 4 – TOPEX/Poseidon and ENVISAT coverage of Vakh watershed by altimetric signals (TOPEX/Poseidon – red dots; ENVISAT – blue dots)
A number of measurements Nobs for 10-day TOPEX/Poseidon (49-753 points) and
35-day for ENVISAT (1261-18,509 points) of satellite cycles for study watersheds depend on watershed area. It is obvious that Fwat value changes in time depending upon seasons, as well as
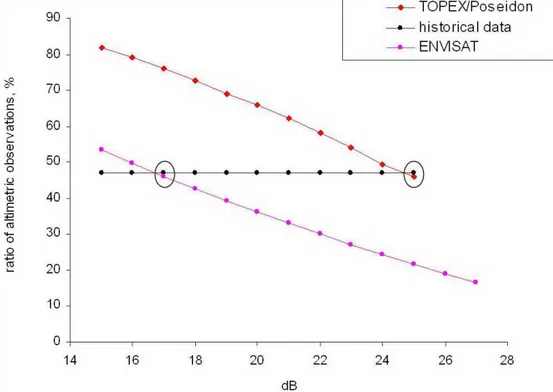
in the multi-year section for each season, reflecting the space-time moistening (flooding) dynamics of the study area. A threshold value of backscatter coefficient (BSC) should be preset for differentiation of flooded and water-free surfaces. Therefore, in the general case an individual value of this criterion should be selected experimentally for each watershed.
We used some cartographic data for more objective estimation of the BSC threshold value: different BSC values were set, and then corresponding minimum flooding coefficients
were calculated for the driest summer season (from July to September). The latter values were compared with available data on hydrographic characteristics of watersheds (percentage of lakes + percentage of swamps) taken from the monographs (“Surface Water Resources in USSR”, 1971-1975, and “The Hydrology of Water-Logged Areas…”, 2009), as well as the vegetation map of the West Siberian Plain (1976), which reflect a relative area of permanently moistened lands on a watershed. As a result of comparison, the BSC threshold value is selected (within a range from 15 to 27 dB) in such a way to best match the cartographic data (fig. 5).
Figure 5 – Flooding coefficient (%) and its threshold values (dB) for the Vakh river
Chapter 3. Analysis of spatial and temporal variability of climate and flooding of the West Siberian watersheds
Numerous studies devoted to investigation of climate changes in Siberia have shown that these changes are unevenly distributed across the territory and form specific regions (”hot points”), where rapid climate warming is observed (Gordov, 2007).
Liner trend analysis of air temperature and precipitation data
This section is devoted to investigation of the time dynamics of air temperature and total atmospheric precipitation (average annual and seasonal) in the area of study river basins (21 watersheds) of the Western Siberia according to the data of meteorological stations and ERA-40 model reanalysis. Quality of the reanalysis data is also discussed. Reanalysis makes it possible to transform observation data that are irregular in time and space into grid global fields covering several decades. Reliability of reanalysis data is known to be unequal for different
meteorological values. Systematic errors are often inherent to them (Kalnay, 2003). Quality of reanalysis data also depend on density of an observation network. Despite a number of limitations (Cullather et al., 2000), reanalysis data are valuable information sources, even for analysis of precipitation and evaporation that are simulated less precisely than air temperature.
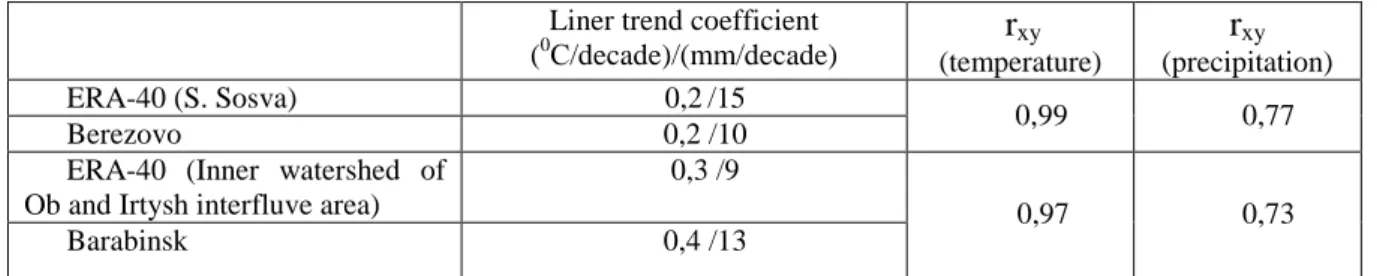
We compared the reanalysis data with the observation results from Berezovo and Barabinsk stations in order to assess quality of ERA-40 reanalysis data for analysis of main climatic variables (air temperature and precipitation). The analysis of air temperature and precipitation trends for 1958-2001 in the study watersheds has shown the good matching of meteorological station data and reanalysis data (Table 1).
Table 1 – Liner trends coefficients and its correlations between ERA-40 and meteorological stations data of air temperature and precipitation (1958-2001)
Liner trend coefficient (0С/decade)/(mm/decade) rxy (temperature) rxy (precipitation) ERA-40 (S. Sosva) 0,2/15 Berezovo 0,2 /10 0,99 0,77
ERA-40 (Inner watershed of Ob and Irtysh interfluve area)
0,3 /9
Barabinsk 0,4 /13
0,97 0,73
The analysis of the air temperature and atmospheric precipitation data of meteostations data for Berezovo (1936-2005) and Barabinsk (1926-2005) as well as ERA-40 data (1958-2001) showed the following results: The greatest warming is observed in the northern part of the West Siberian Plain, which is suggested by linear trend coefficients (0,35-0,37°C/decade). A significant increase in precipitation is observed in the Trans-Ural Region (Severnaya Sosva, Konda, Tavda, Tura), in the Surgut Polesie (Nazym and Vakh) and in the northern part of the plain (Taz river basin) (Table 2).
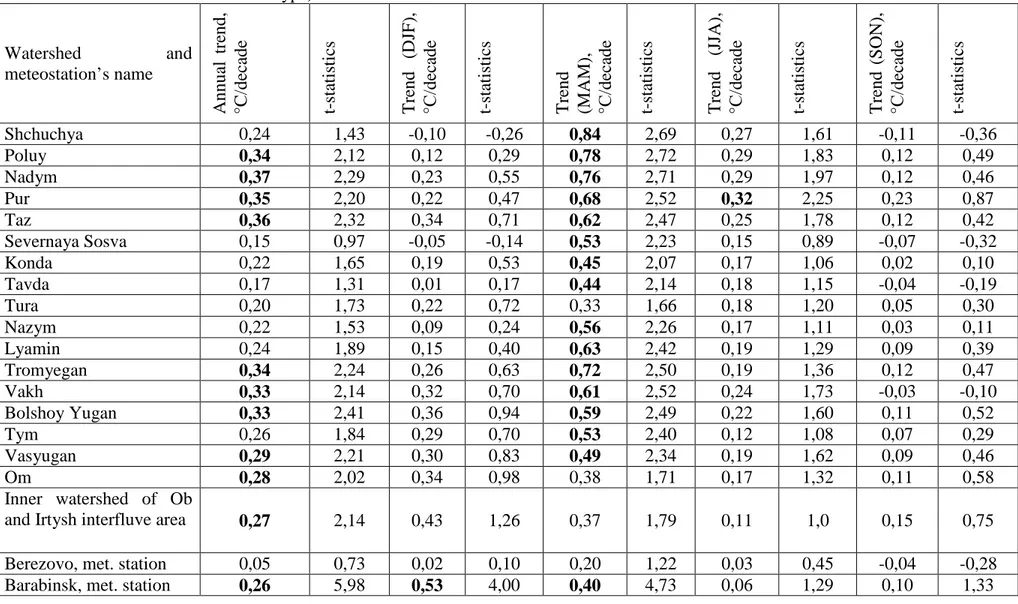
We analyzed seasons of the year (winter: December-February; spring: March-May; summer: June-August; autumn: September-November) and calculated their trends to determine the contribution of each month in the annual time series. The analysis has shown that the highest increase in air temperature in watersheds is observed in the spring season with significant linear trend coefficients from 0,40 to 0,84°C/decade, as well as in the Barabinsk station. The greatest warming is observed in the north of the plain – in watersheds of Shchuchya, Poluy, Nadym and Tromyegan rivers with linear trend coefficients from 0,72 to 0,84°C/10 years (Table 3). In general, a significant increase in spring temperatures was confirmed for 16 watersheds, including the Barabinsk station. The obtained data on air temperature are confirmed by the studies of several authors (Frey and Smith, 2003; Gordov, 2007), who estimated air temperature and
precipitation in the West Siberia according to data from meteorological stations (1958-1999) and ERA-40 model reanalysis (1958-2000). An increase in winter temperatures is significant only for the Barabinsk station with the linear trend coefficient of 0,53°C/decade. A change in air temperature in summer and autumn seasons turned to be insignificant except Taz river basin with the increase liner trend of 0,32°C/decade.
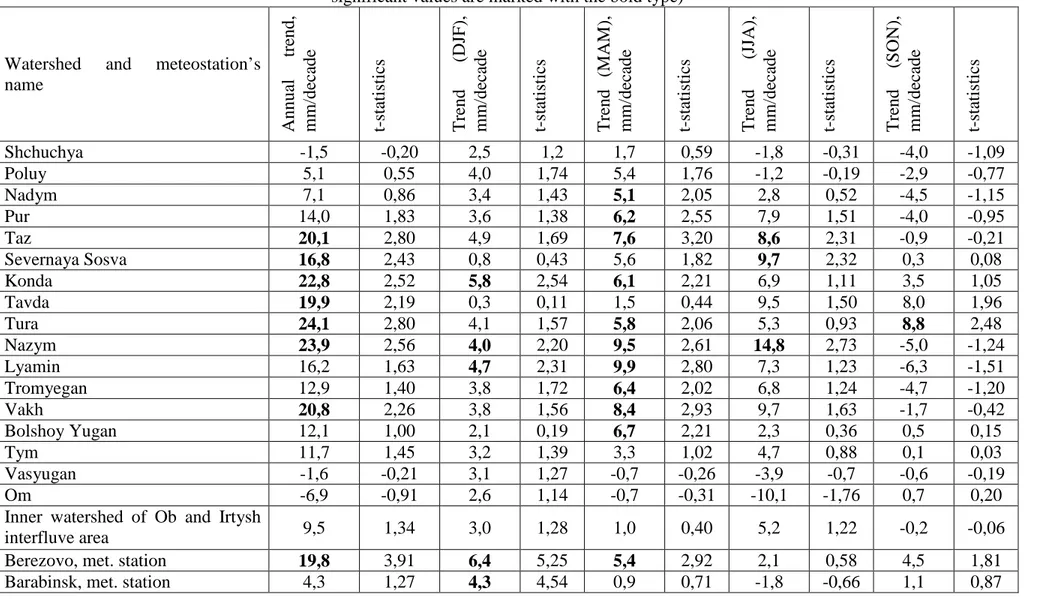
The analysis of precipitation trends has shown a growth of precipitation at a rate of 4,0– 6,4 mm/decade in the winter season in watersheds of Konda, Nazym, Lyamin rivers, as well as in Berezovo and Barabinsk stations. In the spring season a significant increase is observed in watersheds of Nadym, Pur, Taz, Konda, Nazym, Lyamin, Tura, Vakh, Tromyegan, Bolshoy Yugan rivers and in the Berezovo station (5,1-9.9 mm/decade). In the summer season the significance of the trends was confirmed only in watersheds of Taz, Severnaya Sosva and Nazym (8,6-14,8 mm/decade). The autumn seasons makes the lowest contribution in the seasonal distribution of precipitation, with a significant increase in the watershed of the Tura river (8,8 mm/decade).
A significant increase in spring temperatures results in earlier snow melting and the long vegetation period, while a significant increase in atmospheric precipitation leads to higher flooding of territories in different natural zones (despite an increase in air temperatures and evaporation rates). Flooding of the territory depends on the relationship between water balance elements (precipitation, evaporation, drainage). The mechanism of flowing excessive moisture into the river network, being a natural drainage of the area (Ivanov, 1957), should be also taken into account. Therefore, the effect on change in precipitation on change in the flooded zones is difficult to be traced only with ground-based observations. Moreover, the most areas are inaccessible due to high swamping, and this even more complicates the solution of this task. That is why we used the satellite altimetry method for study watersheds.
Figure – 6 Map of liner trends coefficients of annual air temperature (on the left) and precipitation (on the right)
Table 1 – Annual and seasonal estimated decadal trends in surface air temperature and Student’s test statistics (significance level: α = 0,05, statistically significant values are marked with the bold type)
Watershed and meteostation’s name A nnua l tr end, °C /de ca de t-st at is ti cs T re nd (D JF ), °С /de ca de t-st at is ti cs T re nd (M A M ), °С /de ca de t-st at is ti cs T re nd (J JA ), °С /de ca de t-st at is ti cs T re nd (S O N ), °С /de ca de t-st at is ti cs Shchuchya 0,24 1,43 -0,10 -0,26 0,84 2,69 0,27 1,61 -0,11 -0,36 Poluy 0,34 2,12 0,12 0,29 0,78 2,72 0,29 1,83 0,12 0,49 Nadym 0,37 2,29 0,23 0,55 0,76 2,71 0,29 1,97 0,12 0,46 Pur 0,35 2,20 0,22 0,47 0,68 2,52 0,32 2,25 0,23 0,87 Taz 0,36 2,32 0,34 0,71 0,62 2,47 0,25 1,78 0,12 0,42 Severnaya Sosva 0,15 0,97 -0,05 -0,14 0,53 2,23 0,15 0,89 -0,07 -0,32 Konda 0,22 1,65 0,19 0,53 0,45 2,07 0,17 1,06 0,02 0,10 Tavda 0,17 1,31 0,01 0,17 0,44 2,14 0,18 1,15 -0,04 -0,19 Tura 0,20 1,73 0,22 0,72 0,33 1,66 0,18 1,20 0,05 0,30 Nazym 0,22 1,53 0,09 0,24 0,56 2,26 0,17 1,11 0,03 0,11 Lyamin 0,24 1,89 0,15 0,40 0,63 2,42 0,19 1,29 0,09 0,39 Tromyegan 0,34 2,24 0,26 0,63 0,72 2,50 0,19 1,36 0,12 0,47 Vakh 0,33 2,14 0,32 0,70 0,61 2,52 0,24 1,73 -0,03 -0,10 Bolshoy Yugan 0,33 2,41 0,36 0,94 0,59 2,49 0,22 1,60 0,11 0,52 Tym 0,26 1,84 0,29 0,70 0,53 2,40 0,12 1,08 0,07 0,29 Vasyugan 0,29 2,21 0,30 0,83 0,49 2,34 0,19 1,62 0,09 0,46 Om 0,28 2,02 0,34 0,98 0,38 1,71 0,17 1,32 0,11 0,58 Inner watershed of Ob
and Irtysh interfluve area 0,27 2,14 0,43 1,26 0,37 1,79 0,11 1,0 0,15 0,75 Berezovo, met. station 0,05 0,73 0,02 0,10 0,20 1,22 0,03 0,45 -0,04 -0,28 Barabinsk, met. station 0,26 5,98 0,53 4,00 0,40 4,73 0,06 1,29 0,10 1,33
Table 2 – Annual and seasonal estimated decadal trends in precipitation and Student’s test statistics (significance level: α = 0,05, statistically significant values are marked with the bold type)
Watershed and meteostation’s name A nnua l tr end, m m /de ca de t-st at is ti cs T re nd (D JF ), m m /de ca de t-st at is ti cs T re nd (M A M ), m m /de ca de t-st at is ti cs T re nd (J JA ), m m /de ca de t-st at is ti cs T re nd (S O N ), m m /de ca de t-st at is ti cs Shchuchya -1,5 -0,20 2,5 1,2 1,7 0,59 -1,8 -0,31 -4,0 -1,09 Poluy 5,1 0,55 4,0 1,74 5,4 1,76 -1,2 -0,19 -2,9 -0,77 Nadym 7,1 0,86 3,4 1,43 5,1 2,05 2,8 0,52 -4,5 -1,15 Pur 14,0 1,83 3,6 1,38 6,2 2,55 7,9 1,51 -4,0 -0,95 Taz 20,1 2,80 4,9 1,69 7,6 3,20 8,6 2,31 -0,9 -0,21 Severnaya Sosva 16,8 2,43 0,8 0,43 5,6 1,82 9,7 2,32 0,3 0,08 Konda 22,8 2,52 5,8 2,54 6,1 2,21 6,9 1,11 3,5 1,05 Tavda 19,9 2,19 0,3 0,11 1,5 0,44 9,5 1,50 8,0 1,96 Tura 24,1 2,80 4,1 1,57 5,8 2,06 5,3 0,93 8,8 2,48 Nazym 23,9 2,56 4,0 2,20 9,5 2,61 14,8 2,73 -5,0 -1,24 Lyamin 16,2 1,63 4,7 2,31 9,9 2,80 7,3 1,23 -6,3 -1,51 Tromyegan 12,9 1,40 3,8 1,72 6,4 2,02 6,8 1,24 -4,7 -1,20 Vakh 20,8 2,26 3,8 1,56 8,4 2,93 9,7 1,63 -1,7 -0,42 Bolshoy Yugan 12,1 1,00 2,1 0,19 6,7 2,21 2,3 0,36 0,5 0,15 Tym 11,7 1,45 3,2 1,39 3,3 1,02 4,7 0,88 0,1 0,03 Vasyugan -1,6 -0,21 3,1 1,27 -0,7 -0,26 -3,9 -0,7 -0,6 -0,19 Om -6,9 -0,91 2,6 1,14 -0,7 -0,31 -10,1 -1,76 0,7 0,20
Inner watershed of Ob and Irtysh
interfluve area 9,5 1,34 3,0 1,28 1,0 0,40 5,2 1,22 -0,2 -0,06
Berezovo, met. station 19,8 3,91 6,4 5,25 5,4 2,92 2,1 0,58 4,5 1,81 Barabinsk, met. station 4,3 1,27 4,3 4,54 0,9 0,71 -1,8 -0,66 1,1 0,87
Temporal variability of flooded zones from satellite altimetry
Time variability in flooding of river basins was analyzed using the data from satellite altimeters TOPEX/Poseidon and ENVISAT.
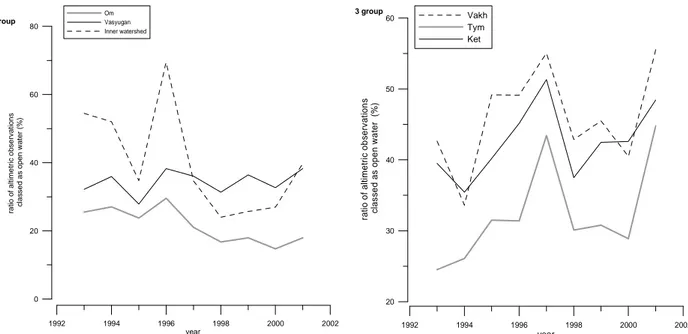
The river basins were classified by interannual dynamics of minimum flooding coefficients for the summer period, which reflects the natural modes of river watersheds. For example, the river classification proposed by V.A. Zemtsov (2003) is based on the similarity of annual and monthly discharge pattern. It is noted in this study that there are wide "neutral" bands with the transient mode of fluctuations between the identified clusters or cores. As a result of the performed analysis using the satellite altimetry results, the author of this thesis identified four geographical regions on the basis of the visual analysis. The first of them includes the central part of the Ob-Irtysh interfluve area (basins of Om and Vasyugan rivers) and its inner watershed area. The second region includes the Trans-Ural region and the northern part of the Ob-Irtysh interfluve area (basins of Severnaya Sosva, Konda, Tavda, Tura and Bolshoy Yugan). 2 subgroups are identified in this group of rivers: а) Severnaya Sosva, Konda, Tavda; b) Tura and Bolshoy Yugan. The third region includes the rivers of the Ob-Yenisei interfluve area (basins of Vakh, Tym and Ket rivers). The fourth region comprises the rivers of the Surgut Polesie, as well as the rivers flowing to the north of the Siberian Ridges (basins of Nazym, Lyamin, Pim, Tromyegan, Kazym, Taz, Pur, Nadym, Poluy rivers). 4 subgroups of river watersheds were identified: a) Pur, Nadym, Kazym; b) Poluy, Taz; c) Tromyegan, Pim; d) Lyamin, Nazym. Our classification of study watersheds by similarity of interannual dynamics of seasonal flooding coefficient matches well with the V.A. Zemtsov's classification (2003). The comparison of both classifications has shown that the data for the central part of the Ob-Irtysh interfluve area (except for the watershed of the Vasyugan river), the Trans-Ural Region and the northern part of the Ob-Irtysh interfluve area, the Surgut Polesie and the rivers flowing to the north of Siberian Ridges coincide with each other. For the last group we presented the more detailed division of river watersheds into subgroups. An example of watershed grouping is presented in Figure 7.
The thesis considers the consistency between precipitation data from ERA–40 model reanalysis with the data from TOPEX/Poseidon altimeter. Pair linear correlation indexes and their standard errors were calculated for all study watersheds in order to reveal a statistical relationship between minimum flooding extent in the summer period and total precipitation for the same period. Several watersheds with significant correlation indexes were identified, at a given significant level α = 0,05: Severnaya Sosva (rxy = 0,79), Tym (rxy = 0,90), Om (rxy = 0,93),
Vasyugan (rxy = 0,73), Poluy (rxy = 0,77). Therefore, we can suppose that flooding of the area
1992 1994 1996 1998 2000 2002 year 0 20 40 60 80 ra ti o o f a lt im e tr ic o b s e rv a ti o n s c la s s e d a s o p e n w a te r (% ) Om Vasyugan Inner watershed 1 group 1992 1994 1996 1998 2000 2002 year 20 30 40 50 60 ra ti o o f a lt im e tr ic o b s e rv a ti o n s c la s s e d a s o p e n w a te r ( % ) Vakh Tym Ket 3 group
Figure 7 – Groups of watersheds for interannual dynamics of flooding coefficient
The identified relationship between flooding and precipitation of the summer period for a number of watersheds shows a good representativity of the altimetry data. The data from satellite altimeter TOPEX/Poseidon cover only the 8-year period and do not allow identifying significant trends due to a small length of series. The only exception is the watershed of the Om river and inner watershed of the Ob-Irtysh interfluve area. Only one reliable prediction can be reasonably made: both fluctuations and directional changes in flooding will continue. Based on such assumptions, the satellite altimetry method can be used for estimation of flooding dynamics for complex areas (swamps, water-logged areas etc.).
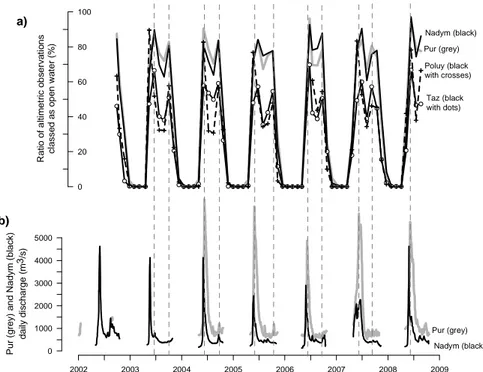
We estimated the variability in water flooding (2003-2008) of all study river basins with ENVISAT satellite. At the first stage we dealt with the river basins located in the north of West Siberia: Poluy, Nadym, Pur, and Taz (PNPT). A BSC threshold value was set at 20 dB. The obtained results were graphically presented in Fig. 8. They reflect the variability in water flooding of PNPT area, which is characterized by two annual peaks: spring and autumn, with a minimum between them. In winter, when the area is covered with snow, the coefficient is equal to zero. The first maximum related to spring flood that usually occurs in June, with flooding coefficient value up to 85% for all rivers, except for Taz (66%). Low flooding percentage of the Taz river basin is likely to be associated with a more dissected relief within the Taz Upland, where flooding conditions are less favorable.
The second minimum is related to the autumn floods observed in September, also with high flooding coefficients: up to 81% for Nadym, 79% for Pur, 56% for Poluy and 52% for Taz. It should be noted that spring and summer-autumn periods are characterized by almost equal high values, although water content of rivers is significantly lower in the period of summer-spring floods as compared with high-water level. It is explained by the fact that even an
insignificant increase in difference in precipitation results in significant flooding of the surface and higher soil moisture. Therefore, highly flooded surface is registered by the satellite altimeter almost as water surface at a selected BSC threshold value.
The summer minimum for all rivers is observed in August: the coefficient value is equal to 35% for Poluy, 68% for Nadym, 70% for Pur and 42% for Taz. Thus, the satellite altimetry enables to estimate a value and variability of flooded and water-logged areas in PNPT watersheds. Water is partly used as surface and groundwater flow and partly evaporates. Climate warming may intensify these processes.
2002 2003 2004 2005 2006 2007 2008 2009 0 20 40 60 80 100 Ra ti o o f a lt im e tr ic o b s e rv a ti o n s c la s s e d a s o p e n wa te r (% ) 0 1000 2000 3000 4000 5000 P u r (g re y ) a n d Na d y m ( b la c k ) d a ily d is c h a rg e ( m 3/s ) a) b) Pur (grey) Nadym (black) Poluy (black with crosses) Taz (black with dots) Nadym (black) Pur (grey)
Figure 8 – Temporal variability of (a) flooded area (% of ENVISAT altimetric observations classed as open water) and (b) daily river discharge for Pur at Samburg and Nadym at Nadym (m3/s). Timing of spring and autumnal maximas of flooded area is shown as grey dashed lines (Zakharova et al., 2009)
Further, we proposed the classification of 21 watersheds based on the seasonal dynamics of flooding coefficient at a threshold value of 20 dB (Zakharova et al., 2009). As a result of this analysis, we identified 3 watershed groups of interannual and seasonal (January-December) variability (Table 4).
Table 4 – Watershed types of seasonal and interannual variability from ENVISAT (Zakharova et al., 2009)
Groups and description of watersheds
I. Small permanent flooding with one peak cycle and clear drying: Inner watershed of Ob and Irtysh interfluve area, Om, Tavda, Severnaya Sosva, Tura, Vasyugan.
Ia. Small permanent flooding with two peaks cycle and clear drying: Ket, Tym, Bolshoy Yugan and Konda.
II. High permanent flooding with insignificant draining: Tromyegan, Pim, Lyamin, Nazym, Shchuchya.
III. Medium permanent flooding with two peaks cycle and well pronounced draining: Vakh, Kazym, Taz, Poluy, Pur, Nadym.
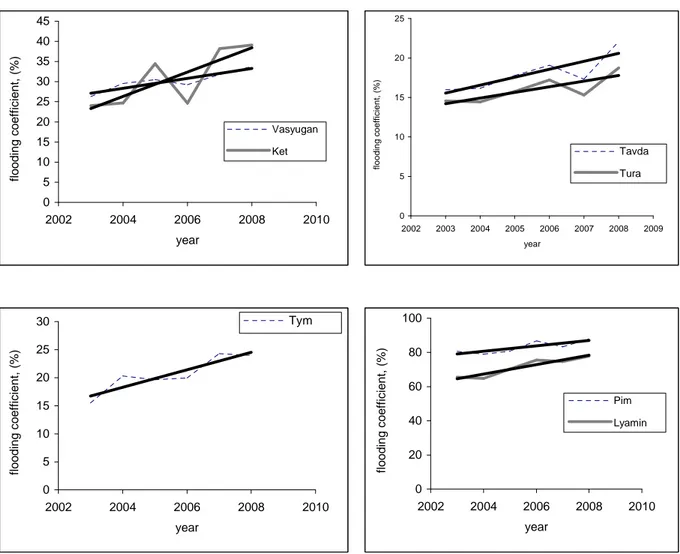
Since the threshold value depends on type of landscape, we selected an individual value of this criterion for each watershed. In general, the threshold value for northern watersheds remained unchanged (20 dB), except for the watersheds located in the Trans-Ural Region, the central part of the Ob-Irtysh interfluve area and its inner watershed area, as well as in the Surgut Polesie. As a result of the performed analysis, we also identified four geographical regions, which generally coincide with the regions identified on the basis of T/P satellite. A gradual increase in flooding is observed in each geographical region: 1. in watersheds of Vasyugan and Ket rivers, 2. Tura and Tavda, 3. Tym, 4. Pim and Lyamin (fig. 7).
0 5 10 15 20 25 30 35 40 45 2002 2004 2006 2008 2010 year fl o o d in g c o e ff ic ie n t, ( % ) Vasyugan Ket 0 5 10 15 20 25 2002 2003 2004 2005 2006 2007 2008 2009 year fl o o d in g c o e ff ic ie n t, ( % ) Tavda Tura 0 5 10 15 20 25 30 2002 2004 2006 2008 2010 year fl o o d in g c o e ff ic ie n t, ( % ) Tym 0 20 40 60 80 100 2002 2004 2006 2008 2010 year fl o o d in g c o e ff ic ie n t, ( % ) Pim Lyamin
Despite an increase in flooding in each geographical region for the 5-year period, it is rather difficult to predict a direction, in which flooding of the area will be changing. Therefore, this problem can be further solved by using a number of new satellite altimetry missions that enable to increase length of time series.
Figure 7 – Interannual inundation variability of basins of Vasyugan, Ket, Tavda, Tura, Tym, Pim,
Conclusions and perspectives:
1. Changes in air temperature and total precipitation in river basins located in different hydrologic-climatic and swamp zones were analyzed on the basis of data from meteorological stations and model reanalysis. In particular, the analysis of average annual precipitation data (1926-2005) shows that the greatest warming is observed in the northern part of the plain in watersheds of Nadym and Taz rivers (0,37°С/decade). A significant increase in total precipitation is observed in the Trans-Ural Region (Severnaya Sosva, Konda, Tavda, Tura rivers) and in watersheds of Taz, Nazym and Vakh rivers. A trend to increase in total precipitation is observed throughout the area of the plain, except for watersheds of Vasyugan and Om rivers that are characterized by negative trends.
2. The analysis of data on seasonal fluctuations of air temperature and total precipitation has revealed the following:
• A significant increase in air temperatures is observed in the spring period (March-May) with the greatest warming in the north of the plains, as well as in the Barabinsk station (0,40 to 0,84°C/decade).
• A significant increase in total atmospheric precipitation is observed in winter, spring and summer seasons. However, in the spring season a significant increase in precipitation is observed in most watersheds located in each hydrologic-climatic and swamp zone.
Changes in air temperature and total precipitation result in a change of flooded areas. It will be estimated using the satellite altimetry method.
3. The satellite altimetry method enabled to estimate a value and interannual/seasonal variability of flooding extent for watersheds of the Ob basin rivers.
4. A threshold backscatter coefficient (BSC) was determined for each watershed using TOPEX/Poseidon and ENVISAT satellites in order to estimate changes in flooding coefficient of study watersheds in the summer season and within-year variability of this parameter by season.
5. Based on the data from TOPEX/Poseidon satellite, the classification of river basins interannual dynamics of the minimum summer flooding coefficient was proposed, with identification of four geographical areas. This classification matches well with V.A. Zemtsov's classification (2003) based on similarity between the interannual variability and monthly river discharge.
6. Several groups of watersheds, for which interannual variability in flooding level based on the data from TOPEX/Poseidon satellite matches well with total precipitation data based on the model reanalysis from 1993 to 2001.
8. It has been found that a significant decrease in flooding (TOPEX/Poseidon) with time is observed in the inner watershed of the Ob-Irtysh interfluve area and in the watershed of the Om river.
8 Using the data from ENVISAT satellite, the watersheds were classified by interannual dynamics of the flooding coefficient and 4 geographical areas were identified too. In general, they coincided with the areas identified on the basis of the data from TOPEX/Poseidon satellite. An increase in flooding was identified in watersheds of rivers in the Trans-Ural Region, the Surgut Polesie, the Ob-Yenisei interfluve area, as well as in the watershed of the Vasyugan river.
In general, the performed studies show the representativity of the satellite altimetry data as related to flooding level of river watersheds and its space-time variability.
Prospects of the further research. The further research will be aimed at adjusting BSC threshold values for differentiation of landscapes with different flooding and underflooding levels, as well as at studying flooding dynamics by season and for a long-term period.
PUBLICATIONS
1. M.V. Kolmakova, E.A. Zakharova, A.V. Kouraev, V.A. Zemtsov, S.N. Kirpotin. Temporal Variability of climate, flooded and wet zones in the Western Siberia from data stations, atmospheric reanalysis and satellite altimetry // Vestnik of Tomsk State University. – 2012. – № 364. – PP. 173-180 (In Russian with an abstract in English).
2. E.A. Zakharova, A.V. Kouraev, S. Biancamaria, M.V. Kolmakova, N.M. Mognard, V.A. Zemtsov, S.N. Kirpotin, B. Decharme. Snow cover and spring flood flow in the northern part of the Western Siberia (The Poluy, Nadym, Pur and Taz rivers). Journal of Hydrometeorology. 2011. – Vol. 12 (6). – P. 1498-1511.
3. Zakharova, E.A., Kouraev, A.V., Kolmakova, M., Mognard, N.M., Zemtsov V.A., Kirpotin S.N. 2009. The modern hydrological regime of the Northern Western Siberia from in situ and satellite observations. International Journal of Environmental Studies. Vol.66, No 4, 447-463.
4. Kolmakova M.V, Kouraev A.V., Zakharova E.A., Kirpotin S.N., Zemtsov V.A., Mognard N.M. Spatial and temporal variability of hydrological regime and water quality in the cryolithozone of Western Siberia // Fundamental problems of water and water resources. –2010. – P. 141-145.
5. Kirpotin S., Polishchuk Yu., Zakharova E., Shirokova L., Pokrovsky O., Kolmakova M., Dupre B. One of Possible Mechanisms of Thermokarst Lakes Drainage in West-Siberian North. International Journal of Environmental Studies. – 2008. – Vol. 65, No 5. – PP. 631-635.
6. Kirpotin S., Berezin A., Bazanov V., Polishchuk Y., Vorobiov S., Mironycheva-Tokoreva N., Kosykh N., Volkova I., Dupre B., Pokrovsky O., Kouraev A., Zakharova E., Shirokova L., Mognard N., Biancamaria S., Viers J., Kolmakova M. Western Siberia wetlands as indicator and regulator of climate change on the global scale. International Journal of Environmental Studies. – 2009. – Vol.66, No 4. – PP. 409-421.
Оглавление Résumé ...3 Abstract...8 Введение ...30 Глава 1. Общая характеристика территории...35 1.1. Физико-географические факторы, определяющие развитие Западно-Сибирской равнины ...35 1.1.1. Орографическая характеристика равнины...35 1.1.2. Современный период формирования рельефа равнины...37 1.1.3. Болотообразовательный процесс как один из основных факторов формирования современного облика Западно-Сибирской равнины...40 1.2. Особенности климата Западно-Сибирской равнины ...41 1.3. Гидрография...45 1.3.1. Болотная гидрографическая сеть и ее характеристика...46 1.3.2. Озерность равнины...49 1.4. Ландшафты...50 Глава 2. Методология исследования ...57 2.1. Методы исследования ...57 2.2. Методы наблюдений и измерений...61 2.2.1. Модельный реанализ...61 2.2.2. Краткий обзор методов дистанционного зондирования Земли (ДЗЗ)...63 2.3. Методы обработки и анализа информации...75 2.4. Объекты исследования...76 2.5. Исходные материалы, используемые в работе ...76 2.5.1. Данные метеорологических станций и модельного реанализа...76 2.5.2. Данные космического зондирования...77 Глава 3. Анализ пространственно-временной изменчивости климата и обводненности речных бассейнов Западной Сибири ...83 3.1. Современные тенденции изменения климата...83 3.2. Анализ трендов многолетних и сезонных изменений температуры воздуха и атмосферных осадков (1926-2005 гг.) по данным метеорологических станций и модельного реанализа ERA-40 ...86 3.3. Временная изменчивость обводненности речных бассейнов Западно-Сибирской равнины по данным спутниковой альтиметрии (TOPEX/Poseidon, ENVISAT)...97 3.3.1. Режим обводненности водосборов по наблюдениям спутника TOPEX/Poseidon ...97 3.3.2. Классификация водосборов по характеру межгодового хода коэффициента обводненности по данным спутника ENVISAT ...102 Заключение...109 Литература ...111 Приложение 1...123 Таблица 1. Краткая классификация методов дистанционного зондирования Земли ...123 Приложение 2...125 Таблица 2. Основные термины по методам ДДЗ, используемые в работе ...125 Приложение 3...128 Рисунок 1. Типы водосборов по данным спутника TOPEX/Poseidon и модельного реанализа ...128 Приложение 4...131 Рисунок 2. Типы водосборов по сезонной изменчивости по данным спутника ENVISAT ...131