AXIAL IMPELLER SELECTION FOR ANCHORAGE DEPENDENT
ANIMAL CELL CULTURE IN STIRRED BIOREACTORS:
METHODOLOGY BASED ON THE IMPELLER COMPARISON AT
JUST-SUSPENDED SPEED OF ROTATION
Marie-Laure Collignona, b,1, Angélique Delafossea, b, Michel Crinea, b, Dominique Toyea a
Laboratory of Chemical Engineering, University of Liège, Sart-Tilman, B6, B4000 Liège, Belgium
b
F.R.S.-FNRS, Rue d’Egmont 5, B1000 Bruxelles, Belgium
Abstract
Animal cells, which are nowadays essential for the industrial production of proteinic compounds, are commonly cultivated inside stirred tank bioreactors. In case of anchorage dependent cells, they are usually fixed on microcarriers. The choice of agitation conditions (impeller type, rotational speed…) in this type of process is not an easy task as it has to fulfil three potentially conflicting goals: (1) maintaining microcarriers in complete suspension, (2) homogenizing the culture medium, and (3) limiting mechanical constraints generated by the hydrodynamics on the cells. The aim of this study is to present an original methodology to select the most appropriate axial impeller for this specific application. Seven propellers are preselected on basis of their characteristics available in the literature. Instead of comparing impellers at a given rotational speed or a given power input, they are compared at their respective minimum impeller rotational speed that leads to a complete microcarrier
suspension, i.e. at their respective just-suspended speed Njs. They are then compared at higher rotational speeds N, expressed as multiples of Njs. The impeller classification is based on the intensity of mechanical constraints they produced, evaluated from: (1) the macro-shear rate quantified by the spatial derivative of time average velocity fields measured by P.I.V, (2) the micro-shear rate characterized by the ratio between the microcarrier diameter to the average Kolmogorov scale computed from power input measurements, and (3) the impact of
microcarrier collisions on cells described via the Turbulent Collision Severity index also computed from power input measurements. Results show that the 125 mm diameter TTP impeller (Mixel) and the 150 mm diameter Elephant Ear impeller (Applikon) produce the smallest mechanical constraints at their just-suspended speed (50 rpm and 20 rpm,
1 Corresponding author: Tel: +32 4 366 47 22 – Fax:+32 4 366 28 18
respectively). Moreover, the mechanical constraints they produce increase more slowly with the N/Njs ratio than the mechanical constraints produced by other impellers. These propellers are thus even more advantageous if rotational speeds higher than the just-suspended speed have to be used
Keywords: Hydrodynamics, Stirred tank, Animal cell culture, Particle Image Velocimetry,
Axial impeller, Mechanical constraints.
1. Introduction
Nowadays, the culture of animal cells has become an inescapable step to produce proteinic compounds as, for instance, antiviral vaccines, hormones, enzymes... Some animal cell species must be fixed on a support to grow and divide. They are called anchorage
dependent cells. When the culture medium volume reaches several litres, the animal cells are usually fixed on non-porous beads, so-called microcarriers. The microcarrier diameter ranges around 300 µm, (dp = 300 µm)and these microcarriers are maintained in suspension inside a cylindrical tank stirred by an axial propeller. This solution offers many advantages such as a high growth surface to reactor volume ratio, an easy separation of cells from culture medium, a possible use at any reactor size and very low maintenance steps. But, the optimization of mixing conditions is very complex in this type of process. Indeed, the agitator design, its diameter, its position and its rotational speed have to be chosen to meet two following goals (Varley and Birch, 1999):
• Microcarrier beads must be perfectly suspended in order to make their external surface fully available for the cells development;
• Nutriment concentrations must be homogeneous in the culture medium.
On the other hand, the agitation conditions must not be too severe in order to limit mechanical constraints generated by hydrodynamics, which could be harmful for the cells development. Works conducted these last 20 years by several researchers (Cherry and Papoutsakis, 1988; Chisti, 2000; Croughan and al., 2006; Nienow, 2006; Papoutsakis, 1991; Van der Pol and Tramper, 1998; Wu, 1999….) have highlighted that cells may be damaged either by the air sparging or by the liquid motion. The air sparging in the vessel induces shear rate (1) near the sparger, where bubbles are formed, (2) in bubble wakes due to their rise, (3) near impellers where bubbles are disrupted and coalesce and, (4) at the liquid surface where bubbles burst. Studies have shown that the only significant effect on the growth or viability of the cells
comes from bubble bursting. But, these damages may be strongly reduced by adding a surfactant such as Pluronic F-68, for instance ( Nienow, 2006). The shear rate due to the liquid phase velocity field also takes several forms. Croughan et al. (1989) have shown that large gradients inside the time average velocity field induce damaging macro-shear rate on human diploid fibroblasts FS-4 cells cultivated on microcarriers. They have also highlighted that, in the whole range of eddies characteristic of the turbulent flow, only eddies with a size smaller than 2/3 of microcarrier diameter create high micro-shear rate at cell surface. Finally, collisions between microcarriers and between microcarriers and the tank walls also induce damages on cells fixed at their surface.
The choice of the impeller and its rotational speed has a major impact on the
magnitude of these mechanical constraints. Usually, axial propellers are chosen because they create an effective pumping inside the tank, which favours the suspension of the
microcarriers. They are also claimed to generate smaller shear rate values than radial propellers. Therefore, many researchers have studied and compared flow fields created by several types of axial propellers.
The axial impeller with the simplest design is the 45° pitched blade turbine. Numerous studies (Firoz et al., 2004; Jaworski et al., 2001; Schafer et al., 1998; ….) on the flow pattern developed by this propeller have demonstrated that the presence of trailing vortex structures near blade tips limits its axial flow efficiency. Different geometrical parameters of this propeller have therefore been modified as the impeller blade pitch, the impeller blade width, the shape of the impeller tip blade… to improve its performances. The impact of these modifications on hydrodynamics quantities such as the velocity field, the shear rate distribution, the turbulent kinetic energy distribution, has been studied, among others, by Kumaresan and Joshi (2006), Ranade and Joshi (1989). Beside the 45° pitched blade turbine, companies have created impellers characterised by more complex shapes and designs. The propellers Chemineer HE-3, Prochem Maxflo T, Lightning A310, Lightning A315, Mixel TTP are the most famous models. Numerous comparative studies have highlighted, that for a same circulation flow rate, these impellers need a smaller power input than a pitched blade turbine. (Aubin et al., 2001; Jaworski et al., 1996; Mavros et al., 1998; Wu et al., 2006; Zhou and Kresta, 1996 (a) …). Recently, axial impellers with a high solidity ratio and deep blades, as the Applikon Elephant Ear impeller, are more and more frequently used for the
homogenisation of animal cells bioreactor. Indeed, these impellers are claimed to produce a uniform low shear rate along the blade edge due to their constant radius of curvature. Some
studies have characterized the flow pattern generated by these impellers. Venkat and
Chalmers (1996) have described, using 3D Particle Tracking Velocimetry technique, the flow pattern around the propeller Applikon Elephant Ear in typical agitation conditions used for animal cells cultures. Zhu et al. (2009) have studied the velocity fields, the turbulent kinetic energy distributions and the vorticity fields generated by this impeller on the basis on PIV (Particle Image Velocimetry) measurements performed in up-pumping as well as in down-pumping configuration and in non-aerated as well as in aerated conditions. Finally, Simmons et al. (2007) have compared two high solidity ratio impellers (Haydward Tyler B2 hydrofoil and Applikon Elephant Ear) to a six blade pitched blade turbine at the same rotational speed and in up-pumping mode, using PIV, PLIF (Planar Laser Induced Fluorescence) and input power measurements. From the comparison based on the velocity fields, the mixing time, the power consumption and the turbulent kinetic energy distribution at a given rotational speed, they concluded that there is no proof that high solidity ratio impellers generate less shear rate than conventional pitched blade turbines.
This brief discussion shows that a wide variety of axial impellers are available.
Choosing the most appropriate for maintaining microcarriers in suspension, homogenizing the culture medium and limiting the mechanical constraints is therefore not an easy task and is still a controversial subject.
The aim of the present study is to propose a methodology allowing to select the most appropriate impeller for a given animal cell culture, taking into account the three requirements mentioned before: complete suspension of microcarrier, homogeneous concentration filed, minimum mechanical constraints. To this end, seven impellers were preselected on the basis of mechanical constraints and mixing time they are supposed to generate according to data available in the literature.
As all these impellers have different geometries (shape, diameter) and quite different characteristics, it is difficult to compare them at a given rotational speed or a dissipated power. Therefore, they are compared on the basis of a given performance related to animal cell cultures on microcarriers. As one of the main impeller roles is to maintain microcarriers in suspension in the culture medium to maximize the available surface for the cell adherence and growth, impellers are compared at the minimum impeller rotational speed values required to maintain microcarriers in complete suspension. This rotational speed is named the just-suspended speed Njs.
Firstly, the just-suspended speed Njs has been determined experimentally for each impeller. PIV and input power measurements have then been performed at these just-suspended speeds. Finally, PIV and input power measurements have been realised at higher rotational speeds in order to analyse the evolution of velocity fields and of characteristic quantities such as the macro-shear rate, the micro-shear rate and the impact of microcarrier collisions.
In the paper, results are presented in two successive parts. In the first one, impellers are classified according to the mechanical constraints they generate at their respective just suspended speed and the best candidates are proposed. In the second part, the evolution of the mechanical constraints is studied for each impeller as a function of rotational speeds,
expressed as multiples of Njs, in order to check if the impeller classification proposed at the just-suspended speed may be extrapolated at higher rotational speeds.
2. Materials and methods 2.1 Vessel and impeller geometry
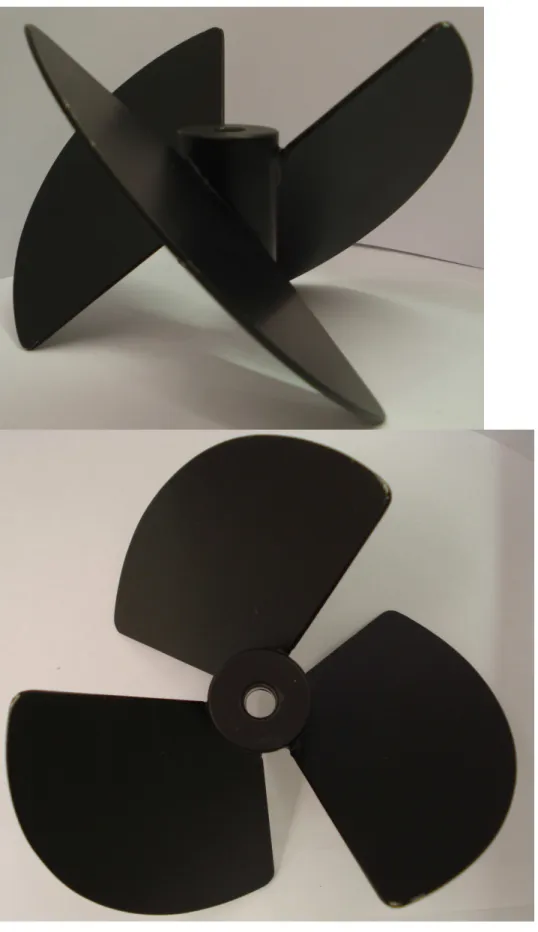
The vessel geometry used in this study is illustrated on Figure1. The transparent cylindrical tank is equipped with a hemispheric bottom and has a volume of 20 litres. The liquid height, H, to tank diameter, T, (T = 0.305 m) ratio equals to 1. Two baffles are placed 180° one from each other on the vessel wall. Their width equals to 1/10 T. The tank is disposed in a cubic container filled with water to limit errors due to optical distortions. The impeller is placed at one third of the liquid height. In this study, seven axial impellers are used: two propellers Mixel TTP (d=0.125 mm, d=0.150 mm), two propellers Lightnin A315 (d=0.125 mm, d=0.150 mm), one propeller Lightnin A310 (d=156 mm), one propeller VMI-Rayneri with 3 streamlined blades (d=160 mm), and one “Elephant Ear” propeller (d=150 mm). In the remainder of this paper, each impeller is referred by a name composed of a prefix corresponding to its model (TTP, A315, A310, 3SB, EE) and of a suffix corresponding to its diameter expressed in millimetres (125, 150, 156, 160). The shape of each impeller is shown on Figure 2. Each impeller turns clockwise so its blades force the fluid to flow downwards. The impeller shaft is rotated by a Heidolf motor (RZR 2102 Control, 100W) which controls the rotational speed with an accuracy of ±1 rpm.
Figure 1 Figure2
2.2 PIV apparatus and parameters
The PIV system used in this study is commercialized by Dantec Dynamics (Denmark). It includes a laser Nd-YAG (New Wave Gemini, 532 nm, 2x30MJ), a Hi/Sense camera
(1280X1024 pixels, 4 Hz) equipped with a Nikon lens (AF Micro Nikkor 60 mm F2.8D), a real-time correlator processor 2500 and the Flowmanager software (version 4.71).
As PIV is an optical technique, the tank and its content must be transparent. As the culture medium is opaque due in particular to the presence of microcarriers, a transparent model fluid with similar rheological properties has to be used for PIV measurements. Rheological measurements were performed on the microcarrier suspension to determine its rheological properties. As predicted by Batchelor (1977) and Einstein (1906), the viscosity of a low solid concentration suspension, as it is the case in this study (<1%), is almost equal to the viscosity of the continuous phase alone. Therefore, water is used as the model fluid to perform PIV measurements.
2D velocity fields are measured by PIV in the vertical plane containing the agitation shaft and placed 45° after the baffle in the rotational direction. The fluid is uniformly seeded by tracer particles made of polyamide 12 resins. Their diameter ranges between 5µm and 35 µm and their density equals 1030 kg.m-3. These particles broadcast visible radiations when they are illuminated by the laser sheet. Their positions are recorded at 4 Hz on 250 images pairs by a camera with an optical axis perpendicular to the laser sheet. The time interval between the two images of a pair is set between 2.25 and 5 ms, depending on the rotational speed of the impeller. An instantaneous velocity field is extracted from each image pair by dividing the two images into interrogations area of 32x32 pixels² with an overlapping of 16 pixels and by applying the cross correlation function in these areas. A time average velocity field is then computed from these 250 instantaneous velocity fields. The spatial resolution of the velocity fields equals 2.6 mm. Only the half right of the vessel is investigated and the flow quantities relative to the whole tank volume are then computed assuming a rotational
2.3 Computation of macro-shear rate field
The macro-shear rate is defined as the velocity gradient in the perpendicular direction to the liquid flow. Its component
γ
RZ can be estimated from the time average velocity field measured in the vertical plane by:r U z UR Z RZ ∂ ∂ + ∂ ∂ = γ (1)
The two others components
γ
Rθ,γ
Zθ computed from equations (2) and (3) respectively, can not be directly estimated from the time average velocity field because the velocitygradients z U ∂ ∂ θ , r U ∂ ∂ θ , θ ∂ ∂UZ , θ ∂
∂UR are situated outside the vertical PIV measurement plane.
∂ ∂ + ∂ ∂ = θ γ θ ϑ R R U r r U r r 1 (2) θ γ θ θ ∂ ∂ + ∂ ∂ = Z Z U r z U 1 , (3)
Nevertheless, the works of Bugay (1998) and Mavros et al. (1996) on the description of 3D velocity fields generated by the propeller A310 and the propeller TTP, respectively, show that the gradients z U ∂ ∂ θ and r U ∂
∂ θ have similar spatial and numerical distributions as the gradients
z UR ∂ ∂ and r UZ ∂
∂ , respectively. Moreover, gradients θ ∂ ∂UZ ,
θ ∂
∂UR are negligible in comparison to
the others, due to the rotational symmetry, except perhaps near the baffles. Therefore, the component
r U z UR Z RZ ∂ ∂ + ∂ ∂ = γ (4)
which may be directly evaluated from the PIV measurements is a good estimate of the spatial and numerical distributions of the macro-shear rate. This quantity is representative of the macro-shear rate prevailing in the stirred tank and may be used to compare the impellers one to each other, which is the aim of this study. But one must be aware that the macro-shear rate component
γ
RZ may not be directly compared to the maximum value of the shear rate that cells may undergo without damage. In this case, all non negligible velocity gradients (z UR ∂ ∂ , r UZ ∂ ∂ , z U ∂ ∂ θ r U ∂
2.4 Power measurements, average Kolmogorov scale and Turbulent Collision Severity Index
The global power dissipated inside the vessel P is evaluated as the product of the measured value of the torque exerted by the impeller on the fluid T’(N.m) and of the rotational impeller speed N’ (rad.s-1).
P=N’.T’ (5)
A calibration procedure is applied to subtract the torque due to frictions inside the motor. The power number of each impeller can be computed by:
5 3 . .N d P Np ρ = (6)
where ρ is the fluid density.
The measurement of the global power dissipated inside the vessel allows computing the average Kolmogorov scale and the Turbulent Collision Severity Index.
As explained in the introduction, micro-eddies may generate micro-shear rate on cell surface if their size is equal or smaller than 2/3 of the microcarrier diameter. In a turbulent flow, the smallest size of micro-eddies is called the “Kolmogorov scale”, which may be evaluated by: 4 / 1 3 = ε ν λ (7)
where ε is the dissipation rate of kinetic energy and ν is the kinematic viscosity. The kinetic energy dissipation rate may be computed at each point inside the tank from instantaneous velocity fields measured by 2D-PIV but the accuracy of the results is still a controversial subject. Firstly, it implies assuming an isotropic turbulence, which remains questionable. Secondly, Baldi et al. (2002) have demonstrated that the spatial resolution of the velocity field must be smaller than the Kolmogorov scale, to avoid a significant
underestimation of the kinetic energy dissipation rate, leading to an overestimation of the Kolmogorov scale. To reach a high enough spatial resolution (~50 µm), PIV measurements should be performed on a small area with a surface smaller than 3 mm² because the number of the camera pixels is limited to 1024 x 1280. Therefore, the measurement of the whole
velocity field inside the half right of the tank would become a very laborious and time consuming task.
As the aim of the present study is to compare impellers rather than to get an accurate value of the local kinetic energy dissipation rate, an estimated value of the average Kolmogorov scale from the global power dissipated inside the vessel has been considered as satisfactory .
4 / 1 3 . / = V P Average ρ ν λ (8)
The Turbulent Collisions Severity Index is a tool defined by Cherry and Papoutsakis (1988) to characterize the collisions between microcarriers and their impact on cells. This index may be described as the product of the frequency of collisions by the kinetic energy during these collisions:
) ( ) / ).(int int ( ion concentrat beads volume frequency eraction eraction of energy kinetic TCS = (9)
If the relative velocity between beads is estimated by the velocity of the smallest eddies in the flow, the TCS can be approximated by:
= 72 . . . . . 4 2 2 3 2 s p sd V P TCS π ρ ε ρ µ (10)
where
ρ
s is the solid phase density, dp is the microcarrier diameter andε
s is the vessel volume fraction occupied by microcarriers. Cherry and Papoutsakis (1988) havedemonstrated that data relative to several animal cell cultures on microcarriers correlate quite well with this approximation of the TCS.
2.5 Choice of the impeller rotational speed
As mentioned in the introduction, the impellers used in the present study have different geometries (shape, diameter) and quite different characteristics. It was decided to compare hydrodynamics induced in the stirred tank by each impeller when working at their respective just-suspended speed Njs. The experimental determination of the minimum rotational speed that leads to a complete suspension of microcarriers, Njs, is based on the criterion first defined by Zwietering (1958), which is still commonly used in the literature, as for instance, in the studies of Ibrahim and Nienow (2004), Myers et al. (1994)…
In the present study, 20 litres of the culture medium containing the microcarriers is placed in the tank. The microcarriers beads are first homogeneously suspended in the liquid medium by mixing the solid-liquid mixture at a high impeller rotational speed (200 rpm). The impeller
rotational speed is then set to a smaller value at which the behaviour of the microcarrier beads on the tank bottom is studied during 45 minutes by visual observation through transparent tank wall . This procedure is repeated until reaching the smaller impeller rotational speed for which microcarriers beads do not stay more than 1-2 seconds on the tank bottom. In this study, Njs is determined with an accuracy of ±1 rpm for each impeller.
PIV and power measurements are then performed for each impeller at their respective just-suspended speed Njs to characterize the velocity field and the mechanical constraints inside the tank. PIV and power measurements are also performed for 5 other rotational speeds: 50 rpm, 67 rpm, 85 rpm, 102 rpm and 120 rpm to quantify how the velocity fields and the mechanical constraints evolve with the rotational impeller speed.
3. Results and discussion
3.1 The impeller comparison at their respective just-suspended speed Njs
The seven impellers are firstly compared at their respective just-suspended speed Njs. Table 1 presents the just-suspended speed Njs values, obtained experimentally for each impeller (column 2) and the corresponding Reynolds number (column 3). The ratio between the volume swept by each impeller and the tank volume (20L) is reported in the 4th column. This table also presents flow field characteristic quantities such as the average and the 90th percentile values of time-average velocity distribution in the PIV measurement plane (columns 5 and 6), the average and 90th percentile values of macro-shear rate distribution (columns 7 and 8), the average Kolmogorov scale in the stirred tank (column 9), the ratio between the microcarrier diameter and the average Kolmogorov scale (column 10) and the Turbulent Collision Severity Index (column 11).
Table 1
When analysing experimental values of the just suspended speed, it may be noticed that all impellers do not have the same suspending capacity. Roughly, they can be classified in three categories. The first category includes the impeller EE 150 which presents a very good suspending capacity as a complete suspension is achieved at a very low rotational speed, equal to 20 rpm. The impellers A310 156, TTP 125, 3SB 160 and A315 125, characterized by a similar just-suspended speed ranging between 49 rpm and 54 rpm, belong to the second category. The last category includes the impellers A315 150 and TTP 150 with a just-suspended speed twice as much as the EE 150 one, but 20% smaller than those of the second
category. These results show that even if the solid suspension characteristics are known (density, concentration, bead size distribution …), the just-suspended speed seems to greatly depend on the impeller pumping performances. It is quite difficult to predict a priori the just-suspended speed. Nevertheless, the 2nd and the 4th columns of table 1 show a possible correlation between Njs (column 2) and the volume swept by the impeller (Swept volume
= d W
4 .
2
Π ) (column 4), expressed as a percentage of the tank volume (20L). This table clearly highlights that propellers with the smallest Njs are characterised by the highest swept volumes (EE 150, TTP 150 and A315 150) while impellers with similar values of Njs have similar swept volumes (TTP 125, A310, MK, A315 125).
PIV measurements show that the velocity fields generated inside the tank by all impellers when they rotate at their respective just-suspended speed exhibit similarities. This similarity is illustrated on Figure 3 which shows the time average velocity fields obtained by P.I.V for each impeller at its just-suspended speed. The background grey level is related to the velocity values (as indicated on the color bar) while the orientation of the velocity vectors is indicated by the black arrows. For all impellers, the velocity values ranges between 0 and 0.10 m.s-1. For each impeller, the hydrodynamic pattern is composed of two recirculation loops sharing the impeller blade discharge stream. These results are in good agreement with literature (Bugay et al., 2002; Mavros et al., 1996; Zhu et al., 2009; …). Although globally similar, the velocity fields present some local differences, as for instance, the angle between the vertical and the velocity vector direction in the impeller blade discharge stream. Values reported in Table 1 confirm the similarity between velocity distribution generated by all the impellers as the average (column 5) and 90th percentile (column 6) values of these distributions are very close one to each other. Therefore, these results highlight similarities of the spatial and numerical distributions of time average velocity fields when each impeller rotates at its respective just suspended speed. Isbrahim and Nienow (1996) mention in their study that suspension of solids in liquid phase is dominated by large macro scale flow. Time average velocity fields measured in the present study are in agreement with this observation as a similar time average macro-scale flow is observed for a given suspension state (here a just-complete suspension). Moreover, this observation is confirmed by the study of Bao and al. (2002). They experimentally demonstrated that, inside a square tank stirred by axial propeller, a same local velocity at the bottom of the tank is observed for a same suspension state of glass beads.
Figure 3
As animal cells are considered, sometimes in an excessive way, to be sensitive to mechanical constraints, the impellers are compared at their respective just-suspended speed on the basis of:
• the macro shear rate distribution evaluated from the derivative of the time average velocity field;
• the micro-shear rate deduced from the average Kolmogorov scale;
• the effect of microcarrier collisions characterised by the Turbulent Collision Severity Index.
To give a complete description of the mechanical rates met by animal cells in a stirred tank bioreactor, mechanical rate created by gas bubbles formation, coalescence, rupture and burst should also be taken into account. But the analysis of these quantities is beyond the scope of the present study. Indeed, they can not be characterized experimentally from measurements performed on the experimental setup used and their prediction is quite risky as they greatly depend on the culture medium composition. Therefore, this complex problem will be considered in an upcoming study.
The
γ
RZ macro-shear rate component is evaluated for each impeller by computing the time average velocity gradient inside the PIV measurement plane according to equation (4). Even if this velocity gradient is relative to a scale which is several orders of magnitude higher than the animal cell size or microcarrier one, Croughan et al.(1989) have demonstrated that a time average velocity gradient higher than 2.5 s-1 may damage human diploid fibroblasts FS-4 cells cultivated on microcarriers. Theγ
RZ component spatial distribution is illustrated on Figure 4 for all impellers rotating at their respective just-suspended speed. The background grey level is relating to the macro-shear rate values (s-1) (as indicated on the colorbar), while arrows indicate the flow direction. In all cases, the highest macro-shear rate values are located at the periphery of the ejection area and near the tank walls, as these areas exhibit the highest velocity gradients. The macro-shear rate is one order of magnitude smaller in the otherregions of the tank. The distribution of macro-shear rate values is characterized by its average and by its 90th percentile values (Table 1, 7th and 8th columns). The impeller classification by increasing values of these two quantities is:
Therefore, at their respective just-suspended speed, the propeller EE 150 creates the smallest macro-shear rate, while the propeller A315 125 generates the highest ones.
Figure 4
As shown by Croughan et al. (1989), human diploid fibroblasts FS-4 cells cultivated on microcarriers are damaged when the size of the smallest eddies inside the turbulent flow (Kolmogorov Scale) is smaller than two-third of the microcarrier size. Given that the average microcarrier diameter equals 300 µm, the threshold value for the Kolmogorov scale should be around 200 µm. The 9th column of Table 1 presents average Kolmogorov scale values
computed for all impellers from global values of power dissipated inside the tank, while the 10th column presents the values of the ratio between the average Kolmogorov scale and the microcarrier diameter. The results show that, for all impellers, the average Kolmogorov scale is close to the threshold value (2/3). But, one must be aware that the Kolmogorov scale is not constant inside the tank as it varies from one point to another. In particular, it is far smaller than the average value in the impeller discharge stream. For instance, Zhou and Kresta
(1996(b)) have shown that the minimum Kolmogorov scale is equal to one third of its average value for the propeller A310. The classification of the impellers by decreasing Kolmogorov scale values is:
TTP 125 > EE 150 > TTP 150 > 3SB 160 > A310 156 > A315 125>A315 150.
This classification indicates that the propeller TTP 125 induces the highest value of the average Kolmogorov scale inside the tank, while the propeller A315 150 produces the smallest one.
Finally, the impellers are classified on the basis of increasing values of the Turbulence Collisions Severity Index (TCS), which characterizes the impact of microcarrier collisions on cells. In their studies, Cherry and Papoutsakis (1988) have analysed how biological properties such as the growth rate or the death rate of cells and the maximum cell concentration evolve according to the TCS index. They showed that the growth rate and the maximum cell
concentration decrease when TCS index is higher than approximately 5.10-13 J.s-1. For a given liquid – solid dispersion (as it is the case in this study), the TCS index only depends on the global power dissipated inside the tank by the propeller (equation 9). The 11th column of Table 1 presents the TCS index values computed for all impellers at their respective just-suspended speed. All values are slightly higher than the threshold value announced by Cherry and Papoustakis (1988), showing a possible negative effect of stirring on cell culture even if
working at this minimal rotational speed. The classifications of the impellers by increasing values of TCS index is:
TTP125 < EE 150 < TTP 50 < A315 125 < 3SB 160< A310 156 < A315 150.
Here again, the propeller TTP 125 produces the smallest TCS index value, while the propeller A315 150 generates the highest one.
From impeller classifications based on an increasing macro-shear rate, a decreasing average Kolmogorov scale and an increasing TCS index, it is clear that propellers TTP125 and EE150 generate the smallest mechanical constraints when they are used at their respective just-suspended speed. Normalised values reported in Table 2 allow a better quantification of this improvement. For each quantity, an average value is computed from results obtained for all impellers at their respective just-suspended speed (2nd row). Values reported in rows 4 to 10 indicate the deviation in percent from this average value. From Table 2, it can be
concluded that propellers EE 150 and TTP 125 generates mechanical constraints significantly smaller than the other tested impellers. They therefore seem to be very well adapted for the mixing of animal cell culture bioreactors. On the other hand, the propellers A315 125 and A315 150 induce mechanical constraints significantly higher than the average and should not be selected for this type of operation. Finally, the propellers TTP 150, A310 156, 3SB 160 may be considered as “in the average” as each of them presents good characteristics for some quantities and less good ones for some other quantities.
Table 2
3.2 Evolution of velocity fields and mechanical constraints as a function of impeller rotational speed
In this second part of the results analysis, the evolution of velocity fields and mechanical constraints produced by each impeller is studied as a function of the impeller rotational speed. This analysis is justified by the fact that, during a cell culture, the impeller rotational speed may be higher than the just-suspended speed. Indeed, as highlighted by Cherry and Papoutsakis (1988), animal cells may attach simultaneously on two microcarriers, leading to aggregates composed of two or more beads. A rotational speed higher than Njs is therefore required to maintain these aggregates in suspension. The impeller rotational speed must also be high enough to ensure a good homogenisation of the liquid medium and a good gas-liquid mass transfer in the bioreactor. It is therefore important to determine how velocity
field and mechanical constraints evolve if the impeller rotational speed is increased. It allows to verify if results obtained at the just-suspended speed may be extrapolated for higher rotational speeds.
To compare the impellers on the same basis, impeller rotational speed values are all expressed as multiples of Njs, which may be justified as follow: Firstly, similar velocity fields have been observed when impellers rotate at their respective just-suspended speed. Secondly, Reynolds numbers presented in table I show that the flow regime is fully turbulent. The structure of the time average velocity field is thus well established. Therefore, for each impeller, if the impeller rotational speed is multiplied by a positive integer, the velocity values in the velocity fields should also be multiplied by this positive integer.
Considering these two observations, one may expect that similar velocity fields are obtained for all impellers working at rotational speeds corresponding to a given value of the ratio N/Njs.
As a consequence, if one has to work at rotational speed higher than Njs, to maintain aggregates of microcarriers in suspension, for instance, a same value of the ratio N/Njs will probably be appropriate for all impellers. The figures 5a and 5b show that the average and 90th percentile values of the time average velocity distribution increase linearly according to the impeller rotational speed expressed as multiples of Njs. This linear evolution confirms that the flow is fully turbulent and that the structure of the time average velocity field is well established. For each rotational speed, a ratio of 2 is observed between the 90th percentile and the average of the time average velocity values. Logically, the same ratio is observed between the slopes of the 90th percentile curve and of the average curve.
Figure 5 Table 3
Similarly to the velocity distribution, the average and 90th percentile values of the macro-shear rate distributions increase linearly with the ratio N/Njs, equal to the impeller rotational speed normalised by the just-suspensed speed, Njs (Figure 6). This linear evolution has already been observed by Oldshue (1983) and Wichterle et al. (1984). The ratio between 90th percentile and the average value of macro-shear rate distribution equals approximately 2.5. Due to the linear evolution of these quantities, this ratio is also observed between the slope of the 90th percentile curve and the slope of the average curve. Oldshue (1983)
observed a similar ratio value, equal to 2 between the maximum time average macro-shear stress and the average value, in the flow generated by a Rushton turbine.
The impellers can be classified in three groups according to increasing values of the slopes of curves on Figure 6 and according to increasing values of the average and of the 90th percentile of the macro shear rate distribution for a given N/Njs value:
• Group 1: impeller EE 150
• Group 2: impellers TTP 125, TTP 150, A310 156. • Group 3: impellers A315 125, A315 150 and 3SB 160
The impeller EE 150 therefore creates the smallest macro-shear rate for all normalised rotational speed values. Moreover, its superiority becomes higher and higher compared to the other impellers if N/Njs is further increased. The propeller TTP 125 also exhibits very interesting characteristics, but they are less noticeable compared to other impellers. Let’s notice that the small values of the curve slopes for the impeller EE 150 are mainly a
consequence of its very small Njs value. Indeed, the average and 90th percentile of the macro-shear rate distribution also evolve linearly with the impeller rotational speed N. The slope of these linear curves, reported in table 4 for all impellers, shows that impeller EE150 exhibit the highest slope.
The linear evolution of the average dand 90th percentile of the macro-shear rate can be represented by the equations:
shear_average=a.N+d (11)
90th_shear= b.N+f (12)
The constant slope of this lines are respectively equal to a and b. Table 4 show that the impeller EE 150 has the highest values of a and b compared to the other impellers.
Nevertheless, when the variable change of N into N/Njs is performed, the slope of the lines is modified according to the following process:
Shear_average=a. Njs Njs N . +d => Shear_average=a’ Njs N + d => a’=a.Njs (13) 90th_shear =b. Njs Njs N . +f => 90th_shear =b’ Njs N + d => b’=b. Njs (14) Therefore, the slope a and b are multiplies by Njs. As the Njs of impeller EE 150 is really smaller than other impellers (20 rpm vs 38 to 54rpm), that explains why the highest value of a and b multiplies by the smallest value of Njs can produce the smallest values of the slopes a’, b’ when N is divided by Njs. Nevertheless, in practice, a smaller value of N will be selected
for impeller EE150 than others impellers during culture of animal cells. That will lead to smaller macro shear rates too as the figure 6 clearly highlights.
Table 4 Figure 6
Figure 7 presents the evolution of the average Kolmogorov scale relative to the
different impellers tested, as a function of the normalized rotational speed N/Njs. As predicted by correlation (6) and by equation (8) the experimental values of the average Kolmogorov scale evolve as N-3/4. To correctly interpret this figure, impellers should be compared at a given value of N/Njs. They should be compared on the basis on their relative position on vertical lines in this figure. Given their relative positions, the propellers TTP125 and EE150 seem to produce the smallest micro-shear rate for a given ratio N/Njs, while the propellers A315 150, 3SB 160 and A315 125 seem to generate the highest one. Nevertheless, the gap between the smallest and the highest values seems to reduce as the ratio N/Njs increases. Indeed, based on vertical lines analysis, the gap between the highest value and the smallest one decreases as N/Njs increases.
Figure 7
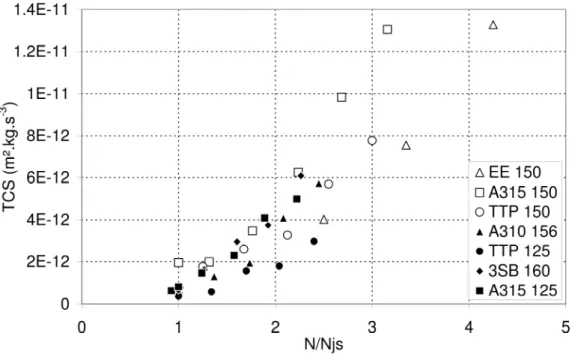
Figure 8 presents the evolution of Turbulence Collision Severity Index of each impeller as a function of the normalized rotational speed N/Njs. As predicted by correlation (6) and by equation (10), the TCS Index follows a power law (N9/4). As the propellers TTP 125 and EE 150 are associated to the smallest TCS index values at each N/Njs ratio value, they seem to produce the smallest impact on cells due to collisions. On the other hand, the impellers A315 125, A315 150 and 3SB 160 induce the highest impact. Figure 8 shows that the gap between the smallest and the highest values of TCS index increases as N/Njs
increases. So, the higher the N/Njs ratio is, the more the use of the propellers TTP 125 or EE 150 is advantageous.
Figure 8
The evolutions, for increasing normalized rotational speeds N/Njs, of quantities characterizing the mechanical rate in the stirred bioreactor (macro-shear rate, Kolmogorov scale, TCS index) confirm the trends observed with the impellers rotating at their respective just-suspended speed. Moreover, the analysis of these evolutions evidences that it is more and more advantageous to use the propellers TTP 125 or EE150, as the N/Njs ratio increases.
4. Conclusion
The aim of this study is to propose a methodology allowing to select the most
appropriate axial propeller to be used inside a bioreactor for the culture of animal cells fixed on microcarriers. Due to this particular application, the three selection criterions are: (1) the possibility to maintain microcarriers in complete suspension, (2) a good homogenisation of culture medium and (3) the limitations of mechanical constraints.
Seven preselected propellers (A310 156, A315 125, A 315 150, EE 150, 3SB 160, TTP 125, TTP 150) have been classified as a function of the intensity of the mechanical constraints they produce, evaluated on the basis of the following quantities:
• the macro-shear rate quantified by the spatial derivative of the time average velocity fields measured by P.I.V. ;
• the micro-shear rate characterized by the comparison of the microcarrier diameter to the average Kolmogorov scale computed from the power input measurement; • the impact of microcarrier collisions on cells described via the Turbulent Collision
Severity index, which may also be computed from the power input measurement. The impeller are first compared at their respective just-suspended speed Njs and then at higher rotational speeds, expressed as multiplies of Njs.
When analysing the just-suspended speeds, Njs, measured experimentally for the different impellers, it appears that the lowest just-suspended speeds are obtained with the impellers with the largest swept volume. In spite of the variety (shape, size, …)of impellers , the velocity fields generated by all impellers at their respective just-suspended speed, are qualitatively (spatial distribution) and quantitatively (range of values) similar, which seems logical as all these flow fields allow to achieve the same performance in terms of
microcarriers suspension.
If the impellers are classified according to their macro-shear rate values, their average Kolmogorov scale values and their TCS index values, it is clearly noticeable that the
propellers TTP125 and EE150 generate the smallest mechanical constraints when the
impellers are compared at their respective just suspended speed as well as at higher rotational speeds. On the other hand, the propellers A315 125 and A315 150 induce the highest
mechanical constraint levels. The mechanicals constraints produced by the propellers TTP 150, A310 156, 3SB 160 lie in between these two extreme values.
The selection methodology proposed in this work is quite original, as it compares mechanical constraints induced by the impellers for a pre-defined performance level in terms of microcarrier suspension, whereas previous studies classically compare impellers at a constant operating parameter, as the rotational speed or the power input. The proposed method leads to the selection of two impellers, EE 150 and TTP 125, which fulfil required suspension and homogenisation performances, while minimising mechanical constraints. Moreover, it can be noticed that this selection methodology highlights the good performance of the impeller EE while the study of Simmons et al. (2007), which compares this impeller to a six blade pitched turbine at the same rotational speed, has concluded the absence of proof that the impeller EE generates less shear rate than conventional pitched blade turbines.
But the proposed methodology still needs further validation, as the optimal rotational speed may be quite different from the just-suspended speed. Indeed, the optimal rotational speed also depends on parameters not considered in the present study and which may evolve during the culture, such as the aggregation of microcarriers or the aeration needs. To take all these parameters into account, the optimal rotational speed has to be determined on the basis of real animal cell cultures.
Notations
d impeller diameter (m) dp microcarrier diameter (m) H liquid height (m)
N impeller rotational speed (rpm) N’ impeller rotational speed (rad.s-1)
Njs just-suspended speed of impeller rotation (rpm) Np power Number (-)
P global power dissipated inside the vessel (W) T tank diameter (m)
T’ torque on the impeller shaft (N.m) TCS turbulent collision severity index (J.s-1) V tank volume (m³)
W blade height (m)
ε dissipation rate of kinetic energy (m2.s-3)
εs solid fraction (% vol.)
λ Kolmogorov scale (m)
µ dynamic viscosity (Pa.s)
ν kinematic viscosity (m2.s-1)
ρ fluid density (kg.m-3)
ρs microcarrier density (kg.m-3)
Acknowledgements
We acknowledge the financial support provided by the FRS-FNRS (National Fund for Scientific Research of Belgium), by the Communauté française de Belgique (Action de Recherche Concertée) and by the company GlaxoSmithkline Biologicals. We kindly thank Sandrine Dessoy and Ludovic Peeters for the information and advice relative to the animal cell culture.
References
1. Aubin, J., Mavros, P., Fletcher, D.F., Xuereb, C., Bertrand, J., 2001. Effect of axial agitator configuration (up-pumping, down-pumping, reverse rotation) on flow patterns generated in stirred vessels. International Symposium on Mixing in Industrial Processes-ISMIP4, 14-16 May 2001, Toulouse, France.
2. Baldi, S., Hann, D., Yianneskis, M., 2002. On the measurement of turbulence energy dissipation in stirred vessels with PIV techniques. Proceedings of the 11th International Symposium on Applied Laser Techniques in Fluid Mechanic, Lisbon, Portugal, July 8-11.
3. Bao, Y., Huang, X., Shi, L., Wang, Y., 2002. Mechanism of off-Bottom suspension of solid particles in a mechanical stirred tank. Chinese Journal of Chemical Engineering 10, 476-479.
4. Batchelor, G.K., 1977. The effect of Brownian motion on the bulk rate in a suspension of spherical particles. Journal of Fluid Mechanics Digital Archive 83, 97-117.
5. Bugay, S., 1998. Analyse locale des échelles caractéristiques du mélange : application de la technique P.I.V. aux cuves agitées. Phd Thesis, INSA Toulouse, France.
6. Bugay, S., Escudié, R., Liné, A., 2002. Experimental analysis of hydrodynamics in axially agitated tank. AICHE Journal 48, 463-474.
7. Cherry, R.S., Papoutsakis, E.T., 1988. Physical-mechanisms of cell-damage in
microcarrier cell-culture bioreactors. Biotechnology and Bioengineering 32, 1001-1014. 8. Chisti, Y., 2000. Animal-cell damage in sparged bioreactors. Trends in Biotechnology 18,
420-432.
9. Croughan, M.S., Hamel, J.F., Wang, D.I.C., 2006. Hydrodynamic effects on animal cells grown in microcarrier cultures. Biotechnology and Bioengineering 95, 295-305.
10. Croughan, M.S., E.S. Sayre, and D.I.C. Wang, 1989. Viscous reduction of turbulence damage in animal-cell culture. Biotechnology and Bioengineering 33, 862-872.
11. Einstein, A, 1906. Eine neue Bestimmung der Moleküldimensionen. Annalen der Physik 324, 289-306.
12. Firoz, R. K., Chris, D.R., Grahan, K.H., 2004. A multi-block approach to obtain angle resolved PIV measurements of the mean flow and turbulence fields in a stirred vessel, Chemical Engineering Technology 27, 264-369.
13. Ibrahim, S., Nienow, A.W., 2004. Suspension of microcarrier for cell culture with axial flow impellers. Chemical Engineering Research and Design 82, 1082-1088
14. Jaworski, Z., Nienow, A.W., Dyster, K.N., 1996. An LDA study of the turbulent flow field in a baffled vessel agitated by an axial, down pumping hydrofoil impeller. Canadian Journal of Chemical Engineering 74, 3-15.
15. Jaworski, Z., Dyster, K.N., Nienow, A.W., 2001. The effect of the size, location and pumping direction of a pitched blade turbine impellers on flow patterns: LDA measurements and CFD predictions, Trans IChemE 79, 887-894.
16. Kumaresan, T., Joshi, J.B., 2006. Effect of impeller design on the flow pattern and mixing in stirred tanks. Chemical Engineering Journal 115, 173-193.
17. Mavros, P., Xuereb, C., Bertrand, 1996. Determination of 3-D Flow Fields in Agitated Vessels by Laser Doppler Velocimetry : Effect of Impeller Type and Liquid Viscosity on Liquid Flow Patterns. Chemical Engineering Research and Design 74, 658-668
18. Mavros, P., Xuereb, C., Bertrand, J., 1998. Determination of 3-D flow fields in agitated vessels by laser Doppler velocimetry: use and interpretation of RMS velocities. Chemical Engineering Research and Design 76, 223-233.
19. Myers, K. J., Fasano, J. B., Corpstein, R.R., 1994. The influence of solid properties on the just-suspended agitation requirements of pitched-blade and high-efficiency impellers. The Canadian Journal of Chemical Engineering 72, 745-748.
20. Nienow, A.W., 2006. Reactor engineering in large scale animal cell culture. Cytotechnology 50, 9-33.
21. Oldshue, J.Y., 1983. Fluid mixing technology. Mc Graw-Hill, New-York.
22. Papoutsakis, E.T., 1991. Fluid-mechanical damage of animal-cells in bioreactors. Trends in Biotechnology 9, 427-437.
23. Ranade, V.V., Joshi, J.B., 1989. Flow generated by a pitched blade turbines. I.
Measurements using laser Doppler anemometer. Chemical Engineering Communication 81, 197-224.
24. Schafer, M., Yianneskis, P., Wachter, P., Durst, F., 1998. Trailing vortices around a 45° pitched blade impeller, AICHE Journal 44, 1233-1265.
25. Simmons, M.J.H., Zhu, H., Bujalski,W., Hewitt,C.J., Nienow, A.W., 2007. Mixing in a model bioreactor using agitators with a high solidity ratio and deep blades. Chemical Engineering Research and Design 85, 551-559.
26. Van der Pol, L., Tramper, J. , 1998. Shear sensitivity of animal cells from a culture medium perspective. Trends in Biotechnology 16, 323-328.
27. Varley, J., Birch, J., 1999. Reactor design for large scale suspension animal cell culture. Cytotechnology 29, 177-205.
28. Venkat, R.V., Chalmers, J.J., 1996. Characterization of agitation environnements in 250 ml spinner vessel, 3L and 20 L reactor vessels used for animal cell microcarrier culture. Cyotechnology 22, 95-102.
29. Wichterle, K., Kadlec, M., Zak, L., Mitschka, P., 1984. Shear rate on turbine impeller blades. Chemical Engineering Communication 26, 25-32.
30. Wu, S., 1999. Influence of hydrodynamic shear rate on macrocarrier-attached cell growth: cell line dependency and surfactant protection. Bioprocess Engineering 21, 201-206. 31. Wu, J., Graham, K.J., Nguyen, B., Mehidi, M.N.N., 2006. Energy efficiency study on
axial flow impellers. Chemical Engineering and Processing 45, 625-632.
32. Zhou, G.., Kresta, S., 1996 (a). Distribution of energy between convective and turbulence flow for three frequently used impellers. Chemical Engineering Research and Design 74, 379-389.
33. Zhou, G.., Kresta, S., 1996 (b). Impact of tank geometry on the maximum turbulence energy dissipation rate for impellers. Aiche Journal 42, 2476-2490.
34. Zhu, H., Nienow, A.W., Bujalski, W., Simmons, M.J.H., 2009. Mixing studies in a model aerated bioreactor equipped with an up- or a down-pumping ‘Elephant Ear’ agitator:
Power, hold-up and aerated flow field measurements. Chemical Engineering Research and Design 87, 307-317.
35. Zwietering, Th. N., 1958. Suspending of solid particles in liquid by agitators. Chemical Engineering Science 8, 244-253.
List of Figure captions
Figure 1: Tank geometry
Figure 2: Impellers design: (a-b): TTP Mixel, (c-d): A315 Lightnin, (e-f): A310
Lightnin, (g-h): 3 streamed-blades VMI-Rayneri, (i-j): Elephant Ear Applikon
Figure 3: Time average velocity fields (m.s-1) measured by PIV in the vertical plane containing the agitation shaft and with each impeller rotating at its
just-suspended speed: (a) TTP 125- 50 rpm, (b) TTP 150 - 40 rpm, (c) A315 125 – 38 rpm, (d) A315 150 – 54 rpm, (e) A310 156- 49 rpm, (f) 3SB 160- 53 rpm, (g) EE 150 – 20 rpm.
Figure 4: Spatial distribution of
γ
RZcomponent of the macro-shear rate (s -1) in the vertical plane containing the agitation shaft with impeller rotating at its just-suspended speed: (a) TTP 125- 50 rpm, (b) TTP 150 - 40 rpm, (c) A315 125 – 38 rpm, (d) A315 150 – 54 rpm, (e) A310 156- 49 rpm, (f) 3SB 160- 53 rpm, (g) EE 150 – 20 rpm.
Figure 5: Evolution of the average and of the 90th percentile values of time average velocity distributions (m.s-1) according to the rotational speed of the impeller expressed as multiplies of Njs: (∆) EE 150, (□) A315 125, (○)TTP 150, (▲) A310 156, (●)TTP 125, (♦)3SB 160, (□) A315 150.
Figure 6: Evolution of the average and of the 90th percentile values of macro-shear rate distribution (s-1) according to the rotational speed of the impeller expressed as
multiplies of Njs: (∆) EE 150, (□) A315 125, (○)TTP 150, (▲) A310 156, (●)TTP 125, (♦)3SB 160, (□) A315 150.
Figure 7: Evolution of the average Kolmogorov scale (µm) according to the rotational speed of the impeller expressed as multiplies of Njs: (∆) EE 150, (□) A315 125, (○)TTP 150, (▲) A310 156, (●)TTP 125, (♦)3SB 160, (□) A315 150.
Figure 8 Evolution of the Turbulent Collision Severity Index (J.s-1) according to the rotational speed of the impeller expressed as multiplies of Njs: (∆) EE 150, (□) A315 125, (○)TTP 150, (▲) A310 156, (●)TTP 125, (♦)3SB 160, (□)
A315 150.
List of Table captions
Table 1: Values of impeller hydrodynamic parameters at their respective minimum rotational speed, Njs, corresponding to a complete suspension of microcarriers
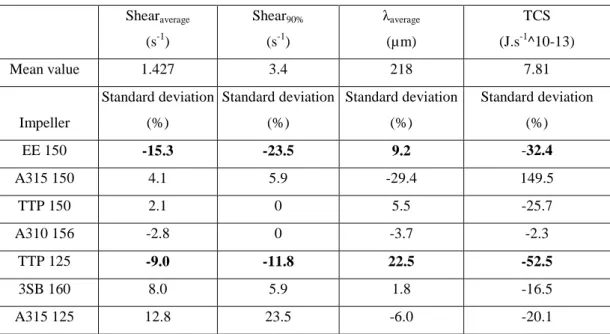
Table 2: Comparison of impellers based on their hydrodynamic parameters measured at their respective just-suspended speed: for each parameter, one impeller (rows 4 to 10) is characterized by a standard deviation value from a mean value
computed for all impellers (rows 2).
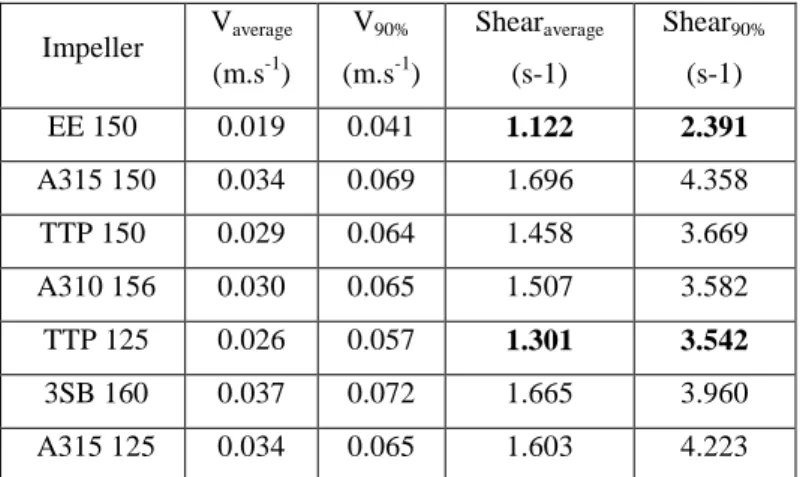
Table 3: Comparison of impellers at higher rotational velocities based on the slopes of the linear evolutions with the N/Njs ratio of:
- mean and 90th percentile values of the time average velocity field (column 2 -3)
- mean and 90th percentile values of macro-shear rate (column 4 - 5).
Table 4: Slopes of the linear evolutions of mean and 90th of the macro-shear rate with the impeller rotational speed N.
Tables
Table 1: Values of impeller hydrodynamic parameters at their respective minimum rotational speed, Njs,
Impeller Njs (rpm) Re (-) Swept volume/ Tank volume (%) Vaverage (m.s-1) V90% (m.s-1) Shearaverage (s-1) Shear90% (s-1) λaverage (µ m) λaverage/ dp TCS (J.s-1^10-13) EE 150 20 7350 8.39 0.025 0.05 1.209 2.6 238 0.79 5.28 A315 150 38 13965 3.98 0.029 0.055 1.485 3.6 154 0.51 19.48 TTP 150 40 14700 2.39 0.030 0.055 1.457 3.4 230 0.76 5.80 A310156 49 10476 1.43 0.031 0.06 1.387 3.4 210 0.7 7.63 TTP 125 50 12760 1.65 0.024 0.045 1.299 3.0 267 0.89 3.71 3SB 160 53 22161 2.14 0.032 0.065 1.541 3.6 222 0.74 6.52 A315 125 54 13781 1.50 0.030 0.06 1.609 4.2 205 0.68 6.24
Table 2: Comparison of impellers based on hydrodynamic parameters measured at their respective just-suspended speed: for each parameter, each impeller (rows 4 to 10) is characterised by its deviation (quantified by a standard deviation value) from the average behaviour (quantified by a mean value computed for all impellers) (rows 2). Shearaverage (s-1) Shear90% (s-1) λaverage (µ m) TCS (J.s-1^10-13) Mean value 1.427 3.4 218 7.81 Impeller Standard deviation (%) Standard deviation (%) Standard deviation (%) Standard deviation (%) EE 150 -15.3 -23.5 9.2 -32.4 A315 150 4.1 5.9 -29.4 149.5 TTP 150 2.1 0 5.5 -25.7 A310 156 -2.8 0 -3.7 -2.3 TTP 125 -9.0 -11.8 22.5 -52.5 3SB 160 8.0 5.9 1.8 -16.5 A315 125 12.8 23.5 -6.0 -20.1
Table 3: Comparison of impellers at higher rotational velocities based on the slopes of the linear evolutions with the N/Njs ratio of :
- mean and 90th percentile values of the time average velocity field (column 2 - 3);
Impeller Vaverage (m.s-1) V90% (m.s-1) Shearaverage (s-1) Shear90% (s-1) EE 150 0.019 0.041 1.122 2.391 A315 150 0.034 0.069 1.696 4.358 TTP 150 0.029 0.064 1.458 3.669 A310 156 0.030 0.065 1.507 3.582 TTP 125 0.026 0.057 1.301 3.542 3SB 160 0.037 0.072 1.665 3.960 A315 125 0.034 0.065 1.603 4.223
Table 4: Slopes of the linear evolutions of mean and 90th of the macro-shear rate with the impeller rotational speed N.
Impeller Shearaverage (s-1) Shear90% (s-1) EE 150 0,056 0,120 A315 150 0,045 0,115 TTP 150 0,036 0,092 A310 156 0,031 0,073 TTP 125 0,026 0,071 3SB 160 0,031 0,075 A315 125 0,030 0,078 Figures
Figure 2: Impellers design: (a-b): TTP Mixel, (c-d): A315 Lightnin, (e-f): A310
Figure 3: Time average velocity fields (m.s-1) measured by PIV in the vertical plane containing the agitation shaft and with each impeller rotating at its
just-suspended speed: (a) TTP 125- 50 rpm, (b) TTP 150 - 40 rpm, (c) A315 125 – 38 rpm, (d) A315 150 – 54 rpm, (e) A310 156- 49 rpm, (f) 3SB 160- 53 rpm, (g) EE 150 – 20 rpm.
Figure 4: Spatial distribution of
γ
RZcomponent of the macro-shear rate (s-1) in the vertical plane containing the agitation shaft with impeller rotating at its just-suspended speed: (a) TTP 125- 50 rpm, (b) TTP 150 - 40 rpm, (c) A315 125 – 38 rpm, (d) A315 150 – 54 rpm, (e) A310 156- 49 rpm, (f) 3SB 160- 53 rpm, (g) EE 150 – 20 rpm.Figure 5: Evolution of the average and of the 90th percentile values of time average velocity distributions (m.s-1) according to the rotational speed of the impeller
expressed as multiplies of Njs: (∆) EE 150, (□) A315 125, (○)TTP 150, (▲) A310 156, (●)TTP 125, (♦)3SB 160, (□) A315 150.
Figure 6: Evolution of the average and of the 90th percentile values of macro-shear rate
multiplies of Njs: (∆) EE 150, (□) A315 125, (○)TTP 150, (▲) A310 156, (●)TTP 125, (♦)3SB 160, (□) A315 150.
Figure 7: Evolution of the average Kolmogorov scale (µm) according to the rotational
speed of the impeller expressed as multiplies of Njs: (∆) EE 150, (□) A315 125, (○)TTP 150, (▲) A310 156, (●)TTP 125, (♦)3SB 160, (□) A315 150.
Figure 8 Evolution of the Turbulent Collision Severity Index (J.s-1) according to the rotational speed of the impeller expressed as multiplies of Njs: (∆) EE 150, (□) A315 125, (○)TTP 150, (▲) A310 156, (●)TTP 125, (♦)3SB 160, (□)