Brief technical note on “Entropy as a measure for
uncertainty”
Marc Van Droogenbroeck
4th December 2003
1 Context
Shannon’s famous paper [1] paved the way to a theory called “information theory”. In essence, the challenge raised by Shannon consists in how to measure the information con-tent (more or less the inverse of uncertainty) of a source that emits symbol, like the numbers on the top face of a dice.
In mathematical terms, we assume there is a source S that produces outcomes all con-tained in the set of possible outcomes O. For simplicity, we also assume that O contains N elements:
O= {o1, o2, ... , oN} (1)
Note that O encompasses all the possible outcomes. Furthermore we impose all the out-comes to be disjoined. If so, each outcome oihas a probability to occur p(oi)and the sum
of probabilities is equal to 1: N X i=1 p(oi) = 1 (2)
2 Measure of information
First remark that we want to characterize the source S, not O as there may be several ways to represent the outcomes of a random process. For example, in the case of the dice, the outcomes could be {1, 2, 3, 4, 5, 6} or {even, odd}.
So we have to work hard to find the best “atomic representation” of our source. In other words, we have to find O that is the closest possible to the source1.
When struggling to define a measure of information, Shannon thought a few require-ments:
• information should be additive. So information of o1+ information of o2should be equal to information of {o1, o2}.
• information should be positive or nil.
• information should be measurable in practice.
A function that meets these requirements is the logarithmic function in base 2 (log2). There-fore he defined the information of event oias
I(oi) = − log2p(oi) (3)
Here are some numerical values.
1In practice, the modelization of a random source is the hardest part.
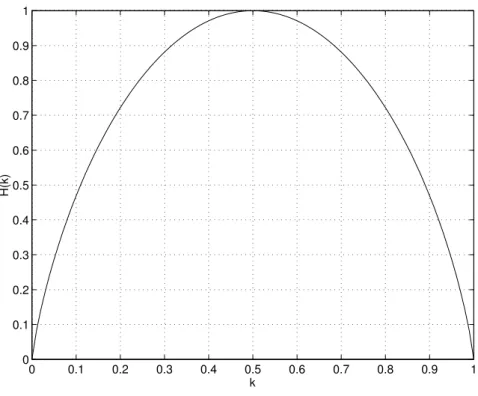
0 0.1 0.2 0.3 0.4 0.5 0.6 0.7 0.8 0.9 1 0 0.1 0.2 0.3 0.4 0.5 0.6 0.7 0.8 0.9 1 k H(k)
Figure 1: Entropy of a binary source with respect to the probability k of one of its events. • If p(oi) = 0.5then I(o) = 1.
• If p(oi) = 0.25then I(oi) = 2.
• If p(oi) = 0.125then I(oi) = 4.
So the lower the probability, the higher the information that the realization of that event brings to the observer.
Information does characterize an event, not a source. In order to evaluate the informa-tion/uncertainty contained in a source, we should multiply the information of individual events by their frequency of occurrence (thus their probability). This results in a notion, called entropy of a source S and defined as
H(S) = N X i=1 p(oi) I(oi) = − N X i=1
p(oi) log2p(oi) (4)
It is expressed (=unit) in information bits or more commonly bits and characterize the average entropy of an event2. Figure 1 shows the entropy of a source that contains two
events {o1, o2}whose probabilities are respectively p(o1) = kand p(o2) = 1 − k. When
k= 0or k = 1, one event never occurs. So there is no information to be expected from the observation and H(S) = 0. However when both events have equal probabilities (k = 0.5), it is impossible to predict the next outcome and the information brought by an observation is at it highest (1 information bit in this particular case).
But this is not the end of the story. We can define the mutual entropy, the conditional entropy, and so on...
2This is confusing because the size of a file is given in bytes. A byte is equal to 8 bits. However these bits
have nothing to do with information bits! In fact, Shannon showed that the entropy is a lower bound to the actual size of the transcription of a result of an observation.
References
[1] C. Shannon. A mathematical theory of communication. Bell Systems Technical
Jour-nal, 27:379–423, 623–656, July–October 1948.