1991 78: 89-93
Y Beguin, G Lipscei, H Thoumsin and G Fillet
early pregnancy [see comments]
Blunted erythropoietin production and decreased erythropoiesis in
http://bloodjournal.hematologylibrary.org/misc/rights.dtl#repub_requests
Information about reproducing this article in parts or in its entirety may be found online at:
http://bloodjournal.hematologylibrary.org/misc/rights.dtl#reprints Information about ordering reprints may be found online at:
http://bloodjournal.hematologylibrary.org/subscriptions/index.dtl
Information about subscriptions and ASH membership may be found online at:
. reserved
Hematology; all rights Copyright 2007 by The American Society of
Suite 200, Washington DC 20036.
semimonthly by the American Society of Hematology, 1900 M St, NW, Blood (print ISSN 0006-4971, online ISSN 1528-0020), is published
Blunted Erythropoietin Production and Decreased Erythropoiesis
in Early Pregnancy
By Yves Beguin, Gyorgyi Lipscei, Henri Thoumsin, and Georges Fillet After decreasing in the first trimester of pregnancy, the total
red blood cell mass increases in the second and third trimesters to peak at term at about 120% to 125% of nonpregnant values, but how this is brought about by changes in the rate of erythropoiesis is not known. We
evaluated erythropoiesis by measuring serum transferrin receptor (TfR) levels in 406 women during normal pregnancy (N = 317). at delivery (N = 63). or in the early postpartum (N = 27). Despite the presence of the placenta and the frequent occurrence of iron deficiency, TfR levels remained low in the first two trimesters and increased in the third trimester and at delivery. To explain why erythropoiesic activity was relatively low in early pregnancy, we also
REGNANCY CAUSES an increase in plasma volume
P
and red blood cell (RBC) mass, which reach, respec- tively, 150% and 120% to 125% of nonpregnant values near However, the total RBC mass first decreases in early pregnancy, before gradually returning to nonpregnant values by week 30 and further increasing in late pregnancy: Because the RBC lifespan remains unchanged during pregnancy: modifications in the RBC mass must be pre- ceded by changes in the rate of erythropoiesis. Because until recently only ferrokinetics could provide a quantita- tive assessment of erythropoiesis, no measurement of eryth- ropoiesis has been performed during pregnancy, except by reticulocyte counts: which are only of semiquantitative value. The measurement of serum transferrin receptor (TW) levels has recently been proposed as a convenient method to monitor erythropoiesis in animal and in hu- mans.”’ In the present study, we measured TfR levels in pregnant women and found them to be significantly de- creased in the first part of pregnancy as compared with controls. Production of erythroid cells depends on stimula- tion by erythropoietin (Epo) produced by the kidney in response to hypoxia.’O Previous studies in small groups of women, including one by us,” have shown increased Epo levels in pregnant as compared with nonpregnant w0men16,~*-~’ but the relationship of Epo to the hematocrit (Hct) often was not assessed. We therefore evaluated serum Epo levels in relation to the degree of anemia and found relatively low levels as compared with control women. This finding suggests that blunted Epo production could be respocsible for the low erythropoietic activity observed in early pregnancy.SUBJECTS AND METHODS
Subjects. We studied 406 women who gave their consent to having blood drawn for hematologic tests while undergoing routine antenatal and obstetrical care. Mean age was 27 years (range 15 to 45 years). Gestational age, as established by one or more ultra- sound scans, ranged from 5 to 42 weeks. Erythropoiesis was evaluated during pregnancy (N = 317), during labor leading to vaginal delivery (N = 63), as well as on day 7 postpartum (N = 27). Control Epo samples were obtained from 74 women with Hct within the 25% to 44% range. This control group included 33 normal adult subjects who had not donated blood in the last 3 months, and 41 women with hypoplasticlaplastic (N = 9), he-
measured serum immunoreactive erythropoietin (Epo) in relation to the degree of anemia. There was a very strong correlation bgtween serum TfR and Epo levels in the entire group (r = .59, P < .0001) as well as in each period of pregnancy. Epp levels remained low for the degree of anemia and did not correlate with hematocrit in the first two trimesters, but recovered afterwards. In the early postpar- tum, Epo prodpction and erythropoiesis were normal. We conclude that: (1) erythropoiesis is decreased in the first part of pregnancy but increases afterwards; and (2) blunted Epo production in early pregnancy could be responsible for that observation.
o 1991 by The American Society of Hematology.
molytic (N = 7), dyserythropoietic (N = 9), or iron-deficient ane- mia (N = 16), who had not received RBC transfusions in the preceding week. Control TW samples were also obtained from 43 healthy women with normal Hct and serum ferritin (12 to 120 ng/mL).
Human placental receptor-transferrin complex was purified as described elsewhere16 and injected repeatedly into rabbits. Serum IgG were isolated from rabbit serum” and transfer- rin antibodies were removed by passing through a column of human diferric transferrin coupled to -gel 15 (Bio-Rad, Rich- mond, CA). Characterization of the plasma T W and receptor antibody has been described elsewhere.*-’
An enzyme-linked immunosorbent assay (ELISA)9 was used with minor modifications to measure serum levels of TW. Immuno- plates I with certificate (Nunc Intermed, Roskilde, Denmark) were used. The aliquots of blanks, standards, and unknown samples were added using a Digiflex automatic pipetor (Micromedic System, Philadelphia, PA). Standards were diluted to between 5 and 100 ng/mL and unknown sera were diluted 150 to 1:2,000 with 0.15 m o m phosphate-buffered saline (PBS) (pH 7.4) containing
0.5% bovine serum albumin and 0.05% Tween 20. After color development, differential absorbance was read in dual wave length mode at 492 and 690 in a Titertek Multiskan MCCi340 plate reader (Flow Laboratories, Herts, England). Each sample was run in triplicate. The between-assay variability (coefficient of variation) was 7.2% when the same control sample was measured in each plate. Because the standard consisted of a complex of receptor and transferrin molecules, all TfR values given are actually receptor- complex values.
Epo assay. Circulating Epo levels were measured by a commer- cially available radioimmunoassay (Incstar Corp, Stillwater, MN)
TfR assay.
From the Department of Hematology and the Department of
Submitted November 28, 1990; accepted March I , 1991.
Supported in part by Grant No. 3.4513.88 from the Fund for Medical Scientific Research (FRSM, Belgium) and by a grant from the
University of L i 2 e School of Medicine.
Address reprint requests to Yves Beguin, MD, University of Liige, Department of Hematology, SI-3, CHU Sart-Tilman, 4000 Liige, Belgium.
The publication costs of this article were defrayed in part by page charge payment. This article must therefore be hereby marked “advertisement” in accordance with 18 U.S.C. section 1734 solely to indicate this fact.
Gynecology and Obstetrics, University of Likge, Liige, Belgium.
0 1991 by The American Society of Hematology. 0006-4971 I91 I7801 -0020$3.0OlO
90 BEGUIN ET AL
that uses recombinant human Epo (rHuEpo) for tracer and standards. Samples are incubated with rabbit anti-Epo serum for 2
hours at room temperature before Epo tracer is added. After overnight incubation, goat antirabbit serum is added. After centrif-
ugation, the unbound tracer is removed by decantation and the pellet is counted. Several samples had to be diluted 1:lO. Twelve control samples were run in each assay, with a between-assay coefficient of variation ranging from 10.3% to 14.1%.
Serum iron and total iron-binding capacity (TIBC) were measured by standard Serum ferritin was measured by a radioimmunoassay.z0
Log transformed Epo and TfR values were used in statistical analyses. Student’s t-tests, with pooled or separated variances as appropriate, were used to compare two groups. Analysis of variance (ANOVA), with Snedecor’s F-test or
Welch’s test as appropriate, was used to compare more than two groups. Two-way analysis of variance was used to assess the effect of iron stores on TW values within each period studied. Pearson and likelihood-ratio
xz
tests were used to measure associations intwo-way or multiway frequency tables. The r correlation coefficient between two variables was computed in least squares regression equations. The slopes and y-intercepts of the regression lines between log(Epo) and Hct in controls and study subjects were tested for equality among groups by Student’s t-tests in an analysis of covariance, using the BMDP 1V program of the BMDP Statistical Software (University of California). A multivariate stepwise regression analysis was performed with serum TW as the dependent variable.
Miscellaneous.
Statistical methods.
RESULTS
Mean serum TfR level in 43 normal women was 6,940 5 1,480 ng/mL (range, 4,300 to 11,450). Thirty- three normal control women had a mean Hct of 39.5% & 2.1% (M & SD) and a mean Epo level of 16.4 ? 4.1 mU/mL, while Epo levels in 41 nonpregnant anemic women ranged from 10 to 237 mU/mL. The following regression (N = 74, r = -.88, P
<
.0001) was obtained between Epo (mU/mL) and Hct (%): log(Epo) = 3.8279-
(0.0662 Hct). Based on this formula, a predicted log(Epo) value was derived for each sample and the O/F’ ratio of observed/ predicted log(Epo) ranged from 0.80 to 1.20. Consequently, O/P ratios in study subjects were considered abnormal if lower than 0.80.Study subjects. Table 1 displays Hct, iron status, serum TfR and Epo levels, as well as O/P ratios in groups of pregnant women. As compared with controls, Hct de- creased in the first and further so in the second and third trimesters, before reincreasing at delivery and on day 7 postpartum (P
<
.0001 for comparison between periods ofControls.
pregnancy). Transferrin saturation as well as serum ferritin levels decreased throughout pregnancy. In the first trimes- ter, only 8% of women were iron deficient (serum ferri- tin
<
12 )L&). This figure rapidly increased to 27% in thesecond and 59% in the third trimester (P
<
.0001). TfR levels were decreased in early pregnancy, normal- ized in the first part of the third trimester, and increased slightly beyond normal values in late pregnancy, at delivery, and in the early postpartum (P<
.001). The evolution of Hct, TfR, Epo, and O/P ratio throughout pregnancy isillustrated in Fig 1. The fraction of cases with reduced erythropoiesis (TfR
<
4,300 p&L) was 34%, 48%, 16%, lo%, and only 1%, respectively, during weeks 5 through 12, 13 through 20,21 through 28,29 through 32,33 through 36, and after week 37(P
<
.OOOl). The effect of iron status on serum TfR levels was analyzed in two-way analysis of variance (Table 2). Within each trimester of pregnancy, women with deficient iron status (serum ferritin<
12 &L) had higher TfR levels than women with marginal status (ferritin 12 to 19 p,g/mL) and even more so than those with normal iron stores (ferritin 2 20 pg/mL). Both time of pregnancy and iron status were significant determinants ofTfR levels (P
<
.0001) and there was no interaction be- tween the two.Epo levels were higher during pregnancy (31.4 2 20.5 mU/mL), at delivery (33.9 ? 22.3 mU/mL), and on day 7 postpartum (35.1 & 34.7 mU/mL) than in normal women ( P
<
.001). Epo levels increased steadily (Fig 1) through- out pregnancy and into third trimester values (P<
.001), but remained relatively stable among third trimester, deliv- ery, and early postpartum values (not significant [NS]). The mean O/P ratio was significantly reduced in the first two trimesters ( P<
.001) but returned to normal values in the third trimester, at delivery, and on day 7 postpartum. Epo levels were relatively low for the degree of anemia (O/P ratio<
0.80) in 10% of the cases in the third trimester, and 25% of the cases in the first two trimesters (P<
0.01). In the 9 to 16 week period (Fig l), the percentage of cases with abnormal O/P ratios peaked to 34%.Figure 2 displays regression lines between Epo levels and Hct in groups of pregnant women as compared with control women. The inverse linear relationship between log(Epo) and Hct was not significant in the first (r = -.01) and second ( r = -.16) trimesters, was present but with a reduced slope (P
<
.001 for difference in slopes) during the third trimester (r = -.41, P<
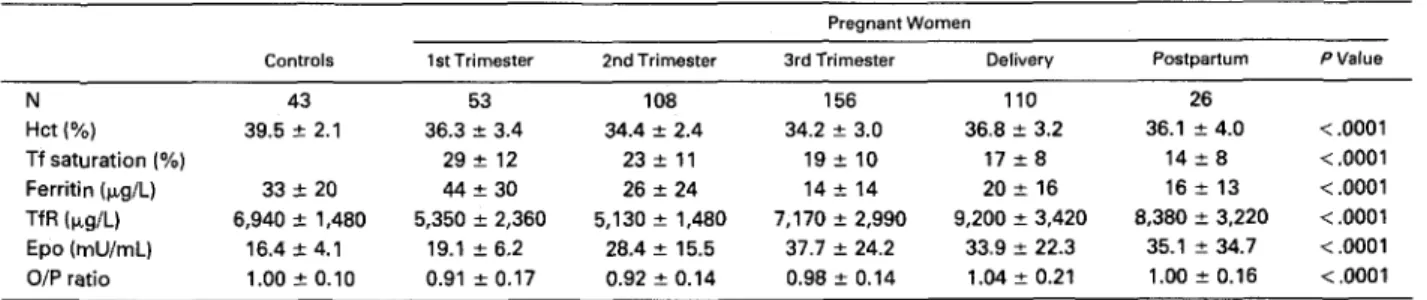
.0001), and was normalTable 1. Hct, Iron Status, Erythropoiesis, and Serum Epo Values in Controls and Pregnant Women
Pregnant Women
Controls 1st Trimester 2nd Trimester 3rd Trimester Delivery Postpartum PValue
N 43 53 108 156 110 26 Hct (Yo) 39.5 ? 2.1 36.3 f 3.4 34.4 f 2.4 34.2 ? 3.0 36.8 f 3.2 36.1 ? 4.0 < ,0001 Tf saturation (%) 29e 12 23 f 1 1 19 f 10 17 f 8 14 f 8 < .0001 Ferritin (p,g/L) 33 2 20 44 ? 30 26 f 24 14 f 14 20 t 16 16 i 13 < ,0001 Epo (mU/mL) 16.4 2 4.1 19.1 ? 6.2 28.4 ? 15.5 37.7 f 24.2 33.9 f 22.3 35.1 ? 34.7 <.0001 TfR (rg/L) 6,940 2 1,480 5,350 f 2,360 5,130 ? 1,480 7,170 f 2,990 9,200 ? 3,420 8,380 f 3,220 <.0001 O/P ratio 1.00 -c 0.10 0.91 2 0.17 0.92 2 0.14 0.98 f 0.14 1.04 ? 0.21 l.OO? 0.16 <.0001 Pvalues are given for comparison between groups of pregnant women.
ERYTHROPOIESIS IN PREGNANCY 91
n0 1. Evohrhn d Hct
m
towh, Epo kwk. and Epo O/ProtiosI*- : SEMI
*-
m a m y . n compand w)th m a lcontrd vrlue8.
(slopes and y-intcrccpts not significantly dificrcnt from
controls) in thc carly postpartum ( r = -.74. P
<
.OOOl). Thc rclationship was also nortniil in thc 28 womcn sampled h c y n d wcck 37 ( r = -.70, P < .(loOl).Thcrc was a vcry strong corrcliition hctwccn strum Epo
and TfR lcvcls in thc cntirc group of prcgniint womcn
( r = .SY.P
<
.(WWII).asw~lliisinthclirst(r = A8.P< .O()l).
scccmd ( r = 56. P
<
.(Mol), and third ( r = 5 4 . I'<
.CnWll) trimcstcrs. iit timc of dclivcry ( r = 56. P < .MM)l). o r on day 7 postpartum ( r = .48. P<
.(MI). Thcrc was a striking piirallclism hctwccn Epo OP ratio and TfR lcvcls through- out prcgniincy (Fig I).TfR
also mrrclatcd ncgativcly with paramctcrs of iron status such as .ScFc. transfcrrin s;iturii- tion. and serum fcrritin ( P<
.(MI). hut this was mmtlyohscwctl in thc third trimcstcr. Thc rcliitionship hctwccn lict and TfR lcvcls was not significiint in thc first ( r =
-
.W)10M.2 HhetdlronStmnonsOm"L.cnkA+cording ton- d ~ . g c u n ~ y Tlme 01 Reg- 111 2nd 3ld P T i r m i a T"m Tr1nvrrr v.lu Iron flatus M c i e n t 7.590 r. 6.810. 5.880 2 1.400 8.286 : 3.286 Marginal 5,490 : 2.000 5.870 : 1,640 < . m 1 Normal 5.040 : 1.690 6.570 2 1.060 5.660 2 1.710 P value < .0001
'Deficient and marginal iron flatus combined (N
-
7).m2. R . ) . t k m M p ~ E p o t o w h . d H c t h l t t u f k r t h k m - 1.r (I), wcond tltmostw (111. chlrd th..tw (llll. m d on d.v 7
portpwhrm (PP). Control r u m 010 r e p n u n t d by (h.h 95% confid.mo h i t s (shmded am.).
and scmnd ( r =
-.
14) trimcstcrs. and was wcak in the third trimcstcr ( r = -26. P<
Ill). In multivariiitc stcpwisc rcgrcssion iinalysis ( r =H
i
)
.
scrum Epo contrihutcd thc most to thc prediction of scrumTfR
(chanpc in i : 3 s ) .transfcrrin siituribtion (chiinpc in i : .OX). and fcrritin (chiingc in i : .02) wmchow cnhanccd precision. whilc Hct and wcck of prcpnancy did not add sipnificiincc.
DISCUSSION
Prcgnancy causcs mnsidcrahlc iiltcrations in plasma volumc iind RRC mass. Thcrc is littlc chiinpc in plasma volumc hcforc wcck 16. hut thcn a stcadv incrcasc titkcs
PliiCc to 120C; of nonprcgnant valucs by wcck 20. to 140Ci hywcck 30. iind IO 150Ci i t t tctn~."Althouph thc RRCmass
pcaks iit tcrm to iihout 120Ci to I2Y; of nonprcgnant cxmtml valucs.' littlc is kncnvn a h u t its cmlution thmugh- out prcgnancy. Mcat studics havc dcrivcd calculations of thc RRC' miis. from mcasurcmcnts of plasma volumc using Eviins blue dyc.':'
''
Such indirect mcasurcmcnts iiK: notrccommcndcd-" hccausc w h o l c - M y I+ct may vary widely. piirticuliirly in situations such as splcnomcgaly and prcp- niiny" ?h whcrc mnsidcrahlc rcdistrihution of blood vol-
ume and hlcwxl flow takcs placc. In thc one study using appropriate methodology for thc scriitl mcasurcmcnt of totid RRC miis.,' thcrc was a dccrcasc in thc first trimcstcr
of prcgniincy. followcd hy a gradual rcturn to nonprcgnant viilucs only hy wcck 30. and ii furthcr incrcasc in late
prcgnibncy.
I t hiis hccn shown that thc RRC lifcspan rcmains unchiingcd during prcgnancy.' Modifications in thc total RRC miics should thcn hc a m u n t c d for by variations in thc ratc of crythropoicsis.
No
quantitiitivc mcasurcmcnt of erythropoiesis is iiviiilahlc from thc litcraturc. cxccpt ncar tcrm.' hccausc o f the prohihitivc nccd to usc radioiron.92 BEGUN ET AL
Methodology has been recently introduced for the measure- ment of serum TfR levels as a valuable alternative to ferrokinetics for the quantitative assessment of erythropoie- ~is.7.~ Using this assay in the present study, we found that erythropoiesis was decreased in early pregnancy, normal- ized in the first part of the third trimester, and was moderately stimulated in late pregnancy, at delivery, and in the early postpartum. These data are consistent with the changes of RBC mass observed throughout pregnancy: Others" have measured TfR levels without other parame- ters of erythropoiesis in a small group of women, and observed increased levels in late pregnancy, but no change in the first part of pregnancy. The nature and standardiza- tion of the material measured in that assay is not well established% and direct comparison is difficult.
There are theoretical interferences potentially preclud- ing the use of serum TfR levels as a measurement of erythropoiesis during pregnancy. First, the placenta is very rich in receptors quite similar to the erythroid TfR, allowing its use as immunogen and standard in the present a~say.8.~.'~ If placental TfR contributed significantly to circulating TfR levels, they would have caused an apparent overestimation of erythropoiesis in pregnancy, but this was obviously not the case. Second, functional iron deficiency beyond deple- tion of iron stores has been shown to produce an increase in serum TfR
level^.^*^^*^
The effect of iron stores on TfR levels was also observed in pregnancy. Women with deficient iron status had higher levels than women with marginal status and even more so than those with normal iron stores. When only women with normal stores were considered, mean TfR levels in each trimester were even more decreased, while iron deficient women had normal levels. Therefore, iron deficiency does not appear to interfere significantly with the conclusion that the rate of erythropoiesis is low in preg- nancy.Plasma expansion could cause an apparent reduction in the serum concentration of TfR by diluting the total number of soluble receptors in a larger volume. Correcting for plasma volume would give mean receptor levels of about 5,290, 5,710, and 7,930 pg/L for women with normal iron stores, respectively, in the first, second, and third trimester. These levels are still well below expected values, particu- larly in view of levels of 23,258 f 5,640 and 32,900 4 8,352
pg/L in patients with immune hemolytic anemia or hemoglo- bin H disease, where a similar degree of anemia (Hct
35% f 5%) induced considerably higher rates of erythro- poiesis.'
We attempted to identify factors responsible for de- creased erythropoiesis in pregnancy. In multivariate step- wise regression analysis, serum Epo contributed the most to the prediction of serum TfR. The correlation between serum TfR and Epo was strong in each period of pregnancy. Epo levels are best expressed in relation to the Hct?' We found an excellent correlation between Epo levels and Hct in 74 women with various degrees of anemia. Therefore, Epo levels measured in pregnant subjects could be related to predicted values calculated from the Hct. Absolute Epo levels increased throughout pregnancy and were in agree- ment with the Hct in the third trimester, at delivery, and in the early postpartum, but in the first two trimesters they were below predicted levels in the vast majority and low relatively to the Hct in 25% of the cases. The inverse linear relationship between log(Epo) and Hct, absent in the first trimester, progressively returned to normal as pregnancy advanced (Fig 2).
Several physiologic adaptations to pregnancy may aug- ment oxygen supply to the kidney sensor, thus depressing Epo release in the first trimester. Erythrocyte 2,3-diphospho- glycerate increases early in pregnancy, producing a shift in the oxygen dissociation curve to the right.31 In the first trimester, the renal blood flow is considerably increased: but in the second half of pregnancy, a larger part of the expanded cardiac output is directed to the utero-placental and cutaneous circulations.26 These alterations in oxygen supply to the kidney could in part explain variations in Epo production rate throughout pregnancy and the early post- partum. Modifications in the endocrine status, such as the production of human placental lactogen, have also been suggested to possibly influence changes in Epo production and release during pregnan~y.'"~
We conclude that serum Epo levels, though increased over nonpregnant values, remain relatively low for the degree of anemia in the first part of pregnancy but return progressively to predicted levels thereafter. These changes in Epo production could explain the slowdown in erythropoi- etic activity observed in the first two trimesters and its normalization later in pregnancy. It should be emphasized that these alterations in the rate of erythropoiesis are adaptive changes that would certainly not require therapeu- tic intervention, such as the administration of rHuEpo. REFERENCES
1. Hytten FE, Paintin DB: Increase in plasma volume during normal pregnancy. J Obstet Gynaecol Br Commonwealth 70:402, 1963
2. Pirani BBK, Campbell DM, MacGillivray I: Plasma volume in normal first pregnancy. J Obstet Gynaecol Br Commonwealth 80884,1973
3. Hytten F Blood volume changes in normal pregnancy. Clin Haematol14601,1985
4. Berlin NI, Goetsch C, Hyde GM, Parsons RJ: The blood volume in pregnancy as determined by P32 labeled red blood cells. Surg Gynecol Obstet 97:173,1953
5. Pritchard JA, A d a m RH: Erythrocyte production and destruc- tion during pregnancy. Am J Obstet Gynecol79:750,1960
6. Howells MR, Jones SE, Napier JAF, Saunders K, Cavil1 I: Erythropoiesis in pregnancy. Br J Haematol64:595,1986
7. Kohgo Y, Niitsu Y, Kondo H, Kat0 J, Tsushima N, Sasaki K, Hirayama M, Numata T, Nishisato T, Urushizaki I: Serum transfer- rin receptor as a new index of erythropoiesis. Blood 701955,1987
8. Beguin Y, Huebers HA, Josephson B, Finch C A Transferrin receptors in rat plasma. Proc Natl Acad Sci USA 85:637,1988
9. Huebers HA, Beguin Y, Pootrakul P, Einspahr D, Finch C A Intact transferrin receptors in human plasma and their relation to erythropoiesis. Blood 75:102,1990
10. Schuster SJ, Wilson JH, Erslev AJ, Car0 J: Physiologic regulation and tissue localization of renal erythropoietin messen- ger RNA. Blood 70:316,1987
11. Beguin Y, Lipscei G, Oris R, Thoumsin H, Fillet G: Serum immunoreactive erythropoietin during pregnancy and in the early postpartum. Br J Haematol76:545,1990
12. Widness JA, Clemons GK, Garcia JF, Schwartz R Plasma immunoreactive erythropoietin in normal women studied sequen- tially during and after pregnancy. Am J Obstet Gynecol 149:646, 1984
13. Cotes PM, Canning C E Changes in serum immunoreactive erythropoietin during the menstrual cycle and normal pregnancy. Br J Obstet Gynaecol90:304,1983
14. Manasc B, Jepson J: Erythropoietin in plasma and urine during human pregnancy. Can Med Assoc J 100:687,1969
15. Zivny J, Kobilkova J, Neuwirt J, Andrasova V Regulation of erythropoiesis in fetus and mother during normal pregnancy. Obstet Gynecol6077,1982
16. Huebers HA, Huebers E, Josephson B, Csiba E A highly efficient chemical isolation procedure for the rat placental transfer- rin receptor. Biochim Biophys Acta 991:30,1989
17. Axelsen NH, Kroll J, Weeke B: A manual of quantitative immunoelectrophoresis. Methods and applications. Scand J Immu- no1 Suppl2:1,1973
18. Bothwell TH, Conrad ME, Cook JD, Fielding J, Hallberg L, Izak G, Layrisse M, Ramsay WNM Recommendations for measure- ment of serum iron in human blood. Br J Haematol38:291,1978
19. Bothwell TH, Conrad ME, Cook JD, Fielding J, Hallberg L, Izak G, Layrisse M, Ramsay WNM: The measurement of total and unsaturated iron-binding capacity in serum. Br J Haematol38:281, 1978
20. Lipschitz DA, Cook JD, Finch C A A clinical evaluation of serum ferritin as an index of iron stores. N Engl J Med 2901213, 1974
21. Taylor DJ, Lind T Red cell mass during and after normal pregnancy. Br J Obstet Gynaecol86364,1979
22. Chesley L C Plasma and red cell volume during pregnancy.
Am J Obstet Gynecol112440,1972
23. ICSH: Recommended methods for measurement of red-cell and plasma volume. J Nucl Med 21:793,1980
24. Zhang B, Lewis SM: Splenic hematocrit and splenic plasma pool. Br J Haematol66:97,1987
25. Davison JM: The urinary system, in Hytten FZ, Chamber- lain GVP (eds): Clinical Physiology in Obstetrics. New York, NY,
Blackwell Scientific, 1980, p 289
26. de Swiet M The respiratory system, in Hytten FE, Chamber- lain GVP (eds): Clinical Physiology in Obstetrics. New York, NY,
Blackwell Scientific, 1980, p 79
27. Kohgo Y, Niitsu Y, Nishisato T, Kondo H, Kat0 J, Tsushima N, Hirayama M, Sasaki K, Urushizaki I: Immunoreactive transfer- rin receptor in sera of pregnant women. Placenta 9523,1988
28. Flowers CH, Skikne BS, Cove11 AM, Cook JD: The clinical measurement of serum transferrin receptor. J Lab Clin Med 114:368,1989
29. Skikne BS, Flowers CH, Cook JD: Serum transferrin recep- tor: A quantitative measure of tissue iron deficiency. Blood 75:1870,1990
30. Garcia JF, Ebbe SN, Hollander L, Cutting HO, Miller MO, Cronkite EP: Radioimmunoassay of erythropoietin: Circulating levels in normal and polycythemic human beings. J Lab Clin Med 99624,1982
31. McDonald RG, McDonald H N Erythrocyte 2,3-diphospho- glycerate and associated haematological parameters during the menstrual cycle and pregnancy. Br J Obstet Gynaecol84:427,1977