The appearance of CH
3 +ions from methyl halides by non-resonant
photoionization. A translational energy surprisal analysis. Part I. CH
3F
J. Momigny, R. Locht
Département de Chimie Générale et de Chimie Physique, Institut de Chimie, Bat. B6c, Université de Liège, Sart-Tilman, B-4000 Liège 1, Belgium
Abstract
A surprisal analysis has been applied to the total translational energy distribution (TED) of CH3 +
+ F from CH3F giving rise to a new and deeper insight into the dissociation dynamics involved in this process. For both the 16.85 and 21.22 eV photon energies used, the direct population at different energy levels of the B 2E state of CH3F+, which is radiationlessly coupled to the repulsive CH3F+ (A2A1) state, gives rise to wide and negatively surprised total TEDs. At both energies they have to be ascribed to severe limitations in the vibrational excitation of CH3
+
. Additionally, in the case of 21.22 eV photons, a non-statistical expression has to be used to account for the density of translational states. At both photon energies, the population of the CH3F+ electronic states through autoionization of Rydberg states accounts for (i) the concurrent appearance of TEDs governed by a pure RRKM behaviour and (ii) the positively surprised TEDs where the angular momentum conservation plays an important role. At 16.85 eV photon energy the distributions are assigned to CH3F
+
(X 2E) → CH3 (X 1
A'1) + F. At 21.22 eV photon energy, doubly excited electronic states of CH3F+ are assumed to take part and they are correlated with CH3+ (3A") + F channel.
1. Introduction
It has been recently shown how the occurrence of a bimodal behaviour in the translational energy surprisal of the C2H3
+
+F dissociation products from C2H3F could be assigned to the existence of two mechanisms in the dynamics of the dissociation process [1]. This experience led us to reinvestigate the surprisal of the translational energy distribution (TED) associated with the CH3+ + X (X = F, Cl, Br, I) decomposition from the methylhalides. A critical review of the large number of contributions devoted to different aspects of the ionization phenomena in these molecules, together with the present results, will enlighten the processes where the same ion (CH3
+
) appears from one class of precursors. The large amount of information obtained from the present investigation accounts for this contribution. The same CH3+ producing process observed in CH3X (X = Cl, Br, I) will be reported in a forthcoming paper.
2. Experimental results
The translational energy distribution of CH3 +
from CH3F is measured by using the experimental setup already described previously [2].
Briefly the photoions are formed in a Nier-type ion source with the VUV light produced in a discharge in rare gases, i.e. He (58.4 nm/21.22 eV) and Ne (73.6-74.4 nm/16.85-16.67 eV). Between the focusing lens and the entrance hole of a quadrupole mass spectrometer, the ions are energy analyzed by a retarding lens.
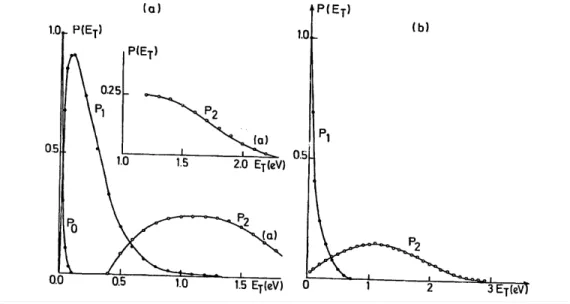
The observed TEDs of CH3+ obtained with the Ne(I) and the He(I) resonance lines are represented in Fig. 1a. Using the momentum conservation law, these distributions have been converted in terms of total TEDs corresponding to the energy carried away by the dissociation products CH3
+
+ F. The result of this conversion is shown in Fig. lb.
3. Evaluation of the translational energy surprisal
In a first contribution on this subject [3] the translational energy surprisals have been erroneously calculated for a unique value of the excess energy E corresponding to the difference (hv — AE) where hv is the photon energy and AE is the calculated appearance energy of CH3
+
. As pointed out later [1], in an ideal experiment a total TED would be measured simultaneously with successively increased values of the energy E in excess with respect to the lowest dissociation limit. In the present experiment the measured total TED is the result of the sum of such distributions, each being weighted for the ionic abundance observed for each energy value E under the same experimental conditions. Therefore it follows that any a priori calculated TED suitable for a surprisal evaluation will also be a similarly weighted sum of a priori calculated total TED for successively selected values of the excess energy E.
Fig. 1. (a) Experimental translational energy distributions and (b) total TED deduced from (a) for the process CH3F
+ → CH3
+
+ F and obtained with the Ne(I) resonance lines or 16.85 eV photons (Ne) and with the He(I) resonance line or 21.22 eV photons (He).
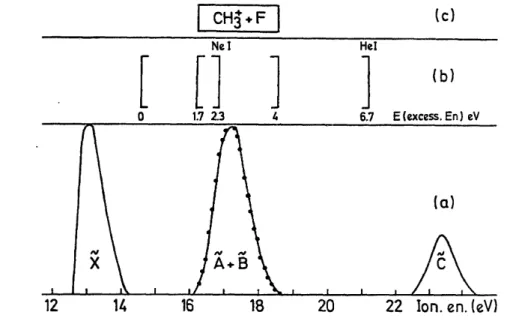
Fig. 2. The appearance of CH3 +
from CH3F. (a) Idealized He(I) photoelectron spectrum of CH3F, (b) excitation energies E for CH3
+
+ F with 16.85 eV photons (Nefl)) and 21.22 eV photons (He(I)) and (c) energy interval available for CH3++ F production through direct ionization.
From Fig. 2, and taking 14.55 eV as the calculated and experimental threshold energy for the production of CH3
+
ions [4], for 16.85 eV photons the excess energy E ranges from 0.0 to 2.3 eV and for 21.22 eV photon energy the excess energy E varies from 0.0 to 6.7 eV.
However, as shown by photoion-photoelectron coincidence (PIPECO) experiments [5] the appearance of CH3 + by the direct dissociative ionization channel is only opened through the CH3F+ (A2A1 + B 2E) states. From the photoelectron spectrum of CH3F represented in Fig. 2 [6,7] the excess energy range of E will be restricted to the interval of 1.7 eV ≤ E ≤ 2.3 eV and 1.7 eV ≤ E ≤ 4.0 eV for the Ne(I) and He(I) resonance lines respectively.
Fig. 3. Surprisal plots for the total TED as obtained by (a) 16.85 eV photons and (b) 21.22 eV photons. They exhibit a linear surprisal for 0.075 eV ≤ ET ≤ 0.4 eV in the former and for 0.7 eV < ET ≤ 2.3 eV in the latter.
In order to calculate the a priori weighted statistical total TED, i.e. Pw 0
expressed by
used for the surprisal evaluation of the distributions represented in Fig. lb, the P0(ET/Ei) distributions have been calculated for Ei values included in the ranges of 1.7 eV ≤ Ei ≤ 2.3 eV and 1.7 eV ≤ Ei ≤ 4.0 eV by steps of 0.1 eV using the RRHO approximation [1] i.e.
where s and r represent the number of vibrational and rotational degrees of freedom of CH3+ respectively and Ci stands for a constant disappearing by a an appropriate normalization to the maximum of the calculated distribution. In the case of CH3
+
s = 6 and r = 3 and Eq. (1) becomes
The weighting factors ai are measured for each step i from the photoelectron band corresponding to the (A2A1 +B
2
E) states and drawn in Fig. 2. Keeping in mind that the surprisal P is expressed by
the calculations mentioned above give rise to the surprisal diagrams represented in Fig. 3 for Ne(I) (see Fig. 3a) and He(I) (see Fig. 3b) excitation respectively. These diagrams will be discussed separately below.
3.1. The surprisal observed with the Ne(I) lines
The surprisal plot 3a has a complex shape. It reaches a maximum at 0.4 eV translational energy, is mainly linear for 0.05 eV ≤ ET≤ 0.4 eV and exhibits a strong curvature for 0.5 eV ≤ ET ≤ 2.2 eV. By a least-squares fit the linear portion of the surprisal is expressed by
experimental distribution in Fig. lb (Ne). The results of this treatment in shown in Fig. 4a. The total TED appears as resulting from the superposition of three distributions: (i) a zero translational energy distribution P0, (ii) a TED of the form given by Eq. (2) for 0.0 eV ≤ ET ≤ 1.2 eV and designated by P1, and (iii) a P2 distribution for the total translational energy range 0.4 eV ≤ ET ≤ 2.3 eV.
3.2. The surprisal observed with the He(I) line
The surprisal plot of Fig. 3b is related to the total TED observed with the He(I) line (see Fig. lb (He)). This distribution shows a long linear behaviour in the range 0.7 eV ≤ ET ≤ 3.0 eV represented by the least-squares fit
Introducing the relationship (3) for Pw 0
in Eq. (6) the whole distribution has been calculated down to ET = 0.0 eV and is subtracted from the experimental data (see Fig. lb (He)). The result is represented in Fig. 4b and differs appreciably from the result obtained with the Ne(I) resonance lines. The experimental distribution should be a sum of two contributions starting both at ET = 0.0 eV: (i) a rather narrow distribution in the range 0.0 eV ≤ ET ≤ 0.7 eV with a maximum centred on ET = 0.0 eV and designated by P1, (ii) a wide total TED designated by P2 starting at ET = 0.0 eV where P(ET) = 0 and extending over the range 0.0 eV ≤ ET ≤ 3.0 eV.
Both these complex and differing situations observed for Ne(I) and He(I) will be discussed in detail in the following section.
Fig. 4 Deconvolution of the total TED as obtained with (a) 16.85 eV photons and (b) 21.22 eV photons and calculated from the data of Fig. 3a and Fig. 3b respectively. The former is decomposed into three distributions P0, P1 and P2. The latter is found to be the sum of two distributions P1 and P2.
4. Discussion
The electron configuration of CH3F in its ground electronic state could be described by the following outer valence-shell representation in the C3v symmetry group:
(4a1) 2
(le)4(5ai) 2
(2e)4.
By He(I) photoelectron spectroscopy the ionization energy of the X2E, A2A1 and B 2
E states is measured [6]. Using the He(II) resonance line, the existence of a C 2A1 state has been shown [7]. The photoelectron spectrum has been represented schematically in Fig. 2 and it shows that the X 2E and the C 2A1 states are isolated, contrarily the A2A1 and the B 2E states are strongly interacting in the Franck-Condon region. Using photoelectron spectroscopic data [6,7], absorption spectroscopy in the vacuum UV [4] and appropriate thermochemical data [8], the correlation diagram in Fig. 5 has been built. In this diagram the Franck-Condon transitions are represented by shaded areas, the vertical rectangles locate the energy ranges where Rydberg states are observed in the absorption spectra of CH3F. The R, R' and R" states converge to the X 2E, B 2E and C 2A1 states respectively. With the help of these data the description of the dissociative ionization phenomena observed in
CH3F could be attempted.
The X 2E state of CH3F has its adiabatic ionization energy at 12.533 eV [6] and the molecular ion is stable up to 13.35 eV. From PIPECO work [5], up from 13.35 eV the CH2F+ + H dissociation channel is open and these fragments appear at the expense of the X 2E state only.
In the photoionization efficiency curve of CH3+ [4] two main processes are observed. The first appearance energy is measured at 14.55 eV in close agreement with the calculated threshold. Its cross section remains important at higher energies. The second threshold is observed at 16.25 eV, corresponding to an important increase of the cross section. This energy closely corresponds to the "adiabatic" ionization energy of the degenerate A2A1 + B 2E states. Keeping in mind that the PIPECO results [5] show that the A2A1 + B 2E states exclusively decay in the CH3
+
+ F channel, the lowest energetic process has unequivocally to be ascribed to an indirect dissociative ionization process involving the excitation of R'-type Rydberg states [4].
The 14.55 eV process is revealed by resonant photoionization [4] and from the present results obtained from Ne(I) excitation and gives rise to P0 and P1 translational energy distributions. The shape of both these distributions are believed to be ascribed to a quasi-statistical evolution of the X 2E state indirectly populated by autoionization of the R' Rydberg states. This mechanism is still operative when Ne(I) radiation is used but concurrently with the direct population of the A2A1 + B
2
E over the narrow energy band ranging from 16.25 to 16.85 eV.
Fig. 5. Correlation diagram for some dissociation channels in CH3F+. Shaded regions are Franck-Condon zones for direct ionization. Vertical rectangles locate the Rydberg series R, R' and R" converging to X 2E, A2A1 and B 2
E states of CH3F +
respectively. The dashed curve tentatively locates the doubly excited electronic state decaying into CH3+ (a3A") + F.
Confirming the PIPECO results [5], the second onset measured at 16.25 eV has to be ascribed to the excitation of the A2A1 + B
2
E states only. The shape of the corresponding TED curve is characteristic of the decay running over a strongly repulsive hyper-surface. In the Ne(I) excitation, the A2A1 state should be involved. Its decay looks strongly non-statistical, negatively surprised and submitted to many constraints. This appears from the occurrence of a nonzero threshold for ET (0.4 eV) and from the strong curvature of the surprisal function (see Fig. 3a) [9].
Examining the results obtained with the He(I) radiation, it has to be pointed out that the P2 distribution is also of the type observed for transitions taking place on a strongly repulsive surface, as it is the case with Ne(I) excitation. Small differences for 0.0 eV ≤ ET ≤ 3.0 eV have to be mentioned and are ascribed to the concurrent
population of the A2A1 state by a direct way and through a B 2E→ A2A1 radiationless transition.
Concerning the P2 distribution, it will be shown below (see Section 4.1.1) that it is also due to the sum of a zero translational energy component P0 and of a quasi-statistical P, distribution differing strongly from the P1 distribution observed with the Ne(I) lines (0.0 eV ≤ ET ≤ 0.7 eV instead of 0.0 eV ≤ ET ≤ 1.4 eV). It will be derived that P1[Ne(I)] and P1[He(I)] are statistical distributions expressed by ET
p
exp(-βET), but with significantly different values of the parameters p and β.
These subtle differences strongly suggest that the P1[He(I)] distribution has to be assigned to an other dissociation channel CH3F+ → CH3+ + F, i.e. through a population mechanism involving autoionization of R" Rydberg states (see Fig. 5). The CH3F+ electronic state involved, necessarily a doubly excited configuration of the molecular ion, will correlate with the CH3
+
(a3A") + F dissociation limit at about 18.35 eV [11].
The role played by the autoionization of R1" and R2" Rydberg states is established by the appearance of small but well visible "bumps" in the CH3+ photoion yield curve in the energy range of the excitation of the Rydberg states converging to the CH3F
+
(C 2A1) state. It has to be pointed out that these "bumps" are completely suppressed for a retarding potential of 0.45 V corresponding to a maximum ET value of 0.8 eV, in excellent agreement with the measured P1 distribution.
4.1. The detailed analysis of the P1 distributions 4.1.1. The P1[Ne(I)] distribution
The P1[Ne(I)] distribution obtained in Fig. 4a has been deduced by the surprisal analysis of the total TED shown in Fig. lb (Ne). A mechanism has been proposed for its interpretation allowing us to give a better evaluation of the surprisal associated with this distribution.
This TED being entirely ascribed to the indirect population through autoionization of the CH3F+ (X 2E) state, as autoionization is a resonant phenomenon, the P0(ET/Ei) a priori statistical distribution expressed by Eq. (2) has to be evaluated for the unique value of E = 2.3 eV. The surprisal calculated on these bases is displayed in Fig. 6a. It appears positive and linear with a slope λ = 2.66. This implies that the P1[Ne(I)] distribution is not rigorously statistical but not inverted. Klots [10] gave a theoretical expression which could reproduce the observed shape of the P1[Ne(I)] distribution. It is based on the fact that the long range potential energy between the separating fragments is of the form V = aR-n. When the long range potential is weakly attractive with a centrifugal potential, the P(ET) distribution is given by
and when normalized to its maximum at EM, it becomes
In this equation p = n - 2/n, where n is the exponent of R in the long range potential energy. It is worthwhile to note that Eq. (8) is closely related to Eq. (5). The reason is that when ET < Ei Eq. (2) can well be approximated as
where b = s + (r/2)- 1.
As shown in Fig. 6b the best fit for P1[Ne(I)] is given by
The shape of P1[Ne(I)]being accounted for by Eq. (8) would imply that a restriction operates on the purely statistical behaviour of the CH3+ + F decomposition. It should mainly be due to the balance between the long range potential between CH3+ and F and a centrifugal barrier. This explains the observed linear surprisal as ascribed to the occurrence of a unique constraint in the dynamics. The fact that the observed p value leads to n ≈ 6, characteristic of a long range potential between neutral particles, instead of n = 4 for ion-neutral
interaction, does not be considered as very critical. As it appears from the work of Klots [10], the n value appears more as an adjustable parameter than as a stringent requirement. An example of this is given in the same paper where an agreement between theory and experiment is obtained only for p = 1 (or n → ∞) in the case of the dissociation C6H6+ → C6H5+ + H.
Fig. 6. (a) Surprisal associated with the indirectly populated P1[Ne(I)] distribution and with respect to the distribution P0(ET,E) = KET0.5(2.3- ET)6.5. The slope is AT = 2.66. (b) Calculated P1[Ne(I)] distribution by P1 = 8.68 ET0.657exp(-6.48 ET). (× × ×) Calculated, (o o o) experimental.
4.1.2. The P1[He(I)] distribution
When the He(I) line is used the disentangling of the total TED shown in Fig. lb (He) leads to a P1 distribution extending up to 0.7 eV with a maximum at ET = 0.0 eV (see Fig. 4b). It has to be stressed that by 21.22 eV excitation the indirect population of two dissociation limits leading to CH3+ are possible, i.e. either the lowest limit at 14.55 eV
or the dissociation corresponding to
calculated at 18.35 eV from the most recent theoretical calculations [11].
Considering that the excitation of a R" Rydberg level populates indirectly either the first or the second dissociation limit, two possible values of E have to be considered, i.e. 6.67 or 2.87 eV respectively. Consequently the surprisal of P1[He(I)] was evaluated by using both these values introduced in Eq. (2).
As shown in Fig. 7a this operation leads to complex surprisals essentially linear above ET = 0.1 eV. By a least-squares fit these linear parts are given by
for Ei = 6.67 eV and Ei = 2.87 eV, respectively. By an extrapolation of both these straight lines for 0.0 eV ≤ ET ≤ 0.1 eV it is found that the P1 distribution is a sum of a P0 and a P1' distribution (see Fig. 7a). The distribution
P1' is accounted for by
corresponding to Eq. (7) where p = 0.5 or n = 4 corresponding to the exponent of a Langevin long range potential between CH3
+
and F. The centrifugal potential plays an important role in the interaction between the two particles. The substantial differences between P1[Ne(I)] and P1'(He(I))] distributions have very likely to be ascribed to the correspondence of the latter distribution to the opening of the dissociation channel producing CH3
+ (a3A")·
Fig. 7. (a) Surprisals calculated for P1[He(I)] for excess energies corresponding to two dissociation limits: E = 2.85 eV for CH3
+
(3A") + F and E = 6.6 eV for CH3 +
(1A1') +F. (b) Both surprisals led to the deconvolution of P1 into P0 and P1'. (c) This latter distribution is fit by P0' = 6.46ET
0.5
exp(-7.602ET). (× × × ) Calculated, (o o o) experimental.
4.2. The detailed analysis of the P2 distributions 4.2.1. The P2[Ne(I)] distribution
As suggested earlier in this section, the P2[Ne(I)] distribution has to be assigned to the direct population of a small part of the CH3F
+
(B 2E) state radiationlessly coupled with the A2A1 state where the dissociation takes place with a large amount total TED release. This distribution shows an important non-linear and negative surprisal (see Fig. 3a) which has to be expressed by a nth degree polynomial. It has been shown [9] that the degree n corresponds to the number of dynamical constraints of the dissociation. In an earlier work [12], the occurrence of a 4th degree surprisal polynomial was assigned to four constraints. These constraints are introduced in the P0(ET/Ei) expression to obtain a more accurate description of the P2[Ne(I)] distribution.
A first limitation to be introduced in the function of P0(ET/Ei) is that this function should be zero for ET = 0.4 eV. To express this limitation in Eq. (2) one gets
This expression of P0 introduced in the weighted function ∑
iaiP0(ET/Ei) will give a distribution Pw0. The P2 surprisal calculated with respect to this distribution is shown in Fig. 8. This surprisal is again non-linear and negative but with an initial slope of λT = - 4.92. This situation should correspond to the existence of severe limitations in the process and related to the number of vibrational degrees of freedom excited in CH3
+ .
triatomic molecules, the H3CF molecule could be considered as a triatomic H3≡C-F system. The dissociation of this molecule α-β-γ follows a pure impulsive model. In this framework, it has been shown that the ET values are related to average excitation values Eav through the relationship
where µa is the reduced mass of the two atoms α and β and µf is the reduced mass of α and βγ. In the present case taking Eav = 2 eV a value of ET = 1.74 eV is determined and a rather restricted vibrational energy is left for CH3+, i.e. Evibr. = 0.26 eV. The most easily excited vibrational mode of CH3 in CH3I and CH3Cl dissociations is the "umbrella" mode ω2 [14]. In the CH3F
+
dissociation only two quanta can be excited on the basis of Eq.(14) and choosing ω2 = 0.17 eV, by analogy with infrared data on the isoelectronic BH3 [15].
As it has been shown earlier [16], P0(ET, Ev, Ei) has to be expressed by
and introducing in (15) the values s = 1 and r = 3, it becomes
As it appears from Section 3, the final Pw0 is a weighted sum of P0(ET, Ev, Ei) where the ai factors are estimated from the A2A1 +B 2E photoelectron band for each Ei value introduced in (16). This distribution is calculated in the 1.7 eV ≤ Ei ≤ 2.3 eV range by steps of 0.1 eV and the summation is made for n = 0, 1 and 2 and is shown in Fig.8b. The rather good agreement between the experimental and calculated P2[Ne(I)] distributions directly shows that the expression of the Pw0 distribution evaluated through Eq. (16) and the severe constraints on the vibrational excitation of CH3+ in the direct dissociative ionization of CH3F+ are justified. This agreement is measured by the surprisal -ln(P2/Ptheor) shown in the upper part of Fig. 8b. This surprisal is close to zero.
Fig. 8. (a) Surprisal on P2[Ne(I)] with respect to the distribution expressed by Eq. (13). (b) Experimental (o o o) and calculated (× × × ) P2[Ne(I)] distribution using Eq. (16). The insert at the top of the diagram shows the residue.
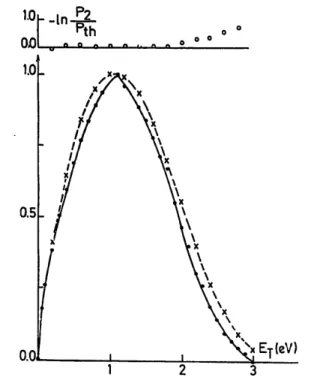
4.2.2. The P2[He(I)] distribution
Using the surprisal calculated in Fig. 3b, the P2 distribution shown in Fig. 4b looks different from the P2[Ne(I)]. It starts at ET = 0 eV and extends up to 3 eV, instead of 2.3 eV for Ne(I) excitation. The maximum is observed for ET = 1.1 eV as for P2[Ne(I)].
The linear and negative surprisal (λT = -3.13) shows that an inverted translational energy distribution is produced in this case. To build an a priori TED in agreement with P2[He(I)] two hypotheses could be put forward: (i) a strong limitation on the number of excited vibrational levels in CH3
+
and (ii) a non-ET 0.5
dependence of the density of translational energy levels. On these bases a P0(E
T/Ei) has been calculated using s = 1 and the density of translational energy levels proportional to ET
and the Pw0 distribution is estimated from
The Ei limits are 1.7 eV ≤ Ei ≤ 4.0 eV scanned by 0.5 eV steps and the weighting factors ai are measured from the A2A
1 + B 2E photoelectron band.
Fig. 9 shows the comparison between calculation and experiment. Table 1 Relative abundance (%) of the total CH3
+
ion yield for the P0, P1 (P1’)and P2 distributions observed with the Ne(I) and He(I) resonance lines
P0 P1 (P1’) P2 P0/[P0 + P1 (P1’)]
Ne(I) 3.6 51.2 45.2 6.6
He(I) 5.8 19.1 75.1 23.3
Fig. 9. Experimental (o o o) and calculated (× × ×) P2[He(I)] distribution using Eq. (18). The insert at the top of the diagram shows the residue.
4.3. Relative importance of the distributions in the total CH3 +
The total surface of the distributions displayed in Fig. lb are practically equal, showing that the total CH3
+
ion yield is almost constant for Ne(I) and He(I) excitation. This is also observed in the photoionization efficiency curve [4]. The fraction of this total abundance, spread over the P0, P1 (P1’)and P2 distributions have been measured and are listed in Table 1.
This table shows that the distributions (P0, P1 and P1’) generated through indirect population by Ne(I) radiation are of about the same importance as those originating from the direct population (P2). Contrarily, using He(I) as exciting radiation, the P2 distribution becomes by far the most important contribution. It has also to be pointed out that the relative intensity of P0 in P0 + P1 (P1’) is much more important when He(I) radiation is used. 4.4. Considerations about the P0 distributions
As shown in Table 1 only a small part of the total CH3 +
ion current contribute to the P0 TED, for both the Ne(I) and He(I) excitation. The maximum is located at ET = 0.0 eV and the distribution vanishes for ET ≈ 0.1 eV. In the frame of the RRKM theory for TEDs such distributions appear as entirely dominated by the characteristics of the transition state and their expression is given by [16]
where v is the number of vibrational degrees of freedom of the parent ion, i.e. υ = 9 for CH3F+, and E* is the excess energy above the zero point of the activated complex.
The P0[Ne(I)] distribution is suitably expressed by Eq. (19) for an E* value of 0.17 eV. Similarly, for the P0[He(I)] distribution the E* should be of 0.28 eV. On these bases it is possible to assign these P0 distributions to a true RRKM-type decay of CH3F
+
occurring at or very close to the dissociation limit. This behaviour is concurrent with the P1 and the P1’ distributions where the angular momentum conservation should play an important role.
The differences observed between the P0 distributions are accounted for by the two different "indirectly" populated dissociation limits, i.e. at (i) 14.55 eV with Ne(I) excitation and giving rise to
and (ii) 18.35 eV with He(I) excitation and producing
The CH3F+ (a) state is not observed in the He(I) photoelectron spectrum, being an electronic excited state of CH3F
+
derived from a doubly excited configuration. However, its dissociation limit could be indirectly populated by autoionization of the R" Rydberg states converging to the CH3F
+
(C 2A1) state. 5. Conclusions
A careful surprisal analysis of the total TED observed for the appearance of CH3 + F from CH3F using 16.85 or 21.22 eV photons, coupled with the results obtained with other methods (photoionization, photoelectron spectroscopy, PIPECO spectroscopy) allowed us to show that at both energies direct and indirect population processes play an important role in dissociation dynamics.
Using the Ne(I) radiation, the indirect population of the CH3F +
(X 2E) state outside the Franck-Con-don region occurs through autoionization of Rydberg series converging to the B 2E state. This process opens the possibility for the X 2E state to dissociate at the thermodynamic limit by a "quasi"-RRKM mechanism. A narrow "RRKM" translational energy distribution P0 appears concurrently with a positively surprised P1 distribution. The surprisal is ascribed to strong angular momentum conservation.
Under the same conditions, the direct population of a limited portion of the CH3F +
(B 2E) state is followed by a non-radiative transition to the repulsive CH3F
+
(A2A1) state correlated with the lowest dissociation limit. It gives rise to a non-linear negative surprisal for a P2 distribution. This TED is shown to originate from a strongly limited excitation of the "umbrella" vibrational mode of CH3
+
in the frame of the impulsive model for the energy partitioning.
Using the He(I) radiation, the indirect population of a doubly excited CH3F+ state takes place through autoionization of Rydberg series converging to the CH3F
+
(C 2A1) state. This state decays by a "quasi''-RRKM mechanism to the CH3
+
RRKM TED P0 is produced concurrently with a positively surprised P1’ distribution. The surprisal with respect to a pure statistical distribution is ascribed to strong angular momentum conservation.
Under these conditions the whole Franck-Condon region of the CH3F+ (B 2E) state is reached. It is radiationlessly coupled with the strong repulsive A2A1 state. The dissociation process running over this path gives rise to a P2 distribution characterized by a linear and negative surprisal. The strong negative surprisal is ascribed to (i) the excitation of a unique vibrational mode of CH3+ and (ii) the density of translational states proportional to ET in the present case whereas it is proportional to ET0.5 in the framework of a statistical model.
Acknowledgements
We acknowledge the Université de Liège, the Fonds National de la Recherche Scientifique (FNRS) and the Fonds de la Recherche Fondamentale Collective (FRFC under contract No. 2.4532.95) for financial support. References
[1] J. Momigny and R. Locht, Chem. Phys. Letters 211 (1993) 161.
[2] R. Locht, G. Caprace and J. Momigny, Chem. Phys. Letters 111 (1984) 560.
[3] J. Momigny, R. Locht and G. Caprace, Intern. J. Mass Spectrom. Ion Processes 71 (1986) 159. [4] R. Locht, J. Momigny, E. Rühl and H. Baumgärtel, Chem. Phys. 117 (1987) 305.
[5] J.H.D. Eland, R. Frey, A. Kuestler, H. Schulte and B. Brehm, Intern. J. Mass Spectrom. Ion Phys. 22 (1976) 155.
[6] L. Karlsson, R. Jadrny, L. Mattsson, F.T. Chau and K. Siegbahn, Physica Scripta 16 (1977) 225. [7] G. Bieri, L. Åsbrink and W. Von Niessen, J. Electron Spectry. Relat. Phenom. 23 (1981) 281. [8] H.M. Rosenstock, K. Draxl, B.W. Steiner and J.T. Herron, J. Phys. Chem. Ref. Data Suppl. 1 6 (1977). [9] A. Ben Shaul, Y. Haas, K.L. Kompa and R.D. Levine, Springer Series in Chemical Physics, Vol. 10. Lasers and chemical changes (Springer, Berlin, 1981).
[10] C.E. Klots, J. Chem. Phys. 64 (1976) 4269.
[11] J.A. Pople and P. von R. Schleyer, Chem. Phys. Letters 91 (1982) 9. [12] J. Momigny, R. Locht and G. Caprace, Chem. Phys. 102 (1986) 275. [13] G.E. Busch and K.R. Wilson, J. Chem. Phys. 56 (1972) 3626. [14] H.W. Hermann and S.R. Leone, J. Chem. Phys. 76 (1982) 4766.
[15] J.R. Morrey, A.B. Johnson, Y.C. Fu and G.R. Hill, Advan. Chem. Ser. 32 (1961) 157.
[16] E. Illenberger and J. Momigny, Topics in Physical Chemistry, Vol. 2. Gaseous molecular ions (Steinkopff, Darmstadt; Springer, New York, 1992).


![Fig. 6. (a) Surprisal associated with the indirectly populated P 1 [Ne(I)] distribution and with respect to the distribution P 0 (E T ,E) = KE T 0.5](https://thumb-eu.123doks.com/thumbv2/123doknet/5680820.138597/7.918.295.622.240.588/fig-surprisal-associated-indirectly-populated-distribution-respect-distribution.webp)
![Fig. 7. (a) Surprisals calculated for P 1 [He(I)] for excess energies corresponding to two dissociation limits: E = 2.85 eV for CH 3](https://thumb-eu.123doks.com/thumbv2/123doknet/5680820.138597/8.918.213.708.342.673/fig-surprisals-calculated-excess-energies-corresponding-dissociation-limits.webp)
![Fig. 8. (a) Surprisal on P 2 [Ne(I)] with respect to the distribution expressed by Eq](https://thumb-eu.123doks.com/thumbv2/123doknet/5680820.138597/9.918.274.639.332.561/fig-surprisal-p-ne-respect-distribution-expressed-eq.webp)