The Revenge of Purchasing Power Parity on
Carry Trades during Crises
M. Brière
and B. Drut
Empirical evidence shows that fundamental models have produced disappointing results over the past 20 years while carry trade strategies have performed superbly. But the real picture is much more complex. In fact, the track records of both strategies have varied considerably. This article shows that they have actually alternated between periods of profitability and underperformance. It also shows that when carry trade strategies perform well, fundamental strategies do poorly, and vice versa. Crises appear to play a significant role in the alternation of investment styles on currency markets. In contrast to carry trades, fundamental strategies perform remarkably well in crises. A portfolio that rotates between these two types of strategies, based on a risk aversion indicator such as implied equity volatility, would substantially outperform a pure carry trade strategy and would be robust to crises.
JEL Classifications: F31, G11, G15.
Keywords: carry trades, exchange rates, financial crisis, risk aversion, investment strategy, purchasing power parity, fundamentals model.
CEB Working Paper N° 09/013
July 2009
Université Libre de Bruxelles - Solvay Brussels School of Economics and Management Centre Emile Bernheim
The Revenge of Purchasing Power Parity on Carry Trades during Crises
M. Brière
1,2and B. Drut
1,2,3*July 2009
Abstract
Empirical evidence shows that fundamental models have produced disappointing results over the past 20 years while carry trade strategies have performed superbly. But the real picture is much more complex. In fact, the track records of both strategies have varied considerably. This article shows that they have actually alternated between periods of profitability and underperformance. It also shows that when carry trade strategies perform well, fundamental strategies do poorly, and vice versa. Crises appear to play a significant role in the alternation of investment styles on currency markets. In contrast to carry trades, fundamental strategies perform remarkably well in crises. A portfolio that rotates between these two types of strategies, based on a risk aversion indicator such as implied equity volatility, would substantially outperform a pure carry trade strategy and would be robust to crises.
JEL: F31, G11, G15.
Keywords: carry trades, exchange rates, financial crisis, risk aversion, investment strategy, purchasing power parity, fundamentals model.
1
Centre Emile Bernheim
Solvay Brussels School of Economics and Management Université Libre de Bruxelles
Av. F.D. Roosevelt, 50, CP 145/1 1050 Brussels, Belgium
2
Crédit Agricole Asset Management 90 boulevard Pasteur, 75015 Paris, France
3
University of Paris Ouest
200 avenue de la République, 92001 Nanterre, France * Corresponding author
1. Introduction
There is broad agreement, both among practitioners and in the academic literature, that fundamental models for predicting exchange rates produce disappointing performance. Meese and Rogoff (1983) and Cheung et al. (2005) tested the forecasting power of some of the most popular models, including purchasing power parity, Uncovered Interest rate Parity, the sticky-price monetarist model and the monetarist model enhanced by a productivity differential, as well as purely statistical models in the behavioural equilibrium exchange rate category, which take various macroeconomic variables into account. These authors conclude that the models' predictive abilities are mixed and vary with the exchange rates and periods studied.
Speculation is often cited to explain why exchange rates are weakly anchored to fundamentals. Carry trades in particular are singled out: many investors go long currencies with high interest rates and short those with low interest rates, betting that the former will appreciate against the latter. Theoretically, carry trades run counter to just one fundamental relationship, Uncovered Interest rate Parity (UIP), which predicts that nominal exchange rates will adjust to offset interest rate differentials between two countries. Formally, therefore, the carry trade strategy is a bet that UIP will not hold. From this standpoint, Plantin and Shin (2008) even describe carry trades as self-reinforcing arbitrages (Orléan (1999)). Indeed, the greater the number of investors taking part in a carry trade, the more the high- (low-) interest-rate currency appreciates (depreciates), the more remote UIP becomes and, finally, the more attractive carry strategies appear to investors, compared with fundamental strategies. But although the carry trade strategy clashes formally with only one fundamental model, many authors (Gagnon and Chaboud (2007), Brunnermeier et al. (2008), Plantin and Shin (2008)) find that it generally tends to increase divergence between the nominal exchange rate and its equilibrium value as defined by economic fundamentals. Given the diversity of the methods for implementing carry trade strategies (particularly through derivatives), it is hard to quantify their share of total currency trading. Galati and Melvin (2004), as well as Galati et al. (2007) identify hedge funds as the key players in the carry trade, but they highlight the growing presence of long-only asset managers, who use these strategies to diversify outside conventional asset classes. In any case, carry trade strategies have definitely become routine for a great many financial market participants.
Binny (2005), Gyntelberg and Remolona (2007), Pukthuanthong-Le and Thomas (2008) highlight the excellent returns to carry trade strategies in the last decade compared to other investment styles on the FX market. These analyses also show a pronounced asymmetry to the left of the return distribution and huge losses incurred by carry trades during the recent financial turmoil have been widely reported in the financial press and the academic literature. In fact, currencies with high (low) interest rates alternate long periods of slight appreciation (depreciation) with short periods of high depreciation (appreciation). This pronounced skew is often interpreted as a sudden reversion of the exchange rate to its fundamental value, from which it diverged because of carry trades (Gagnon and Chaboud (2007), Brunnermeier et al. (2008), Plantin and Shin (2008)).. Other authors show that volatility shocks on financial markets coincide with a sudden depreciation of high-interest-rate currencies and the appreciation of low interest rates currencies (Cairns et al. (2007), Brunnermeier et al. (2008)), hence a poor performance from carry trade strategies. Kohler (2007) also shows that carry trade performance is closely and positively correlated with equity performance and that the correlation intensifies with a negative shock to equity markets. Thus, empirical evidence concerning the poor results of fundamental models (Cheung et al. (2005)) and the strong performance of the carry trade conceals a much more complex reality. Actually, the performance of both strategies varies considerably over time.
Besides, with the latest financial turmoil, the asset management industry has undergone structural shocks and felt an urgent need to evolve in order to meet investors’ new expectations. Recent research has been investigating new methodologies to take into account the impact of financial crises on asset allocation so as to robustify portfolio performance. One initial approach is to construct an allocation that will withstand the shift to a crisis regime at lower cost and without the need to rebalance the portfolio (Chow et al. (1999), Brière and Szafarz (2008), Dash and Moran (2005), Brière et al. (2010)). Another approach consists in changing the optimal asset allocation when a crisis erupts in order to mitigate its harmful effects (Ang and Bekaert (2002,2004)). However, to our knowledge, the construction of crisis-robust strategies on the FX market has still not been addressed in the literature.
This article compares the performance of a carry trade strategy with that of one of the most widely used fundamental strategies, purchasing power parity (PPP), over the period from 1990 to 2008 for eight main developed country currencies. The comparisons show that the carry trade strategies perform much better on average than PPP. But more detailed
analysis shows that, in fact, PPP performs well during crises, unlike carry trade strategies, and that the opposite applies during calm periods. The low occurrence of crises (13% of the sample) explains why carry trade strategies performed much better than fundamental strategies during the study period. Portfolios are constructed based on the eight currencies and two types of investment strategies, carry trades and PPP. The article goes on to show that a strategy employing this rotation to invest in the carry trade during calm periods and PPP during crises clearly outperforms a pure carry trade strategy. Closer analysis shows that the results are even more pronounced when considering portfolios invested solely in high interest rate differential currency pairs. The larger this differential, therefore the greater the divergence from equilibrium value, and the greater the scale on which these carry trades are unwound and equilibrium value is restored.
We consider our work to be original for three reasons. First, while most studies mention the theoretical clash between carry trades and UIP, we know of no analysis of a possible opposition to other fundamental strategies, especially the most frequently used, PPP. Second, the predictive ability of PPP has never been tested with respect to market episodes, particularly crises. Last, an investment strategy is proposed that can be implemented directly, with significantly better performance than that of a pure carry trade strategy, and we believe that it can outperform during the bouts of high volatility that characterise financial crises.
The rest of the article is organised as follows: Section 2 describes the data and the methodology used to construct the two strategies and the portfolios based on the eight currencies studied. Section 3 presents the performance of the portfolios based on each individual strategy, looking at the influence of crises on this performance, as well as the performance of a “crisis-robust” strategy mixing the two initial strategies by considering an implied volatility signal. Section 4 concludes.
2. Data and methodology
This section presents the methodology used to construct our two strategies: carry trade (CT) and a fundamental strategy based on a Purchasing Power Parity (PPP) model.
2.1. Data
The strategies are based on eight major developed-country currencies: US dollar (USD), euro (EUR), Japanese yen (JPY), UK pound sterling (GBP), Swiss franc (CHF), Australian dollar (AUD), Canadian dollar (CAD) and New Zealand dollar (NZD). These eight currencies allow us to work with 28 currency pairs. The exchange rate series are sourced from Reuters at 4:00 p.m., London time. They are downloaded from Datastream1 and are collected monthly from March 1980 to December 2008.
One-month interbank rates have been used to implement currency strategies, which involve lending and borrowing in the currencies of two countries. And the eight countries’2 monthly consumer price indices have been used to estimate the PPP model. All data are supplied monthly by Datastream from March 1990 to December 2008. Descriptive statistics are available in the Tables 1, 2 and 3 of the Appendix 1.
Table 1 in Appendix 1 gives descriptive statistics for monthly returns of exchange rates against USD. We note a major discrepancy in average returns and volatilities. During the study period, CAD and GBP had the lowest returns and volatility against the dollar (returns close to zero, volatility of 6.9% and 9.4%, respectively), while JPY and CHF had the highest returns and volatilities (returns close to 3%, volatility in excess of 11%). Moreover, these are the only two currencies with very pronounced right-skewed returns against USD (skewness of 0.82 and 0.29, respectively). For all currencies, return kurtosis are much higher than 3, indicating that the distribution tails are much fatter than those of a normal distribution. An analysis of extreme returns produces a similar picture, making it possible to contrast JPY and
1
The 28 currency crosses are recovered from seven exchange rates against sterling. Note that as a proxy for the euro before 1999 we use a synthetic series calculated by weighting various European exchange rates.
2
German data are used as a proxy for the eurozone, as no aggregate data are available on the entire period under study.
CHF, with high maximum monthly gains and lower maximum losses, with AUD, GBP and NZD, which, by contrast, had low maximum gains and high maximum losses.
Descriptive statistics for 1-month interbank interest rates (Table 2, Appendix 1) highlight sharp differences between the average rates of eight countries. The UK, Australia and New Zealand had the highest rates during the study period, with averages of 6.44%, 6.49% and 7.40%, respectively. By contrast, Japan and Switzerland had the lowest rates (1.60% and 2.91% respectively). Table 3 of Appendix 1 gives descriptive statistics for monthly changes in consumer prices indexes. It shows that Japan and Switzerland were the countries with the smallest average increases between 1990 and 2008, while the countries with the biggest rises were Australia and New Zealand. Already, this initial analysis highlights a contrast between currencies with high interest rates and inflation (AUD, NZD, GBP) and those with low interest rates and inflation (JPY, CHF).
2.2. Estimation of the PPP model
The PPP model is one of the simplest and most widely used currency models3. One of its main advantages is that it can be estimated monthly and is therefore especially well-suited to implementing strategies. PPPis derived from the law of one price and assumes an equality relationship between exchange rates and the ratio of price levels:
j i ij P P E = (1)
where P is the price level in country i, i P is the price level in country j and j E is the number ij of units of currency i in exchange for one unit of currency j.
3
PPP is widely used by market practitioners and by large multinational institutions, such as the International Monetary Fund and the Organisation for Economic Co-operation and Development. Note that these institutions provide only annual PPP estimates. We therefore re-estimated this model on a monthly schedule, which was better-suited to our strategies
Empirically, equality is not verified, but the stationarity of real exchange rates over the long term is postulated. The long-term cointegration relationship between nominal exchange rates and the ratio of consumer price indices for the two countries4 is thus estimated:
eij =α +β (pi − pj) (2)
where )pi =ln(Pi , pj =ln(Pj)and eij =ln(Eij).
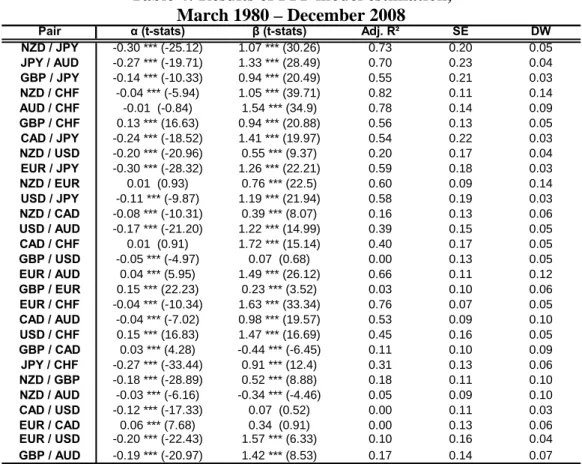
Table 4 in Appendix 2 summarises the results of the estimates5 over the entire period from March 1980 to December 2008 for the 28 exchange rates. The regressions indicate a cointegration relationship between the exchange rate and the price level differential. The β coefficient of the regression is significant at 1% level for 26 of the 28 rates and has the expected positive sign for 26 of them. To test a realistic implementation of the PPP strategy, an initial “in-sample” estimate is made of equation (2) on the sample from March 1980 to January 1990. This is followed by recursive “out-of-sample” estimates for each month from this date. Graph 1 below presents the fundamental value for the EUR/USD pair, estimated recursively from January 1990 to December 2008, compared with the market value.
Graph 1: EUR/USD and PPP forecasted value, recursive estimate, January 1990-December 2008 0.7 0.8 0.9 1 1.1 1.2 1.3 1.4 1.5 1.6 1.7 janv -9 0 janv -9 1 janv -9 2 janv -9 3 janv -9 4 janv -9 5 janv -9 6 janv -9 7 janv -9 8 janv -9 9 janv -0 0 janv -0 1 janv -0 2 janv -0 3 janv -0 4 janv -0 5 janv -0 6 janv -0 7 janv -0 8
PPP forecast EUR/USD 30% Under/Overvaluation
4
All the series are effectively integrated of the first order. 5
The findings show long periods of fundamental overvaluation or undervaluation, sometimes lasting several years. Exchange rate deviations from the equilibrium value defined by PPP rarely exceed 30%. Reversion to the equilibrium value may occur rather suddenly. For example, the euro was highly overvalued in 2007, and depreciated sharply against the US dollar in October and November 2008, returning at that date to its equilibrium value.
2.3. Construction of strategies and portfolios
We consider the case of a US investor in USD, rebalancing his portfolio monthly. For the carry trade strategy, at each month-end the investor borrows for one month at the interbank rate in the currency with the lowest interest rate and invests this amount for one month at the interbank rate in the currency with the highest interest rate6. For the PPP strategy, the investor observes at each month-end the difference between the realised exchange rate and its fundamental equilibrium level. The strategy consists in betting on a reversion to the fundamental value on a one-month time horizon. The investor then borrows for one month in the overvalued currency and invests this amount for one month in the undervalued currency.
Three portfolios are constructed: one including the 28 equally-weighted pairs (“all pairs”), an equally-weighted portfolio including the 14 pairs with the highest average interbank interest rate differentials during the January 1990 to December 2008 period (“high differential pairs”), and a portfolio composed of the 14 pairs with the lowest average interest rate differentials (“low differential pairs”). The latter two portfolios make it possible to determine whether high-carry currencies behave differently from low-carry ones.
In theory, currency strategies (on the spot market or via forwards) do not require any capital up-front and can therefore be infinitely leveraged. Accordingly, a key step in the investment process is to calibrate the risk taken on these strategies. One hundred per cent of the capital is assumed to be invested on the US money market, and the amount borrowed in the financing currency is then calibrated so that the annualised return volatility of each
6
portfolio over the period January 1990-December 2008 is equal to 5%. This corresponds to the calibration used in practice by many currency funds. This does not influence the performance measures (Sharpe ratio and success rate) but makes it easier to compare returns over the different portfolios.
3. Results
The performance of the two currency strategies, CT and PPP, is analysed over the entire study period, and the effect of financial crises on performance is then examined. Finally, the construction of a “crisis-robust” strategy that alternates the two strategies is presented.
3.1. Performance over the entire period
Table 5 presents descriptive statistics of returns of the CT and PPP strategies for the portfolios from January 1990 to December 2008.
Table 5: Descriptive statistics of returns on CT and PPP strategies for “all pairs”, “high differential pairs” and “low differential pairs” portfolios,
January 1990 – December 2008
CT PPP Difference CT PPP Difference CT PPP Difference
Ann. mean 6.74% 5.03% 1.71% 6.02% 4.51% 1.51% 7.18% 5.70% 1.48% Ann. Std. Dev. 5.00% 5.00% 0.00% 5.00% 5.00% 0.00% 5.00% 5.00% 0.00% Sharpe Ratio 0.45*** 0.11* 0.34*** 0.31*** 0.01 0.30*** 0.54*** 0.25*** 0.29*** Skewness -1.30 1.11 -1.38 1.36 -0.61 0.86 Kurtosis 6.89 7.33 8.33 10.20 7.61 5.98 Maximum 3.94% 8.06% 3.84% 9.23% 6.59% 7.62% Minimum -7.08% -4.59% -8.05% -4.86% -6.96% -3.45% Success Rate 73.13% 61.23% 71.81% 58.59% 73.57% 64.32%
All pairs High differential pairs Low differential pairs
*** and * indicate respectively the significance at 1%, and 10% level for the test of nullity of the Sharpe ratio (Lo (2002)) and for the test of significance of the difference of the Sharpe ratios of two strategies (Jobson and Korkie (1981)).
The CT and PPP strategies consistently outperform a cash investment during the 1990-2008 period: the Sharpe ratios are always positive, ranging between 0.31 and 0.54 for the CT strategy and between 0.01 and 0.25 for the PPP strategy. All Sharpe ratios are significantly
different from 0 according to the Lo (2002) test, except for the PPP strategy applied to the high differential pairs. For the two strategies, performance is slightly higher when considering the “low differential pairs” against the “high differential pairs”: the CT strategy produces 7.18% versus 6.02% (Sharpe ratio of 0.54 versus 0.31), while the PPP strategy obtains 5.70% compared with 4.51% (Sharpe ratio of 0.25 compared with 0.01). This result is somewhat surprising for the carry trade strategy, which we might have intuitively expected to perform better on the currencies with the highest differentials.
Over the entire period, the CT strategy clearly performs better than the PPP strategy. For the three portfolios, the difference in Sharpe ratios between the two strategies averages 0.3, and is significantly different from 0 according to the Jobson and Korkie test (1981). Similarly, the success rates (percentage of months with positive returns) are clearly better for the CT strategy (over 70%) than for the PPP strategy (around 60%).
One important difference between the two strategies is their extreme risks. Kurtosis values for all strategies are well above 3, indicating that the distribution tails are much fatter than those of a normal distribution. For an identical level of volatility, the CT strategy has very left-skewed returns (skewness ranging between -0.6 and -1.3), a result previously emphasised by Gagnon and Chaboud (2007) and Brunnermeier et al (2008). In contrast, the PPP strategy has a highly positive skew (between 0.9 and 1.4). This asymmetry of returns is also visible in the maximum levels of monthly gains and losses during the study period. The maximum losses are much larger for CT (between -7% and -8%) than for PPP (between -3% and -5%), while the opposite is true for the maximum gains. Thus, the better performance of the CT strategy in terms of returns and Sharpe ratios is partially offset by higher extreme risks, particularly the higher negative skewness of returns.
For the CT strategy, we also note the skewness is much more negative (-1.38 vs 0.61) and kurtosis is higher (8.33 vs 7.61) for the portfolio of “high differential pairs” than for the “low differential pairs” portfolio. This confirms that even when carry trade strategies are calibrated to have identical volatility levels, they are riskier for cross-rate pairs with higher differentials, subject to much harsher shocks.
Graph 2 shows the changes in one-year rolling performance of the “all pairs” portfolio over the study period. Graphs 4 and 5 in Appendix 2 present the same results for the portfolios with high and low interest rate differentials.
Graph 2: One-year rolling performance for CT and PPP strategies, “all pairs” portfolio, January 1991 – December 2008
-15% -10% -5% 0% 5% 10% 15% 20% 25% janv -9 1 janv -9 2 janv -9 3 janv -9 4 janv -9 5 janv -9 6 janv -9 7 janv -9 8 janv -9 9 janv -0 0 janv -0 1 janv -0 2 janv -0 3 janv -0 4 janv -0 5 janv -0 6 janv -0 7 janv -0 8
1 yr Rolling Performance CT 1 yr Rolling Performance PPP
The performance analysis over the entire period conceals a more complex reality, linked to the fact that performances are not stable over time. For all three portfolios, there is an alternation between periods of good performance for the CT strategy and the PPP strategy. The rolling performances of the two strategies are negatively correlated at -32%. As already noted by Cairns et al. (2007) and Brunnermeier et al. (2008), the performance of CT strategies declines during financial crises: in the European Monetary System crisis in 1992, the Russian crisis and bankruptcy of the LTCM hedge fund in 1998 and the subprime crisis in 2007 and 2008. But what has not been assessed yet is the fact that the PPP strategy's performance seems to improve during such periods. The following section aims to measure more precisely how crises impact on the performance of currency strategies.
3.2. Influence of crises
Many studies have demonstrated that implied equity volatility (as measured by a synthetic index, the VIX) is an accurate measure of risk aversion on markets (Collin-Dufresne et al. (2001), Pan and Singleton (2007)). VIX is also called the “global fear index”: the greater the VIX, the higher the concern about global markets. Most financial crises since the 1990s have produced large increases in the VIX index (Cairns et al. (2007), Brunnermeier (2008)). In order to identify simply the crisis periods, they are characterized as periods in which the VIX index was more than one standard deviation greater than its historical average since 1990 (Traub et al. (2000), Cairns et al. (2007)). The advantage of this definition of crisis episodes is that it relies solely on market data; it can therefore provide an indicator that may be directly used to implement strategies for any date. Graph 8 in Appendix 5 presents the crisis periods identified by the indicator. From January 1990 to December 2008 we identify 30 crisis months (13% of the observations). Performances are calculated for all three portfolios, specifically during crisis and non-crisis periods. Table 6 presents the descriptive statistics of returns for the three portfolios.
Table 6: Descriptive statistics of the returns of CT and PPP strategies for “all pairs”, “high differential pairs” and “low differential pairs” portfolios
in crisis and non-crisis periods, January 1990 – December 2008
CT PPP Difference CT PPP Difference CT PPP Difference
Ann. mean 8.00% 3.94% 4.06% 7.52% 3.34% 4.17% 7.53% 5.01% 2.52% Ann. Std. Dev. 4.51% 4.45% 0.06% 4.34% 4.42% -0.09% 5.02% 4.66% 0.36% Sharpe Ratio 0.77*** -0.13* 0.90*** 0.69*** -0.26*** 0.95*** 0.60*** 0.10 0.49*** Skewness -0.73 0.38 -0.53 0.21 -0.59 0.89 Kurtosis 4.17 4.75 3.92 4.98 8.14 7.19 Maximum 3.94% 4.92% 3.84% 4.72% 6.59% 7.62% Minimum -4.00% -4.59% -3.77% -4.86% -6.96% -3.45% Success Rate 75.13% 59.39% 74.11% 57.36% 74.11% 64.47% Ann. mean -1.53% 12.16% -13.69% -3.82% 12.16% -15.98% 4.91% 10.29% -5.38% Ann. Std. Dev. 7.10% 7.45% -0.35% 7.63% 7.53% 0.09% 4.89% 6.80% -1.91% Sharpe Ratio -0.80*** 1.07*** -1.87*** -1.05*** 1.06*** -2.11*** 0.15 0.90*** -0.75*** Skewness -1.65 1.55 -1.58 2.24 -0.85 0.44 Kurtosis 6.12 5.55 6.33 8.56 3.55 2.68 Maximum 2.56% 8.06% 2.35% 9.23% 2.66% 5.28% Minimum -7.08% -1.73% -8.05% -1.56% -3.19% -2.92% Success Rate 60.00% 73.33% 56.67% 66.67% 70.00% 63.33% Crises
All pairs High differential pairs Low differential pairs No crises
*** and * respectively indicate the significance at 1%, and 10% level for the test of nullity of the Sharpe Ratio (Lo (2002)) and for the test of significance of the difference of the Sharpe Ratios of two strategies (Jobson and Korkie (1981)).
Financial crises have a strong impact on the strategies’ performance. They sharply depress the returns and Sharpe ratios of the CT strategy. In calm periods, the CT's Sharpe ratio is highly significantly positive for all three portfolios (between 0.60 and 0.77), but it becomes strongly negative in crisis periods for two of the three (-0.80 for the “all pairs” portfolio and -1.05 for the “high differential pairs” portfolio) and not significantly positive for the “low differential pairs” portfolio (0.15). For the PPP strategy, crises have the opposite effect, boosting its returns and Sharpe ratios. Performance is negative for two of the three portfolios in calm periods, but becomes highly significantly positive in crisis periods. For example, for the “all pairs” portfolio, the Sharpe ratio rises from -0.13 in calm periods to 1.07 in crises. The picture is similar for the success rates of the strategies: much higher in calm periods than in crisis periods for CT (75% versus 60% for the “all pairs” portfolio) and much lower for PPP (59% versus 73%). The differences between crisis and non-crisis performance are much more pronounced for the “high differential pairs” portfolio than for the “low differential pairs”. This result confirms that the divergences and reversions to the fundamental value occur more strongly for cross-rate pairs with high interest rate differentials.
In sum, although the CT strategy sharply outperforms the PPP strategy during calm periods (Sharpe ratio of 0.77 versus -0.13 for the portfolio based on 28 cross-rate pairs), the opposite is true in crisis times (Sharpe ratio of -0.8 for the CT strategy versus 1.07 for PPP). This finding is more pronounced for the “high differential” pairs than for the “low differential” ones: for the first group, the difference in Sharpe ratios between the CT strategy and the PPP strategy is 0.95 in calm periods and -2.11 in crisis periods, and for the second group, the difference in Sharpe ratios is 0.49 in normal periods and -0.75 in crises.
For both strategies, the volatility and skewness of returns increase sharply during crises. For the CT strategy, volatility rises from 4.51% to 7.10% and skewness from 0.73 to -1.65 in crisis for the “all pairs” portfolio, and kurtosis increases strongly. Similarly, for the PPP strategy, positive skew becomes more pronounced during crises, and kurtosis increases. For the three portfolios, maximum gains from the PPP strategy are clearly higher in crisis periods than in calm periods, while for the CT strategy, maximum losses are much greater.
Calm periods therefore appear to be associated with a very good performance for the CT strategy and a lacklustre showing for the PPP strategy. However, crisis periods are
associated with excellent performance by PPP (higher Sharpe ratios and more pronounced right skewness of returns), and a poor performance from CT (negative or near-zero Sharpe ratios and higher left skewness of returns). These results confirm that crises are a catalyst for carry trade unwinding (Gagnon and Chaboud (2007), Plantin and Shin (2008)). Furthermore, exchange rates return to fundamental PPP value during these periods.
3.3. Construction of a crisis-robust strategy
The preceding results suggest that a pure carry trade strategy could be improved upon by replacing it with a fundamental strategy in crisis periods. Therefore, this section presents a new strategy, constructed by taking advantage of the excellent performance of CT in calm periods but without suffering poor performance during crises. The first strategy (CTC) implements the carry trade in calm periods and halts it without making any bets as soon as the risk aversion indicator signals the onset of a crisis period. The second strategy (CTPPP) implements the standard CT strategy in calm periods and the PPP strategy in crisis periods. Table 7 presents descriptive statistics of returns of the standard carry trade (CT) and the two new strategies (CTC and CTPPP) from January 1990 to December 2008.
Table 7: Descriptive statistics of the returns of the CT, CTC and CTPPP strategies
for the “all pairs”, “high differential pairs” and “low differential pairs” portfolios, January 1990 – December 2008
CT CTC Diff. CTPPP Diff. CT CTC Diff. CTPPP Diff. CT CTC Diff. CTPPP Diff. Ann. mean 6.74% 6.88% 0.14% 8.30% 1.55% 6.02% 6.37% 0.35% 7.77% 1.74% 7.18% 6.87% -0.31% 8.00% 0.82% Ann. Std. Dev. 5.00% 4.31% -0.69% 4.97% -0.03% 5.00% 4.12% -0.88% 4.94% -0.06% 5.00% 4.77% -0.23% 5.16% 0.16% Sharpe Ratio 0.45*** 0.56*** 0.10*** 0.77*** 0.32*** 0.31*** 0.46*** 0.15*** 0.67*** 0.36*** 0.54*** 0.50*** -0.04 0.68*** 0.14*** Skewness -1.30 -0.65 0.25 -1.38 -0.43 0.86 -0.61 -0.53 -0.31 Kurtosis 6.89 4.45 6.73 8.33 4.14 9.08 7.61 8.69 7.29 Maximum 3.94% 3.94% 8.06% 3.84% 3.84% 9.23% 6.59% 6.59% 6.59% Minimum -7.08% -4.00% -4.00% -8.05% -3.77% -3.77% -6.96% -6.96% -6.96% Success Rate 73.13% 76.65% 75.33% 71.81% 75.77% 73.13% 73.57% 76.21% 74.01%
Low differential Pairs All pairs High differential pairs
*** indicates the significance at 1% level for the test of nullity of the Sharpe Ratio (Lo (2002)) and for the test of significance of the difference of the Sharpe Ratios of two strategies (Jobson and Korkie (1981)).
Halting the CT strategy during crises markedly improves portfolio performance. Not only are returns considerably better, but volatility is also lower overall. For the portfolio based on the 28 pairs, the Sharpe ratio rises from 0.45 to 0.56 (adopting no strategy during crises), and as high as 0.77 when the CT strategy is replaced by the PPP strategy during crises. Success rates also rise sharply, from 73% for the CT strategy to 77% for the CTC strategy and 75% for the CTPPP strategy. Results are similar for the “high differential pairs” portfolio (the Sharpe ratio rises from 0.31 to 0.46 for the CTC strategy and as high as 0.67 for CTPPP). However, the results are less significant for the “low differential pairs” portfolios: halting the CT strategy during crises does not produce a significant improvement in performance. Replacing it with the PPP strategy improves the Sharpe ratio slightly, but less than for the other two portfolios.
The extreme risks of the strategies are also reduced. The portfolio’s skewness based on the 28 pairs declines from -1.3 to -0.65 when the CT strategy is halted during crises, and it even becomes positive (0.25) when CT is replaced by PPP during crises. The results are similar but even more pronounced for the “high differential pairs” portfolio (the most negative returns are shaved and replaced by highly positive returns). However, the results are muted for the “low differential pairs” portfolio: the negative skewness decreases when the CT strategy is halted during crises, but does not return to positive territory).
Graph 3 below presents one-year rolling performance for the three strategies – CT, CTC and CTPPP for the “all pairs” portfolio. Graphs 6 and 7 in Appendix 4 present the same results for the “high differential pairs” and “low differential pairs” portfolios.
Graph 3: One-year rolling performance for CT, CTC and CTPPP strategies for the “all pairs” portfolio, January 1991 – December 2008
-15% -10% -5% 0% 5% 10% 15% 20% 25% janv -9 1 janv -9 2 janv -9 3 janv -9 4 janv -9 5 janv -9 6 janv -9 7 janv -9 8 janv -9 9 janv -0 0 janv -0 1 janv -0 2 janv -0 3 janv -0 4 janv -0 5 janv -0 6 janv -0 7 janv -0 8
1 yr Rolling Performance CT 1 yr Rolling Performance CTC 1 yr Rolling Performance CTPPP
If the CT strategies are closed during crisis periods, it is possible to avoid many of the periods of negative performance (with the exception of the 1993 – 1994 period and the recent period of the subprime crisis, in which annual performance was briefly negative for several months). Replacing the CT strategy with the PPP strategy during crises improves the results even more. Although performances are slightly lower over the 2001 – 2004 period, a relatively turbulent, crisis-prone era characterised by a steep increase in the VIX index, periods of negative CT performance in 1998 – 1999 and in the recent Subprime crisis period are replaced by highly positive performances.
4. Conclusion
The recent literature emphasises the failure of fundamental models, in predicting short-term changes in exchange rates. However, this article goes some way towards rehabilitating them. The performance of the two types of strategies, carry trade and fundamental PPP, are analysed in detail for 28 currency pairs from 1990 to 2008.
The performance of the CT strategy is significantly better than that of the PPP strategy, but it fluctuates widely over time. Periods of good performance for carry trades
correspond to periods of poor performance for fundamental strategies, and vice versa. Crises appear to play a significant role in this alternation. Although carry trades perform well in calm periods, fundamental strategies prove their mettle during crises. In fact, a return to fundamental value according to the PPP model is observed during these episodes; and the greater the short-term interest rate differential between the two currencies, the more pronounced this effect. These results confirm that carry trade strategies cause exchange rates to diverge markedly from their fundamental values during calm periods (Gagnon and Chaboud (2007), Brunnermeier et al. (2008), Plantin and Shin (2008)) and that financial crises are periods of a sudden "return to fundamentals". It is therefore possible to construct a strategy that will take advantage of this finding. Backtesting the performance of a portfolio that rotates between the two types of strategies (CT in calm periods and PPP in crises) based on a risk aversion indicator such as implied equity volatility (the VIX index), we show that it would have achieved substantially better performance than a pure carry trade strategy. It would also have avoided most of the periods of negative carry-trade performance, particularly the recent subprime crisis, which was particularly painful for CT strategies.
It is true that carry trade strategies have delivered outstanding performances, recently hailed in the academic literature (Cairns et al. (2007), Gyntelberg and Remolona (2007)), and have been widely used in recent years by more and more investors (hedge funds, asset management firms, etc.), as reflected in the proliferation of carry trade funds and indices. But those performances deserve to be questioned. In all likelihood, one of the reasons why carry trade strategies have outperformed fundamental strategies is that crises have been infrequent over the last 20 years (13% of the sample). But the stronger the carry trades’ performance and the greater the divergence from fundamental value, the more violent the subsequent return to equilibrium. This leads to huge losses that ultimately wipe out much of the earlier gains.
One of the limitations of this study is related to the very simple approach taken to financial crises. A risk aversion metric, the VIX index was used as a market indicator for the strategies. Although the use of the VIX, which represents investors’ expectations of future equity volatility, is warranted by the strong relationship between performance of carry trades and equity markets (Kohler (2007)), an interesting extension of this paper would be to analyse more precisely the role of financial crises in performance variability. Other methods of crisis identification may be used, including a more refined analysis of crisis origins (currency movements, loss of confidence, stock market crash, etc.), and the results should be compared
and contrasted. Furthermore, other fundamental currency models could be reviewed in the light of these new findings.
References
Ang A. and G. Bekaert (2002), “International Asset Allocation with Regime Shifts”, Review of Financial Studies, 15(4), pp. 1137-1187.
Ang A. and G. Bekaert (2004), “How do Regimes Affect Asset Allocation?”, Financial Analysts Journal, 60(2), pp. 86-99.
Binny J. (2005), “Currency Management Through the Ages”, Journal of Alternative Investments, 8, pp. 52-59.
Brière M. and A. Szafarz (2008), “Crisis-Robust Bond Portfolios”, Journal of Fixed Income, 18, pp. 57-70.
Brière M., A. Burgues and O. Signori (2010), “Volatility Exposure for Strategic Allocation”, Journal of Portfolio Management, forthcoming.
Brunnermeier M., S. Nagel and L. Pedersen, 2008, "Carry Trades and Currency Crashes", NBER Working Paper No. 14473, November.
Cairns J., C. Ho and R. McCauley, 2007, "Exchange Rates and Global Volatility: Implications for Asia-Pacific Currencies", BIS Quarterly Review, March.
Cheung Y-W., M. Chinn and A.G. Pascual, 2005, "Empirical Exchange Rate Models of the Nineties: Are any Fit to Survive?", Journal of International Money and Finance, 24, pp.1150-1175.
Chow G., E. Jacquier, M. Kritzman and K. Lowry (1999), “Optimal Portfolios in Good Times and Bad”, Financial Analysts Journal, 55(3), pp. 65-73.
Collin-Dufresne P., R. Goldstein and M. Spencer, 2001, "The Determinants of Credit Spread Changes", Journal of Finance, 56, pp. 2177-2207.
Dash S. and M.T. Moran (2005), “VIX as Companion for Hedge Fund Portfolios”, Journal of Alternative Investments, 8, pp. 75-80.
Galati G., A. Heath and P. McGuire, 2007, "Evidence of Carry Trade Activity", BIS Quarterly Review, September.
Galati G. and M. Melvin, 2004, "Why has FX Trading Surged? Explaining the 2004 Triennial Survey», BIS Quarterly Review, December.
Gagnon J. and A. Chaboud, 2007, "What Can the Data Tell Us About Carry Trades in Japanese Yen?", International Financial Discussion Papers of the Board of Governors of The Federal Reserve System, July.
Gyntelberg J. and E.M. Remolona, 2007, "Risk in Carry Trades: a Look at Target Currencies in Asia and the Pacific", BIS Quarterly Review, December.
Jobson J.D. and B.M. Korkie, 1981, "Performance Hypothesis Testing with the Sharpe and Treynor Measures", Journal of Finance, 36, pp. 889-908.
Kohler D., 2007, "Carry Trades: Betting Against Safe Haven", University of St.Gallen Discussion Paper no. 2007-12.
Lo A., 2002, "The Statistics of the Sharpe Ratio", Financial Analysts Journal, 58, pp. 36-52. Meese R. and K. Rogoff, 1983, "Empirical Exchange Rate Models of the Seventies: Do They Fit out of Sample?", Journal of International Economics, 14, pp. 3-24.
Orléan A., 1999, Le pouvoir de la finance, Odile Jacob Editions.
Pan J. and K. Singleton, 2008, "Default and Recovery Implicit in the Term Structure of Sovereign CDS Spreads", Journal of Finance, 63, pp. 2345-2384.
Plantin G. and H.S. Shin, 2008, "Carry Trades and Speculative Dynamics", available at SSRN: http://ssrn.com/abstract=898412.
Pukthuanthong-Le K. and Thomas L.R. [2008], “Weak-Form Efficiency in Currency Markets”, Financial Analyst Journal, 64(3), pp. 31-52.
Traub H., L. Ferreira, M. McArdle and M. Antognelli, 2000, "Fear and Greed in Global Asset Allocation", Journal of Investing, 9, pp. 27-32.
Appendix
Appendix 1: Descriptive statistics
Table 1: Descriptive statistics – monthly returns of exchange rates versus US dollar, March 1980 – December 2008
AUD CAD CHF EUR GBP JPY NZD
Ann. Mean 0.15% -0.05% 2.43% 0.87% -0.28% 3.55% 0.56% Maximum 8.78% 6.45% 14.12% 9.55% 6.62% 16.81% 7.89% Minimum -16.36% -12.55% -10.46% -10.23% -12.29% -10.11% -12.98% Ann. Std. Dev. 10.62% 6.89% 11.19% 10.04% 9.41% 11.13% 10.10% Skewness -0.68 -0.94 0.29 -0.18 -0.91 0.82 -0.51 Kurtosis 6.03 9.62 4.25 4.05 5.81 6.30 4.77
Table 2: Descriptive statistics – 1-month interbank rates, January 1990 – December 2008
AUD CAD CHF EUR GBP JPY NZD USD
Mean 6.49 4.93 2.91 4.54 6.44 1.60 7.40 4.45 Maximum 1.35 1.13 0.79 0.82 1.26 0.72 1.20 0.72 Minimum 0.35 0.15 0.01 0.17 0.17 0.00 0.30 0.04 Ann. Std. Dev. 0.66 0.72 0.75 0.66 0.80 0.69 0.61 0.54 Skewness 2.25 1.65 1.18 1.05 1.80 1.75 1.13 -0.17 Kurtosis 7.99 5.87 3.25 2.87 5.69 4.80 4.43 2.39
Table 3: Descriptive statistics – monthly changes in consumer price index, March 1980 – December 2008
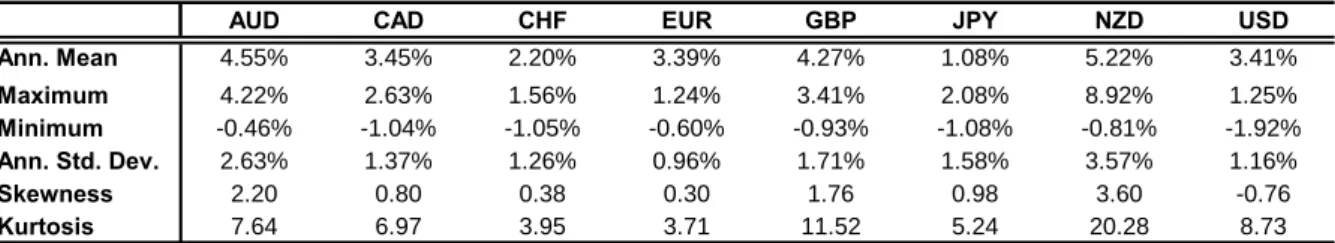
AUD CAD CHF EUR GBP JPY NZD USD
Ann. Mean 4.55% 3.45% 2.20% 3.39% 4.27% 1.08% 5.22% 3.41% Maximum 4.22% 2.63% 1.56% 1.24% 3.41% 2.08% 8.92% 1.25% Minimum -0.46% -1.04% -1.05% -0.60% -0.93% -1.08% -0.81% -1.92% Ann. Std. Dev. 2.63% 1.37% 1.26% 0.96% 1.71% 1.58% 3.57% 1.16% Skewness 2.20 0.80 0.38 0.30 1.76 0.98 3.60 -0.76 Kurtosis 7.64 6.97 3.95 3.71 11.52 5.24 20.28 8.73
Appendix 2: Estimation of PPP model
Table 4: Results of PPP model estimation, March 1980 – December 2008
Pair α (t-stats) β (t-stats) Adj. R² SE DW
NZD / JPY -0.30 *** (-25.12) 1.07 *** (30.26) 0.73 0.20 0.05 JPY / AUD -0.27 *** (-19.71) 1.33 *** (28.49) 0.70 0.23 0.04 GBP / JPY -0.14 *** (-10.33) 0.94 *** (20.49) 0.55 0.21 0.03 NZD / CHF -0.04 *** (-5.94) 1.05 *** (39.71) 0.82 0.11 0.14 AUD / CHF -0.01 (-0.84) 1.54 *** (34.9) 0.78 0.14 0.09 GBP / CHF 0.13 *** (16.63) 0.94 *** (20.88) 0.56 0.13 0.05 CAD / JPY -0.24 *** (-18.52) 1.41 *** (19.97) 0.54 0.22 0.03 NZD / USD -0.20 *** (-20.96) 0.55 *** (9.37) 0.20 0.17 0.04 EUR / JPY -0.30 *** (-28.32) 1.26 *** (22.21) 0.59 0.18 0.03 NZD / EUR 0.01 (0.93) 0.76 *** (22.5) 0.60 0.09 0.14 USD / JPY -0.11 *** (-9.87) 1.19 *** (21.94) 0.58 0.19 0.03 NZD / CAD -0.08 *** (-10.31) 0.39 *** (8.07) 0.16 0.13 0.06 USD / AUD -0.17 *** (-21.20) 1.22 *** (14.99) 0.39 0.15 0.05 CAD / CHF 0.01 (0.91) 1.72 *** (15.14) 0.40 0.17 0.05 GBP / USD -0.05 *** (-4.97) 0.07 (0.68) 0.00 0.13 0.05 EUR / AUD 0.04 *** (5.95) 1.49 *** (26.12) 0.66 0.11 0.12 GBP / EUR 0.15 *** (22.23) 0.23 *** (3.52) 0.03 0.10 0.06 EUR / CHF -0.04 *** (-10.34) 1.63 *** (33.34) 0.76 0.07 0.05 CAD / AUD -0.04 *** (-7.02) 0.98 *** (19.57) 0.53 0.09 0.10 USD / CHF 0.15 *** (16.83) 1.47 *** (16.69) 0.45 0.16 0.05 GBP / CAD 0.03 *** (4.28) -0.44 *** (-6.45) 0.11 0.10 0.09 JPY / CHF -0.27 *** (-33.44) 0.91 *** (12.4) 0.31 0.13 0.06 NZD / GBP -0.18 *** (-28.89) 0.52 *** (8.88) 0.18 0.11 0.10 NZD / AUD -0.03 *** (-6.16) -0.34 *** (-4.46) 0.05 0.09 0.10 CAD / USD -0.12 *** (-17.33) 0.07 (0.52) 0.00 0.11 0.03 EUR / CAD 0.06 *** (7.68) 0.34 (0.91) 0.00 0.13 0.06 EUR / USD -0.20 *** (-22.43) 1.57 *** (6.33) 0.10 0.16 0.04 GBP / AUD -0.19 *** (-20.97) 1.42 *** (8.53) 0.17 0.14 0.07 ***, **, * indicate that the variable is significant respectively at the 1% 5% and 10% level. SE represents the standard error of the regression and DW represents the Durbin-Watson statistic.
Appendix 3: Rolling performances of CT and PPP strategies
Graph 4: One-year rolling performance of CT and PPP strategies, “high differential pairs” portfolio, January 1991 – December 2008
-20% -15% -10% -5% 0% 5% 10% 15% 20% 25% 30% janv -9 1 janv -9 2 janv -9 3 janv -9 4 janv -9 5 janv -9 6 janv -9 7 janv -9 8 janv -9 9 janv -0 0 janv -0 1 janv -0 2 janv -0 3 janv -0 4 janv -0 5 janv -0 6 janv -0 7 janv -0 8
1 yr Rolling Performance CT 1 yr Rolling Performance PPP
Graph 5: One-year rolling performance of CT and PPP strategies, “low differential pairs” portfolio, January 1991 – December 2008
-15% -10% -5% 0% 5% 10% 15% 20% 25% 30% janv -9 1 janv -9 2 janv -9 3 janv -9 4 janv -9 5 janv -9 6 janv -9 7 janv -9 8 janv -9 9 janv -0 0 janv -0 1 janv -0 2 janv -0 3 janv -0 4 janv -0 5 janv -0 6 janv -0 7 janv -0 8
Appendix 4: Rolling performances of CT, CTC and CTPPP strategies
Graph 6: One-year rolling performance of CT, CTC and CTPPP strategies, “high differential pairs” portfolio, January 1991 – December 2008
-20% -15% -10% -5% 0% 5% 10% 15% 20% 25% janv -9 1 janv -9 2 janv -9 3 janv -9 4 janv -9 5 janv -9 6 janv -9 7 janv -9 8 janv -9 9 janv -0 0 janv -0 1 janv -0 2 janv -0 3 janv -0 4 janv -0 5 janv -0 6 janv -0 7 janv -0 8
1 yr Rolling Performance CT 1 yr Rolling Performance CTC 1 yr Rolling Performance CTPPP
Graph 7: One-year rolling performance of CT, CTC and CTPPP strategies, “low differential pairs” portfolio, January 1991 – December 2008
-15% -10% -5% 0% 5% 10% 15% 20% 25% 30% janv -9 1 janv -9 2 janv -9 3 janv -9 4 janv -9 5 janv -9 6 janv -9 7 janv -9 8 janv -9 9 janv -0 0 janv -0 1 janv -0 2 janv -0 3 janv -0 4 janv -0 5 janv -0 6 janv -0 7 janv -0 8
1 yr Rolling Performance CT 1 yr Rolling Performance CTC 1 yr Rolling Performance CTPPP
Appendix 5: Crises
Graph 8: VIX and crisis periods
0 10 20 30 40 50 60 70 F eb-90 F eb-91 F eb-92 F eb-93 F eb-94 F eb-95 F eb-96 F eb-97 F eb-98 F eb-99 F eb-00 F eb-01 F eb-02 F eb-03 F eb-04 F eb-05 F eb-06 F eb-07 F eb-08 0 1
Identified crises Vix
Crises periods are identified as periods of high implied equity market volatility (VIX index above its average over January 1990 – December 2008 plus one standard deviation