Do Leveraged Credit Derivatives Modify
Credit Allocation?
J.F. Boulier, M. Brière and J.R. Viala
This paper examines how credit derivatives have changed the construction of an efficient portfolio. Credit derivatives provide a way of gaining exposure to credit risk alone, to the exclusion of interest rate risk. They also permit a relatively easy use of leverage. We examine two types of allocation: the first is a conventional investment in government bonds, corporate bonds (investment grade and high yield) and equities in the United States; the second replaces corporate bonds with credit derivatives, which may also be leveraged. We look at past data on returns, risk and correlations of these investments, and we show that the credit risk component seems to have a strongly diversifying effect relative to the traditional asset classes, i.e. equities and government bonds. We then compute efficient frontiers within a standard mean variance framework. The results show the advantages of credit derivatives for portfolio diversification, and the usefulness of leveraging this investment to extend the limits of the efficient frontier.
JEL Classifications: Keywords:
CEB Working Paper N° 08/014
November 2007
Université Libre de Bruxelles – Solvay Business School – Centre Emile Bernheim ULB CP 145/01 50, avenue F.D. Roosevelt 1050 Brussels – BELGIUM
Do Leveraged Credit Derivatives Modify Credit
Allocation?
J.F. Boulier
1, M. Brière
1,2and J.R. Viala
1Preliminary Version November 13, 2007
Abstract
This paper examines how credit derivatives have changed the construction of an efficient portfolio. Credit derivatives provide a way of gaining exposure to credit risk alone, to the exclusion of interest rate risk. They also permit a relatively easy use of leverage. We examine two types of allocation: the first is a conventional investment in government bonds, corporate bonds (investment grade and high yield) and equities in the United States; the second replaces corporate bonds with credit derivatives, which may also be leveraged. We look at past data on returns, risk and correlations of these investments, and we show that the credit risk component seems to have a strongly diversifying effect relative to the traditional asset classes, i.e. equities and government bonds. We then compute efficient frontiers within a standard mean-variance framework. The results show the advantages of credit derivatives for portfolio diversification, and the usefulness of leveraging this investment to extend the limits of the efficient frontier.
1
Crédit Agricole Asset Management, Paris
2
Centre Emile Bernheim Solvay Business School Université Libre de Bruxelles.
Comments could be sent to Jean-François Boulier, jean-franç[email protected], Marie Brière, [email protected], or Jean-Renaud Viala, [email protected].
1. Introduction
Growth and liquidity in the credit derivatives market have created new investment opportunities, which this paper aims to explore. In particular, the traditional pursuit of credit exposure by holding corporate bonds or loans leads to an allocation that not only has a bearing on a diversified portfolio’s credit component but that also affects its pure interest rate component. Moreover, the fact that a cash investment is no longer required when selling a credit default swap makes it possible to increase credit exposure to levels that used to be impossible or too costly to attain. Therefore, given that the investment opportunity set has changed, it is worth looking at the new allocation that takes advantage of the newly available instruments. What, in fact, are these new investment vehicles?
There are two broad categories of instrument, the most liquid being the credit default swap, or CDS, and the most complex being structured bonds such as the collateralized debt obligation, or CDO. CDS growth has been impressive. Basically, a CDS offers the buyer protection in case of a standardized and pre-defined “credit event”, the most acute case being default.
The protection buyer pays an annual premium to the seller that broadly corresponds to the asset swap spread over the maturity of the contract. A corporate bond thus has an interest rate component equivalent to an AA+ bond (roughly the average level of the CDS counterparty) plus a CDS component where the holder of the bond receives a spread as compensation for the credit event: the holder is selling protection.
In case of a credit event, the protection buyer receives the principal of the bond upon delivery of the defaulted bond. There are many variations to this basic contract: the underlying debt can be a loan or an Asset Backed Security. Settlement may be in cash. In practice, under normal market conditions, the premium is never far from the spread over the swap rate of the corresponding debt instrument; otherwise, an arbitrage opportunity would appear. Leveraging credit exposure with CDS stems directly from the ability to sell protection several times on a single name, or to sell protection on several names. The
risk of these leveraged positions is twofold: a market risk reflects the premium variation (CDS prices) in the market influenced by either macro factors or issuer-related information; and the default risk is simply magnified when selling a single name several times, and somewhat diversified when several names are in the portfolio.
Structured bonds such as CDOs are more complex securities. A full description of these instruments is beyond the scope of this paper (interested readers may refer to Felsenheimer et al. (2006) or Credit Magazine’s Guide (2007)). At the risk of oversimplifying, the CDO is a security issued by a special purpose vehicle (SPV) whose assets consist of a portfolio of debt instruments. Cash CDOs are investments in cash bonds (or loans in case of collateralized loan obligations, CLOs) and synthetic CDOs invest in CDS or other credit derivatives (selling protection on several entities).
As with other forms of debt, the securities issued by an SPV have different levels of subordination: the equity tranche of a CDO will bear the first capital loss, while the mezzanine tranches and senior (or even super-senior) tranches are protected by their higher ranking in terms of subordination. Investors in these CDO tranches receive a higher return for the same rating given by rating agencies, mainly because they have a leveraged credit position. To demonstrate this, we will take the theoretical example of an asset portfolio consisting of 100 equally weighted names, with no recovery rate. There is no leverage in that portfolio: if ten names default, the portfolio maintains a value of nearly 90%. On the contrary, a tranche with a subordination level of less than 10% will be harmed, and possibly left with no value. Another way to measure leverage is to consider the mark-to-market change in the CDO tranche created by a parallel change in the combined credit spreads of the portfolio’s bonds. Many other structures, such as Constant Proportion Portfolio Insurance (CPPI) or Constant Proportion Debt Obligation (CPDO), exhibit similar leveraged positions that result from other mechanisms.
A question immediately arises from this explanation: why is it useful to leverage? A similar question could be asked in the case of banks, because they also have leveraged positions in credit, limited formerly by the Cooke ratio and now by the Basel II rules.
A simple answer to this crucial question is that investors should refrain from leveraging if it is no longer profitable. Assuming that default probabilities are stable over time and the recovery rate is known (or equivalently that the loss distribution is known and stable), the expected cost of default can be assessed by simple calculation. Therefore, if the average spread earned on the portfolio exceeds that cost, it is useful to leverage up to a level corresponding to the risk budget. Of course, such a stable situation does not exist: the business cycle, competition, mismanagement and unexpected risks blur our view of the future. The spread thus also reflects the market’s perception of future risks.
Spread volatility may affect mark-to-market vehicles, but not those that need be marked down only in case of certain and irreversible losses. So market risk does not affect all investment structures in the same way. In this study, however, we shall take the most conservative approach of keeping mark-to-market discipline, even though market prices can depart widely from fundamental credit values, as downgrades to junk rating show.
There is ample statistical evidence (Altman (2000), Kozlemiankin (2007) and Gibson (2007)) that credit spreads in the spring of 2007 – though very narrow in relation to their historical averages – may significantly differ from the historical average cost of default. This shows the existence of an additional component from credit rationing, or a pure credit risk premium, which accounts for credit uncertainties, in spreads or in default (or in credit events in general). When this extra premium is considered in relation to the above-mentioned risk, the credit component may appear very attractive indeed compared to other asset classes. And if one simply assumes similar Sharpe ratios, the low and sometimes negative correlation of the credit component’s return with other returns might lead to a sizeable allocation to credit.
This paper investigates first the return, risk and correlation components of a conventional credit investment in corporate bonds and of credit derivatives, in the U.S. market. Then, applying standard mean-variance optimization, it compares classic credit allocation to leveraged credit derivative allocation. Finally, we discuss the inherent limitations of such an exercise and mention some possible developments.
2. Return, risk and correlations
We examine two types of allocations in the United States: the first, a diversified allocation among government bonds, corporate bonds (investment grade and high yield) and equities, and the second, replacing direct investment in corporate bonds with credit derivatives so as to leverage the credit allocation. This section aims to present the data and examine returns, risks and correlations for each asset class.
2.1. Data
The study period extends from April 1995 to June 2007. The database is composed of weekly returns in U.S. dollars. government bonds are represented by Datastream’s ten-year benchmark indices. These indices include coupon income, and are generally based for a given month on the last bond issued by the U.S. Treasury for a given maturity. Factors including liquidity, issue size and coupon are also taken into account. For corporate bonds, two categories were studied: investment-grade bonds, rated AAA to BBB, and high-yield bonds, rated BB to CCC. These indices exclude convertible bonds and include coupon income. Price data is from closing quotes supplied by Merrill Lynch’s trading desk.
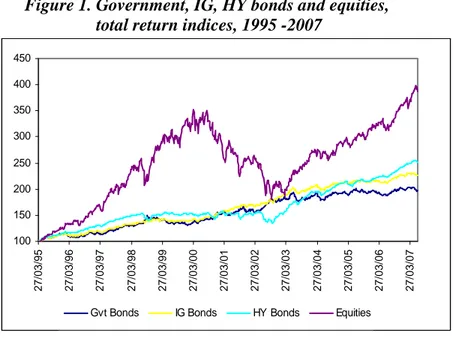
Figure 1 shows the total performance of the four assets. We note the relatively stable outperformance of investment-grade bonds in relation to government bonds. In contrast, high-yield indices dropped sharply from 2000 to 2002 after the stock market crash (default rates grew very rapidly in this market, from 1.6% in 1998 to 5.1% in 2000 and finally 12.8% in 2002). They recovered fairly fast after 2002, to attain better performance than investment-grade bonds for the period as a whole, consistent with the ordering of risk premiums.
Figure 1. Government, IG, HY bonds and equities, total return indices, 1995 -2007
The second type of allocation involves using credit derivatives to replace direct investment in corporate bonds. In the CDS example, performance is measured in the same way as that of cash, plus the CDS’s possibly leveraged performance. Unfortunately, CDS data is limited, and none exists before 2004. To work with the longest possible period, we approximated CDS performance by using credit spreads, i.e. corporate bond yields minus yields on swaps of the same maturity. In doing so we neglect basis spread but we are comforted in doing so since the difference between this approximation and CDS spreads (Figure 2) has been very small since 2004, when the data series for credit derivatives begins.
Figure 2. Monthly returns of 5-year iTraxx and 5-year credit spread, 2004-2007
100 150 200 250 300 350 400 450 2 7 /03/ 95 2 7 /03/ 96 2 7 /03/ 97 2 7 /03/ 98 2 7 /03/ 99 2 7 /03/ 00 2 7 /03/ 01 2 7 /03/ 02 2 7 /03/ 03 2 7 /03/ 04 2 7 /03/ 05 2 7 /03/ 06 2 7 /03/ 07
Gvt Bonds IG Bonds HY Bonds Equities
-0.006 -0.002 0.002 0.006 0.01 0.014 02 /0 7/ 200 4 02 /1 0/ 200 4 02 /0 1/ 200 5 02 /0 4/ 200 5 02 /0 7/ 200 5 02 /1 0/ 200 5 02 /0 1/ 200 6 02 /0 4/ 200 6 02 /0 7/ 200 6 02 /1 0/ 200 6 02 /0 1/ 200 7 02 /0 4/ 200 7
Figure 3 shows the total performance of our four assets, but here the corporate investment-grade and high-yield bonds have been replaced by an investment in credit derivatives. The performance of this investment was approximated by three-month money market rates plus the performance of the investment-grade or high-yield credit spread versus same-duration swap. Note the low return, linked to the weak volatility of credit spreads in relation to the other two asset classes. Hence the attraction, which we shall examine later, of leveraging these two asset classes.
Figure 3. Government bonds, IG, HY credit spreads and equities, total return indices, 1995 – 2007
2.2. Risk, return and correlations
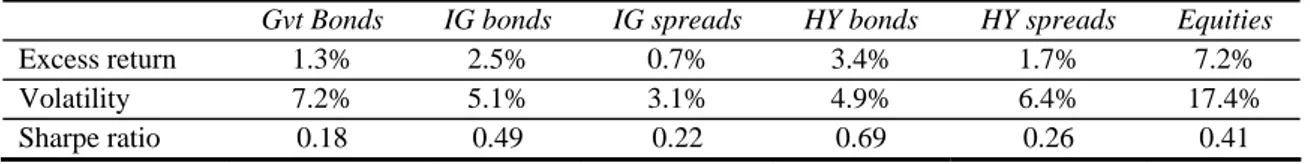
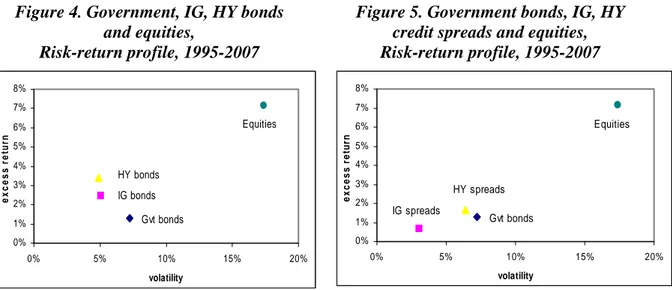
Table 1 summarizes historic annualized excess returns, volatilities and Sharpe ratios (estimated for 1995-2007) for each of the asset classes in this study. Figure 4 presents the risk-return profile of the four traditional asset classes (government bonds, investment-grade bonds, high-yield bonds and equities). Figure 5 presents the same profile, with credit analyzed by means of the investment in credit spreads.
Table 1: annualized excess returns, volatilities and Sharpe ratios of the six asset classes, 1995-2007
Gvt Bonds IG bonds IG spreads HY bonds HY spreads Equities
Excess return 1.3% 2.5% 0.7% 3.4% 1.7% 7.2% Volatility 7.2% 5.1% 3.1% 4.9% 6.4% 17.4% Sharpe ratio 0.18 0.49 0.22 0.69 0.26 0.41 50 100 150 200 250 300 350 400 450 27 /03/199 5 27 /03/199 6 27 /03/199 7 27 /03/199 8 27 /03/199 9 27 /03/200 0 27 /03/200 1 27 /03/200 2 27 /03/200 3 27 /03/200 4 27 /03/200 5 27 /03/200 6 27 /03/200 7
Figure 4. Government, IG, HY bonds and equities,
Risk-return profile, 1995-2007
Figure 5. Government bonds, IG, HY credit spreads and equities, Risk-return profile, 1995-2007
The annualized mean of government bonds’ excess return over three-month rates is around 1.3%. Corporate bonds exhibit somewhat larger excess returns, with a risk premium over money market rates between 2.5% (investment grade) and 3.4% (high yield). Surprisingly, corporate bonds are less volatile than government bonds during the sample period. In all, their historical Sharpe ratios (0.49 for investment grade, 0.69 for high yield) are particularly attractive when compared with government bonds (0.18) and equities (0.41).
Investment-grade credit spreads provide only about half the return of government bonds (0.7% compared with 1.3%) but also have less than half the volatility. High-yield spreads, on the other hand, are almost identical to government bonds in terms of returns and volatilities. Sharpe ratios for these two asset classes are respectively 0.22 and 0.26 over period of our study. They are very close to 0.18 for Treasuries.
Table 2 shows the average correlations between government bonds, corporate bonds (investment grade and high yield) and equities for the period 1995-2007, while Table 3 shows the same correlations, but with corporate bonds replaced by an investment in credit spreads via credit derivatives.
0% 1% 2% 3% 4% 5% 6% 7% 8% 0% 5% 10% 15% 20% volatility excess r e tu rn HY bonds IG bonds Gvt bonds Equities 0% 1% 2% 3% 4% 5% 6% 7% 8% 0% 5% 10% 15% 20% volatility excess r e tu rn HY spreads IG spreads Gvt bonds Equities
Table 2. Government, IG, HY bonds and equities,
Correlation matrix, 1995 – 2007
Table 3. Government bonds, IG, HY credit spreads and equities, Correlation matrix, 1995 – 2007
In the classic fixed-income approach, corporate bonds are always positively correlated with other asset classes (Table 1). The correlation is very strong for investment-grade bonds and Treasuries (94%), since both asset classes are exposed primarily to interest rate risk, and weaker for high-yield bonds and Treasuries (16%). Correlations between corporate bonds and equities are moderate but positive (2% for investment grade and 30% for high yield). High-yield bonds actually behave midway between investment-grade bonds and equities. Probably because they are especially vulnerable to credit risk, they correlate less with Treasuries than with investment-grade bonds (16% versus 38%), and more with equities (30% versus 2%).
An investment through credit derivatives, which allows the investor to take a position solely on the credit spread component of corporate bonds without exposing himself to interest rate risk, has the advantage of much weaker, even negative correlation with Treasuries (-34% for investment grade and -63% for high yield), and therefore higher diversification potential. As in the traditional approach, credit derivatives are very weakly correlated with equities (8% for investment grade and 26% for high yield). Note that leveraging the credit asset classes would not change the correlation profile.
Gvt bonds IG spreads HY spreads Equities Gvt bonds 100.0% -34% -63% -7% IG spreads -33.8% 100.0% 64% 8% HY spreads -62.8% 63.8% 100.0% 26% Equities -6.6% 8.4% 25.7% 100.0% Gvt bonds IG bonds HY bonds Equities Gvt bonds 100.0% 94% 16% -7% IG bonds -33.8% 100.00% 38% 2% HY bonds -62.8% 37.90% 100.00% 30% Equities -6.6% 8.4% 25.7% 100.0%
3. Traditional credit investment compared to leveraged credit derivatives
Having analyzed correlations in the preceding section, we can now compute efficient frontiers for a portfolio composed of our four assets: (1) in a traditional allocation, with the investment in credit achieved by means of corporate bonds, and (2) in an allocation via credit derivatives. The goal of this section is to show how the use of credit derivatives, with ability to leverage, modifies the efficient frontier.
3.1 Traditional corporate bond allocation versus investment in credit derivatives
We are operating within the framework of a classic mean-variance portfolio optimization, with a no-short selling constraint. One difficulty of this type of exercise is that the attractiveness of each asset class depends crucially on its expected return. A large number of portfolio optimization studies have shown that the optimal weightings are highly sensitive to small changes in expected returns. For our purpose here, we have not made return predictions, and we have assumed that each asset class produces a higher return than the risk-free rate, in an amount exactly proportional to its volatility, i.e. that the Sharpe ratios are constant for each asset class. The Sharpe ratio was arbitrarily set at 0.3. This is an intermediate level between the historic levels of the ratio for Treasury bonds (0.18) and equities (0.41) during the period, and is fairly close to levels for credit spreads (0.22 for investment grade and 0.26 for high yield).
This hypothesis, though strong, has the advantage of making our portfolio composition depend only on the assets’ risk profile, not on the outlook for expected returns. The results would remain unchanged overall for another Sharpe ratio level (within one homothetic transformation of the returns obtained for each level of risk selected, the relationship between the two frontiers remaining unchanged). The optimal weight of each asset is also completely independent of the level of the Sharpe ratio.
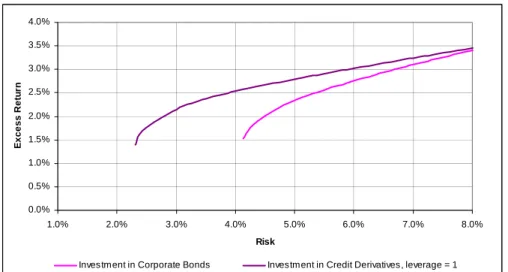
Figure 6 shows the two efficient frontiers calculated from the four assets. In the first, the credit investment is achieved conventionally through corporate bonds. In the second, the
investment in credit is made through credit derivatives, which are not leveraged. Tables 4 and 5 show the optimal allocations obtained in each of the two types of allocation, for three overall portfolio risk levels (3%, 5% and 7%), as well as the excess return of the resulting portfolio.
Figure 6. Efficient frontiers, (1) investment in Corporate Bonds, (2) investment in credit derivatives (non-leveraged)
Table 4. Optimal allocations obtained for 3 levels of portfolio risk, investment
in Corporate bonds
Table 5. Optimal allocations obtained for 3 levels of portfolio risk, investment
in credit derivatives Portfolio Risk 3.0% 5.0% 7.0% Excess Return - 2.3% 3.1% Optimal Weights Gvt bonds - 43% 59% IG bonds - 0% 0% HY bonds - 42% 8% Equities - 15% 32%
These initial results show that even without leveraging the credit allocation, we improve the efficient frontier by investing in credit derivatives. With derivatives, we achieve more attractive risk / return profiles. By including a substantial share of investment-grade credit spreads, which are much less volatile than traditional bonds, we can achieve much lower
Portfolio Risk 3.0% 5.0% 7.0% Excess Return 2.1% 2.8% 3.2% Optimal Weights Gvt bonds 45% 45% 44% IG spreads 4% 0% 0% HY spreads 47% 32% 20% Equities 5% 23% 37% 0.0% 0.5% 1.0% 1.5% 2.0% 2.5% 3.0% 3.5% 4.0% 1.0% 2.0% 3.0% 4.0% 5.0% 6.0% 7.0% 8.0% Risk E x ce ss Re tu rn
risk levels for the portfolio (between 2.3% and 4.1%) than were allowable under the traditional allocation. At higher risk levels, the share invested in investment-grade bonds disappears in favor of high-yield bonds, which are riskier and generate more attractive returns. Thus we see the significant interest in credit derivatives in terms of portfolio diversification. Given the weak correlation between high-yield spreads and other asset classes (-63% with Treasuries, 26% with equities), investment in credit derivatives allows for a larger share of risky assets in the portfolio for a given risk level than would be possible through high-yield bond investing.
Theses optimal allocation neglect IG instruments. The bond allocations favors HY bonds which are less correlated with government bonds (see Table 2) and have a higher Sharpe ratio (see Table 1). The derivative allocation favors HY spreads in spite of their lower Sharpe ratio (see table 1) except at very low risk levels because of their high anti-correlation to government bonds.
So credit derivatives, which make it possible to separate credit risk from interest rate risk and to invest in the credit spread alone, have two advantages compared with a direct investment in corporate bonds. The ability to separate risk components allows better diversification, as we saw in the preceding section. Thus, at a given risk level, credit spreads are decorrelated to a greater extent from Treasuries than corporate bonds, making it possible to diversify the portfolio more effectively. They can also capture very low risk levels through the use of investment-grade spreads, which have very little volatility.
3.2 Influence of leverage
One of the possibilities offered by credit derivatives is the ability to leverage the investment simply. Thus, for each dollar invested, it is possible to borrow (L-1) dollars at the risk-free rate, and to invest the L dollars in credit derivatives. For example, when leverage is 2, this means that 100% of the initial capital allocated to credit derivatives is borrowed, in order to multiply by 2 the exposure to these instruments.
When the degree of leverage is L, the return on the leveraged investment becomes: r(L)=rf +L*(r−rf)
where r is the risk-free rate and r the return of the non-leveraged asset. f
Thus, if the asset’s return is greater than the risk-free rate, the fact of having leveraged the position will improve the investment’s return. This increase in return is paid for by a proportional increase in the risk of the leveraged investment:
σ(L)=L*σ
Finally, the Sharpe ratio of a leveraged investment is identical to that of the initial asset. In fact: σ σ σ ) ( * ) ( * ) ( ) ( ) ( f f r rf L r r L L r L r L SR = − = − = −
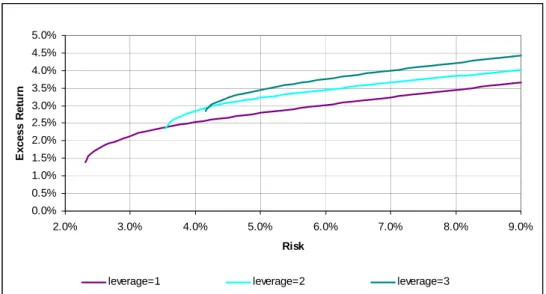
What does leveraging the investment in credit derivatives add under these conditions? Figure 7 shows the efficient frontiers obtained by investing in the four assets. Only the two positions in investment-grade and high-yield credit derivatives are leveraged, and we examine two examples of leverage (2 and 3), which we compare to the non-leveraged portfolio. Tables 6 and 7 show, as before, these optimal allocations corresponding in the two leveraged cases to risk levels of 3%, 5% and 7%.
Figure 7. Efficient frontiers, investment in credit derivatives, depending on the degree of leverage (1, 2 and 3)
Table 6. Optimal allocations obtained for 3 levels of portfolio risk, investment
in credit derivatives, leverage =2
Table 7. Optimal allocations obtained for 3 levels of portfolio risk, investment
in credit derivatives, leverage =3
Portfolio Risk 3.0% 5.0% 7.0% Excess Return - 3.2% 3.7% Optimal Weights Gvt bonds - 50% 35% IG bonds - 0% 0% HY bonds - 35% 36% Equities - 16% 29%
It will come as no surprise that the fact of leveraging the investment in credit derivatives increases portfolio risk and permits higher returns. As in traditional allocation, it is impossible to achieve a 3% risk level with leverage of 2 or 3. However, for risk levels of 5% or 7%, we can achieve superior returns by leveraging. For example, for an identical 5% risk level, we obtain a return of 3.2% with leverage of 2, and 3.5% with leverage of 3, compared to 2.3% in the traditional allocation and 2.8% with allocation via non-leveraged credit derivatives. Furthermore, at an identical risk level, the higher the degree of leverage,
Portfolio Risk 3.0% 5.0% 7.0% Excess Return - 3.5% 4.0% Optimal Weights Gvt bonds - 62% 46% IG spreads - 0% 0% HY spreads - 28% 34% Equities - 10% 20% 0.0% 0.5% 1.0% 1.5% 2.0% 2.5% 3.0% 3.5% 4.0% 4.5% 5.0% 2.0% 3.0% 4.0% 5.0% 6.0% 7.0% 8.0% 9.0% Risk E x ce ss R e tu rn
the more we can reduce the share of risky assets in the portfolio in favor of Treasuries. Therefore, for a risk level set at 5% of the portfolio, it is optimal to include 50% Treasuries, while we would raise that level to 62% if leverage is 3.
Optimal allocations contain a preponderant weighting in Treasuries (between 35% and 50% with leverage of 2, between 46% and 62% for leverage of 3), with high-yield bonds coming next (around 30%) and finally equities (between 16% and 29% with leverage of 2, between 10 and 20% with leverage of 3). If we raise the desired level of risk for the portfolio, the Treasury weighting decreases, as expected, in favor of high-yield bonds and equities. Optimal portfolios for high risk levels favor leveraged high-yield credit spreads over investment-grade spreads, because of high-yield spreads’ greater decorrelation with government bonds.
The ability to leverage credit derivatives easily in a portfolio therefore presents undeniable advantages for investors, allowing them to adapt risk very flexibly to the desired level. However, it is important to emphasize once again the limits of this exercise, which does not take expected return into account and which only considers historical correlations and volatilities of the pertinent asset classes. It would be interesting to go one step further and examine the changes that various assumptions concerning expectations would introduce in this framework.
4. Conclusion
The emergence of credit derivatives and the ability to leverage this asset class offer interesting opportunities for portfolio diversification, as the very simple example presented in this study shows. By providing exposure to credit risk alone, without incurring interest rate risk, credit derivatives have a much greater diversifying power in an overall portfolio than traditional corporate bonds. They also allows for lower risk levels, via investment in the investment-grade credit risk component, which has very low volatility. They thus provide a way to extend the efficient frontier. Leveraging the credit investment further allows very flexible risk modulation and potentially superior risk /
return levels. Indeed, there is nothing really new in this outcome. As Sharpe (1964) showed, adding the capacity for leverage to a portfolio of risky asset changes the efficient frontier. More recently, Markowitz (2005) illustrated the change in asset allocation introduced by certain changes in the typical constraints faced by investors.
Our study relies heavily, as usual, on the data and additional assumptions on returns. We selected the strong hypothesis of identical Sharpe ratios for all asset classes, to facilitate optimal portfolio composition independent of the expected returns and to concentrate our study on the effects of correlations and volatilities. A useful extension of this work would be to make more realistic assumptions about expected returns and examine the impact on asset allocation. Although the assumptions we used were somewhat simplistic, we believe that the results are qualitatively robust with respect to many changes that could be introduced into the modeling framework that we have chosen.
Another clear limitation of the above result comes from the statistical distribution assumption that is implicitly made. Credit spreads tend to exhibit spikes and long periods of relatively low values. Another risk measure like VaR or conditional VaR would undoubtedly take better account of the asymmetric nature of credit spread patterns across the cycle and also of the specific component represented by a particular issuer.
Credit crises were not completely absent in our sample period (which includes the 2001-2002 corporate scandals), but they should be investigated in more details. As the recent subprime lending crisis has shown, such events have a clear influence on investor attitudes and therefore on credit premiums. The behavior of credit derivatives in times of market stress and the consequences for asset allocation remain a promising area for investigation.
References
Altman, Robert, 1989, Default Risk, Mortality Rates and the Performance of Corporate Bonds, Journal of Finance, p 909 - 922
Kozhemiakin, Alexander, 2007, The Risk Premium of Corporate Bonds, Journal of Portfolio Management, p 101 – 109
Gibson, Michael, 2007, Credit Derivatives and Risk Management Working Paper, Division of Research and Statistics, Federal Reserve Board
Longstaff, F, S. Mithal and E. Neis, 2005, Corporate Yield Spreads: Default Risk or Liquidity? New Evidence from the Credit Default Swap Market. Journal of Finance, p. 2213 – 2253
Rappoport, Peter, 1999, Valuing Credit Fundamentals: Rock Bottom Spreads – JP Morgan Research
Sharpe, William, 1964, Capital Asset Prices: A Theory of Market Equilibrium under Conditions of Risk. Journal of Finance, p. 425 - 441
Markowitz, Harry, 2005, Market Efficiency: A Theoretical Distinction and So What? Financial Analyst Journal, p. 17 – 30
The 2007 ABC of CDOs, Credit Magazine’s Guide, published in association with Calyon
Jochen Felsenheimer, Philip Gisdakis and Michael Zaiser, 2006, Active Portfolio Management, Wiley, 581 p.