ISSN: 1693-6930, accredited First Grade by Kemenristekdikti, Decree No: 21/E/KPT/2018
DOI: 10.12928/TELKOMNIKA.v18i4.13073 2101
SVC device optimal location for voltage stability enhancement
based on a combined particle swarm optimization-continuation
power flow technique
Oum El Fadhel Loubeba Bekri1, Abdellah Chehri2, Tounsia Djamah3, Mohamed Karim Fellah4 1Electrotechnical Engineering Lab., Electrical Engineering Department, Dr. Moulay Tahar University, Algeria
2Department of Applied Sciences, University of Quebec in Chicoutimi UQAC, Canada 3L2CSP Laboratory, Mouloud Mammeri University, Algeria
4Intelligent Control & Electrical Power Systems Laboratory, University of Djillali Liabès, Algeria
Article Info ABSTRACT
Article history: Received May 11, 2019 Revised Feb 2, 2020 Accepted Feb 15, 2020
The increased power system loading combined with the worldwide power industry deregulation requires more reliable and efficient control of the power flow and network stability. Flexible AC transmission systems (FACTS) devices give new opportunities for controlling power and enhancing the usable capacity of the existing transmission lines. This paper presents a combined application of the particle swarm optimization (PSO) and the continuation power flow (CPF) technique to determine the optimal placement of static var compensator (SVC) in order to achieve the static voltage stability margin. The PSO objective function to be maximized is the loading factor to modify the load powers. In this scope, two SVC constraints are considered: the reference voltage in the first case and the total reactance and SVC reactive power in the second case. To test the performance of the proposed method, several simulations were performed on IEEE 30-Bus test systems. The results obtained show the effectiveness of the proposed method to find the optimal placement of the static var compensator and the improvement of the voltage stability.
Keywords: FACTS devices Optimal location PSO-CPF technique Static var compensator Voltage stability
This is an open access article under the CC BY-SA license.
Corresponding Author: Oum el Fadhel Loubeba Bekri, Electrical Engineering Department, Dr. MoulayTahar University,
BP 138 cité Ennasr 20000, Saida, Algeria. Email: loubabab@yahoo.fr
1. INTRODUCTION
The study of voltage behavior in power grids has become a significant concern for the operators and planners of these systems. Several widespread incidents around the world have been associated with voltage instabilities. This mode of uncertainty is not yet well-controlled, compared to the method of angular instability (dynamic and transient). Indeed, the mechanism causing voltage instability seems to be one of the most critical issues to be clarified. Even today, there is no widely available and widely accepted theory for analyzing voltage stability. The problems linked to this type of instability then constitute, in several countries, a central axis of research. Power systems are vulnerable to voltage instability due to unpredictable power demand. The strategy requires that the system remain in a secure operating state under abnormal conditions [1]. The electric power systems are stressed caused by an increased and fluctuating loading. This leads to the overloading of transmission lines, voltage instability, and could contribute to voltage collapse blackouts [2]. In fact, blackouts in power networks are mainly the result of a miscellaneous process that involves several factors [3].
The instability of tension plays a major role in the occurrence of these extraordinary events. Some important identation examples of these incidents are reported in [4-8].
The blackout in Denmark and Sweden reported on september 2003 [4]. The system disturbance that affected Algeria power network in February 3, 2003 [5]. Another major blackout was reported on mid August 2003 that affected the northeastern and midwestern of United States, and the Canadian province of Ontario. The high reactive output power, due to the contact with trees, caused the initial disturbances [6]. The disturbance that affected the electrical power network of Italy system in September 28, 2003 [7]. The Moscow’s system disturbance of 25 May 2005, the Brazil’s system disturbance of November 10, 2009, the Tokyo system disturbance of March 11, 2011, and the India’s system disturbance of July 31, 2012 [8] are few examples.
New monitoring techniques make it possible to improve the control of transits on existing transmission lines and increase network transport capacities (loadability). These technological solutions are based on power electronics are generally called FACTS, an acronym of "Flexible Alternative Current Transmission Systems". The FACTS was born in the 1970s, and certain technologies are currently installed on the electrical network. Thus, the SVC (static var compensator) and their improvements, the STATCOMs (known as static synchronous compensator) are the most mature technologies. The goal of their development is to allow better voltage control in normal operation and in case of faults. The optimal positioning of FACTS devices in a network is a combinatorial problem. To this day, there is no analytical method that can solve this kind of problem and give the overall optimum. Therefore, tools such as the metaheuristic algorithm have been used. Evolutionary algorithms (EA), such as the particle swarm, genetic algorithm, and differential evolution, have been commonly used in the power system. These algorithms were originally used for optimizing single-objective problems. In addition, evolutionary methods provide more flexibility in handling the complexities in objective functions and constraints. Poorly known just a few years ago, optimal positioning and sizing of FACTS devices is considered to improve electrical network loadability. Enhancing network loadability is crucial in modern electrical grids. FACTS devices are used to reduce short circuit currents and to enhance both transient and steady-state stability. Several approaches have been proposed for the optimal placement of the FACTS`s devices using different conventional and metaheuristic optimization methods.
The authors in [10] proposed two approaches to identify the placement of the FACTS controller of the suitable nodes to ensure voltage stability. The first technique is based on the topological structure of power networks, while the seond technique is based on the conventional power flow [10]. In [11], a multi-objective allocation problem of FACTS devices is solved by two-hybrid approaches; 1) non-dominated sorting particle swarm optimizer (NSPSO) combined with the fuzzy logic, 2) non dominated sorting genetic algorithm II (referred as NSGA-II) combined with the fuzzy logic. In this work, power loss, 𝐿 index voltage stability, and voltage deviation are optimized simultaneously. The goal of [12] is to find the optimal location and setting parameters of SVC and thyristor controlled series capacitor (TCSC) devices, using PSO to mitigate small signal oscillations in multi-machine power systems.The authors in [13] present the application of particle swarm optimization to determine the optimal position of the FACTS devices in the most cost-effective manner.
The optimal placement of STATCOMs is suggested in [14].Through the simultaneous application of PSO and CPF in order to improve the voltage profile to efficiently minimize power losses and to maximize system loadability. The continuation power flow (CPF) method allows calculating the static voltage stability margin when only the STATCOMs size is considered. The PSO and the general algebraic modeling system (GAMS) were also adopted to obtain location and rating of D-STATCOM for voltage stability margin enhancement [15]. In the literature, CPF has been used to solve the problem of the singularity near the stability limit of the conventional power flow algorithms. The authors in [16] investigate the voltage stability assessment using static VAR compensation (SVC) and thyristor controlled series capacitor (TCSC) controllers. The effect of SVC and TCSC sizing in the loading margin was also evaluated [17].
The aim of this paper is to determine the optimal placement of the most popular FACTS devices, namely the SVC. The PSO objective function which contains a term that needs to be maximized is the loading factor. The optimization procedure was executed under one and three SVC constraints. In the first step, we consider only the reference voltage constraint and in the second step, three constraints are taken into account, the reference voltage, the reactance and the SVC reactive power in the purpose to maximize the load level and minimize the total losses power system and flattening the voltage of the buses. To the best of our knowledge, this is the first study that addresses the problem of finding an optimal location of the SVC`s device under those optimization constraints. The remainder of this paper is organized as follows: section 2 introduces the voltage stability analysis. Particle swarm optimization is presented in the section 3. The problem is formulated in section 4. The simulation results are analyzed and discussed in section 5. Finally, our contributions and conclusions are given in section 6.
2. VOLTAGE STABILITY ANALYSIS 2.1. Bifurcation parameter
Bifurcation theory is concerned with the study of topological type changes in the trajectories solution of a non-linear dynamic system when the control parameters vary. It focuses mainly on the evolution of equilibrium periodic orbits (which constitute asymptotic states), their multiplicity and their stability properties [16-18]. Parameter estimation is a complementary function of the state estimator necessary to ensure its robustness and reliability. These parameters are used in several advanced functions of network control, such as for example: contingency analysis, monitoring of safety limits, optimal power flow, etc. In this theory, the system equations depend on these parameters, as (1).
𝑓(𝑦, 𝜆) = 0 (1)
The parameter (λ) is used to reproduce the load changes that drive the power systems to voltage collapse. The load power is modified as:
𝑃𝐿𝑖 = 𝑃𝐿𝑖0(1 + 𝜆𝐾𝐿𝑖) (2)
𝑄𝐿𝑖 = 𝑄𝐿𝑖0(1 + 𝜆𝐾𝐿𝑖) (3)
𝑓represents the power flow equations, 𝑦 is dependent variables, (λ) is the loading parameter, 𝑃𝐿𝑖0𝑛
and 𝑄𝐿𝑖0 represent the active and reactive powers at the basic operating point respectively. 𝐾𝐿𝑖 interpret
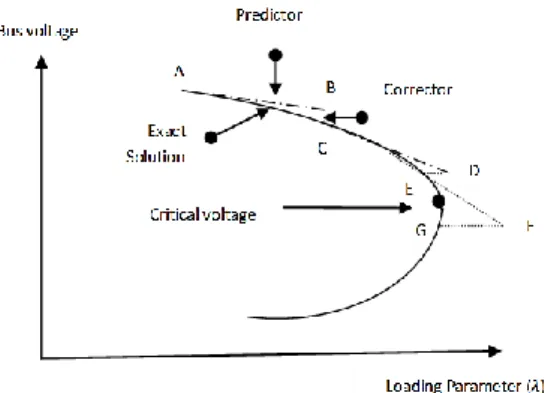
the changing of active and reactive power at bus i as (λ) varied. In a typical bifurcation diagrams, the voltages are represented as functions of the system loadability measurement (λ). This representation is called P-V or nose curves, as shown in (2), and they are widlely used in the continuation power flow (CPF) analysis. 2.2. Continuation power flow CPF
Power systems P-V curves and the maximum loading parameter are calculated using extensively CPF techniques. Thus, an iterative process is used. This process in a discrete context comprises 2 stages, the prediction (predictor step) and the update (corrector step). The idea is to obtain a better estimate for each sample of time 𝑡. Figure 1 illustrates the iterative process; from a known initial position A, also called solution A, a tangent predictor is used to estimate a new solution for a specified pattern of load increase (called solution B). While the system load assumed to be fixed, a corrector step (update iteration) is used to determined the exact solution (or solution C) by using a conventional power flow analysis. This process is iterated until the desired P–V curve is obtained. In order to optimize the calculated loading parameter, we have developed an optimization algorithm by combining the CPF and PSO, which is described in the following section.
Figure 1. An illustration of the CPF technique
3. PARTICLE SWARM OPTIMIZATION
Swarm intelligence (SI) refers to a distributed computing paradigm based on collective intelligence that emerges from the cooperation of multiple autonomous agents. The SI applies concepts based on the fodder of ant colonies and the grouping of social animals such as birds using agent-based calculations. The three major paradigms of Swarm Intelligence are: “Ant Colony Optimization”, “Particle Swarm Optimization”, and robotic swarms (“Swarm Robototics“ or SR) [19]. The optimization by a swarm of particles is based on a set of individuals originally arranged randomly and homogeneously, which we will henceforth call particles, which move in the hyperspace of research and constitute, each a potential solution. Each particle has a memory concerning its best-visited solution as well as the ability to communicate with the particles constituting its
surroundings. From this information, the particle will follow a tendency made, on the one hand, of its will to return to its optimal solution, and on the other hand, of its mimicry compared to the solutions found in its vicinity. From local and empirical optimums, the set of particles will normally converge towards the optimal global solution of the problem treated. The PSO is a substitute to genetic algorithms and ant colonies for the optimization of non-linear functions [20].
Binary string coding is a modification of the PSO algorithm to solve problems with solution elements with binary values. The meaning of the speed variable has been changed to indicate the probability of the corresponding solution element with a value of 0 or 1. The speed is updated in the same way as for the classic PSO. No coefficient of inertia is used. The performance of each particle (i.e., its proximity to the global optimum) is measured by means of an objective function, which varies with the optimization problem [20]. As with other swarm algorithms, choosing the right parameters is important for efficient PSO execution. Considerable work has been done to select a combination of values that work well across a wide range of issues. Let’s consider χ and υ as the coordinates and velocity of the particle, respectively. The particles move to take into account their best position and best vicinity (panurgic displacement), this will repeated for each iteration. The position of each particle in the next step is then evaluated as the sum of its current position and the speed is represented as 𝑝𝐵𝑒𝑠𝑡.
The index of the best particle is represented as 𝑔𝐵𝑒𝑠𝑡; then the swarm can be carried out by solving the following update equations:
𝜐𝑑+1= 𝑊𝑖∙ 𝜐𝑑+ 𝜑1∙ rand(∙) ∗ (pBest − 𝜒𝑑) + 𝜑2∙ rand(∙) ∗ (gBest − 𝜒𝑑) (3)
𝜒𝑑+1= 𝜒𝑑+ 𝜐𝑑+1 (4)
where d is the iterations index, 𝜒𝑑 is the current particle position at the dth iteration. 𝜐𝑑 is
the particle velocity at the dth iteration. 𝑊
𝑖 represents the inertia weight factor, 𝜑1 and 𝜑2 are acceleration
constant. rand(∙) is uniformly distributed random number in the interval [0,1], 𝑖𝑡𝑒𝑟𝑚𝑎𝑥 represents
the maximum number of iterations while iter is the number of the iterations until the current stage. Proper selection of the inertia weight 𝑊𝑖 provides a balance between the global and the local exploration. The 𝑊𝑖
is set according to (5). Additionally, Figure 2 illustrates the PSO particles behavior. Wi= Wimax−
Wi max−Wi min
Itermax × Iter (5)
At first glance, it seems that several parameters have been considered for the PSO algorithm. However, several of those parameters can be fixed in advance; others, on the contrary, can only be defined empirically. This is the case with the swarm population size. There is no rule to determine this parameter; doing many tests allows you to gain the experience necessary to understand this parameter. We must also consider the initialization of the swarm; it is generally done randomly according to a uniform distribution on [0,1]. In the above procedure, the particle velocity is limited by the maximum value υmax. Two other important parameters are the confidence coefficients previously named 𝜑1 and 𝜑2 (also called acceleration constant).
They make it possible to balance the tendencies of particles to follow their conservation instinct. Similarly, an important parameter to take into account is the coefficient of inertia (𝑊𝑖) in the formula seen before. It defines the exploration capacity of each particle in order to improve the convergence of the method. Setting this parameter amounts to finding a compromise between a global exploration (𝑊𝑖>1) and a local exploration (𝑊𝑖<1). It represents the adventurous instinct of the particle [21-23]. Thus, a suitable selection of the inertia weight 𝑊𝑖 using (5) allows achieving a better exploration of the search space.
4. PROBLEM FORMULATION 4.1. Objective function
Throughout the previous section, we have seen the theoretical aspects of swarm intelligence, and more specifically, PSO. The usual application of PSO remains optimization. From the moment when the semantics of the problem to be solved can be expressed in the form of a function to be optimized, the PSO applies. In this paper, an optimization process is used is to obtain an efficient utilization of the existing power network with SVC optimal location. In this scope, the cost function that need to be maximized can be written as:
Maximize(λ) (6)
4.2. SVC modeling
The time constant regulator is assumed to be known using the model described in Figure 3. The absolute reactance bSVC is well defined. The following differential equation can be used [24]:
ḃ𝑆𝑉𝐶=
(𝐾𝑟(𝑉𝑟𝑒𝑓+𝑉𝑠𝑃𝑂𝐷−𝑉)−𝑉𝑆𝑉𝐶)
𝑇𝑟 (7)
The total reactive power introduced at the SVC device is expressing as follows [24-25]:
𝑞 = b𝑆𝑉𝐶𝑉2 (8)
where V is bus voltage magnitude, V𝑠𝑃𝑂𝐷is the signal output of the power oscillation damper, 𝑉𝑟𝑒𝑓is reference
voltage, 𝐾𝑟 is regulator gain, 𝑇𝑟 is regulator time constant, bmax is maximum susceptance, bmin is minimum
susceptance and bSVC is total reactance. The optimization process maximizes (λ) while satisfying the following
inequality constraint.
Figure 3. The structure of the SVC
4.3. Equality constraints
The typical load flow equations can be given by:
𝑃𝐺𝑖− 𝑃𝐷𝑖− 𝑉𝑖∑𝑁𝐵𝑗=1𝑉𝑗[𝐺𝑖𝑗cos(𝛿𝑖− 𝛿𝑗) + 𝐵𝑖𝑗sin(𝛿𝑖− 𝛿𝑗)]= 0 , i = 1, … , NB (9)
Q𝐺𝑖− Q𝐷𝑖− 𝑉𝑖∑𝑁𝐵𝑗=1𝑉𝑗[𝐺𝑖𝑗sin(𝛿𝑖− 𝛿𝑗) + 𝐵𝑖𝑗cos(𝛿𝑖− 𝛿𝑗)]= 0 , i = 1, … , NB (10)
where 𝑃𝐺 and 𝑄𝐺 are respectively the real and reactive power generator. 𝑃𝐷 and 𝑄𝐷are respectively
the real and reactive power load. 𝐺𝑖𝑗and 𝐵𝑖𝑗 are respectively the transfer conductance and susceptance between
bus 𝑖 and bus 𝑗 while NB represents the number of buses of the electric network. 4.4. Inequality constraints
An optimization problem with constraints is a combinatorial problem where we want to maximize an objective function. We, therefore, find ourselves in an optimization context where it is not only a question of satisfying a set of constraints but also of achieving a so-called optimal solution. These constraints used in this work represent the system operating and they are represented by:
- Electricity generation constraints: the volatage VG and reactive power outputs QG are limited by their lower
bounds 𝑉𝐺𝑖𝑚𝑖𝑛, 𝑄𝐺𝑖𝑚𝑖𝑛and upper bounds 𝑉𝐺𝑖𝑚𝑎𝑥, 𝑄𝐺𝑖𝑚𝑎𝑥, respectively, where NG is the number of generators.
and they can be described as follows:
𝑉𝐺𝑖𝑚𝑖𝑛≤ 𝑉𝐺𝑖≤ 𝑉𝐺𝑖𝑚𝑎𝑥, 𝑖 = 1, … , 𝑁𝐺 (11)
- T
ransformer constraints: The transformer ratios are discrete values although they are here modeled as continuous variables. Transformer tap T settings, which are based on transformer rating and system voltage, where NT is the number of transformers, are bounded as follows:𝑇𝑖𝑚𝑖𝑛 ≤ 𝑇𝑖≤ 𝑇𝑖𝑚𝑎𝑥, 𝑖 = 1, … , 𝑁𝑇 (13)
- SVC constraints: These include the constraints of reference voltage 𝑉𝑟𝑒𝑓,, the total reactance 𝑏𝑆𝑉𝐶 and
the reactive power 𝑄𝑆𝑉𝐶, where NSVC is the number of SVCs as follows:
𝑉𝑆𝑉𝐶𝑖𝑚𝑖𝑛≤ 𝑉𝑟𝑒𝑓𝑖 ≤ 𝑉𝑆𝑉𝐶𝑖𝑚𝑎𝑥, 𝑖 = 1, … , 𝑁𝑆𝑉𝐶 (14)
𝑏𝑖𝑚𝑖𝑛 ≤ 𝑏𝑖≤ 𝑏𝑖𝑚𝑎𝑥, 𝑖 = 1, … , 𝑁𝑆𝑉𝐶 (15)
𝑄𝑆𝑉𝐶𝑖𝑚𝑖𝑛 ≤ 𝑄𝑆𝑉𝐶𝑖≤ 𝑄𝑆𝑉𝐶𝑖𝑚𝑎𝑥, 𝑖 = 1, … , 𝑁𝑆𝑉𝐶 (16)
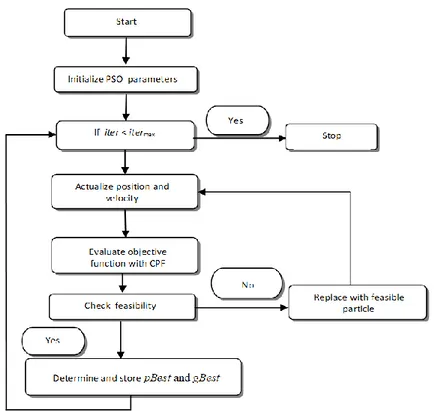
The proposed PSO-CPF algorithm is described in the flowchart of Figure 4.
Figure 4. Flowchart of the proposed PSO-CPF
5. CASE STUDIES
In this formulation, the objective function remains quadratic, but it is unweighted. Rather, standard deviations are used as variables that add to the measures. In addition, binary variables are integrated in order to detect erroneous parameters. A PSO-CPF algorithm based on the improvement of the objective function is proposed to help solve this mixed variable problem. For our simulation results, we will use the PSO-CPF algorithm that we developed. To improve the voltage stability of the electric network, an optimal location of the SVC is considered. Different scenarios will be tested for the IEEE-30 node network. Our simulation steps will go through 2 cases, in the first the constraint is taken only the voltage of the SVC, and for the second case, the voltage of the FACTS device thus considered its reactance and its reactive power in the objective of maximizing the loading parameter taken as the objective function.
5.1. Simulation result for IEEE 30-bus system
First, the formulation is tested on the IEEE 30-bus network. Errors ranging from 5% to 100% of the initial parameter values are introduced and correctly identified. Even in cases where the susceptance and
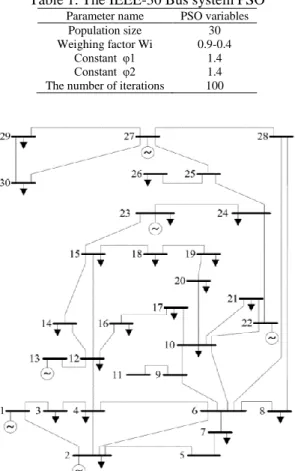
transformer ratio errors are adjacent, the parameters can be detected and estimated with accuracy. The load cases (or operating points) are represented by the real and reactive powers necessary for each bus in the network. Some bars linked to a generator generate power. Other buses are connected to subnets and require a certain outgoing power load. The power flows in the branches adjust according to the generation and the demand between the bus [26]. Figure 5 illustrates the network with the data considered.The susceptance error varies from 1% to 100% of its initial value. The measurement of reactive power flow in the branches is where susceptance has the most impact. The redundancy of this measurement, as well as its amplitude, varies according to the lines. Table 1 presents the cases tested and PSO parameters. The conclusions which can be drawn from them.
Table 1. The IEEE-30 Bus system PSO
Parameter name PSO variables Population size 30 Weighing factor Wi 0.9-0.4
Constant φ1 1.4 Constant φ2 1.4 The number of iterations 100
Figure 5. The IEEE-30 bus system
5.2. Case 1: SVC voltage reference only
In this scenario, the voltage reference of the SVC was taken into account. The optimal solutions obtained from the PSO and their related results are provided in the Table 2. Based on the voltage profiles of Figure 6, at the critical buses (buses 9, 10, 11, 12, 14, 15, 16, 17, 18, 19, and 20) the voltages results obtained have increased with SVC. A weak destabilization occurs at buses 5, 7, 8, 26, 29, and 30 because the SVC has not been installed on the weakest bus. The active power losses profiles of the system (without and with the presence of the SVC device) are shown in Figure 7, near the collapse point the increase in losses is higher in the case 1 of the SVC device. Figure 8 shows the reactive power losses profiles of the system for the two cases without and with the presence of the SVC. We can see the increase in losses near the collapse point is lower in the observed of the case 1 of the SVC. Figure 9 illustrates the improvement of the objective function according to the iterations. It is interesting to note in this figure that the convergence characteristics of the proposed PSO algorithm.
Table 2. The best results for case 1
The best location of SVC The best λ (pu) The best Vref (pu) 12.0000 -3.2519 0.9500
Figure 6. 30-bus system voltage profile without and with the presence of the SVC device (case 1)
Figure 7. 30-bus system active power losses profile without and with the presence of the SVC device (case 1)
Figure 8. 30-Bus system reactive power losses profile without and with the presence of
the SVC device (case 1)
Figure 9. The convergence characteristics of the proposed PSO algorthim applied to
30-Bus system (case 1)
5.3. Case 2: all SVC constraints
In this case, the whole set of problem constraints were taken into consideration. The optimal solutions obtained from the PSO are summarized in Table 3. The voltage profile of our simulation is shown in Figure 10. On the other hand, the Figures 11 and 12 show the active and the reactive power losses profile, respectively. The best position for this case was founded is bus 15. For this scenario the corresponding size of SVC is 62.105 MVAR, -16.98 MVAR (inductive) to +45.125 MVAR (capacitive). It can be seen that an smart and optimal SVC placement could reduces both the real and the reactive power losses. This represents a considerable gain for voltage stability.
At the collapse point the SVC device provides a better voltage profile as illustrated in Figure 10. This is because the SVC is installed at the weakest bus, which is the bus 15. From the active and reactive power losses profiles of the system (without and with the presence of the SVC device), we noticed the increase in losses near the collapse point is lower in the case 2 of SVC.The convergence characteristic of the proposed PSO for case 2 is depicted in Figures 13. Figure 14 illustrates the impact of installing the SVC devices. This confirms the previous observations. Therefore, it is clear from this figure that total losses are minimized after the SVC installation on bus 15.
Table 3. 30-Bus system results (case 2)
The best location of SVC The best λ (pu) The best Vref (pu) The best b (pu) bmin bmax 15 3.1823 0.9500 -0.1882 0.5000
Figure 10. 30-bus system voltage profile without and with the presence of
the SVC device (case 2)
Figure 11. 30-bus system active power losses profile without and with the presence of
the SVC device (case 2)
Figure 12. 30-bus system reactive power losses profile without and with the presence of
the SVC device (case 2)
Figure 13. 30-bus system convergence haracteristics of
the proposed PSO (case 2)
Figure 14. The impact of the SVC
6. CONCLUSION
In this paper, a new formulation of the parameter estimation function for an electrical network has been presented. The resulting model is a combinatorial optimization problem, and a PSO-CPF combination
algorithm has been proposed to estimate the optimal placement of SVC, and therefore to enhance the power system voltage stability. The formulation was tested on the IEEE 30 bar network with the Gaussian noise of the measurements. However, since this new formulation has been developed in transport networks where noise is high, this detection of small errors is not an objective. The new formulation is therefore competitive with the other methods of the literature review in addition to being independent of the weights of the database. Other observations and potential improvements have emerged from the various tests carried out; the reactive powers of the branches need to be evaluated to avoid false detection. This work can be further extended to address the problem of the optimal location of FACTS devices and wind generators to enhance voltage stability.
ACKNOWLEDGEMENTS
The authors would like to acknowledge the financial support of the Ministry of Higher Education and Scientific Research of Algeria, under the project 01L07UN200120150001.
REFERENCES
[1] P. Kundur, "Power System Stability and Control." McGrawHil, New York: Wiley, 1994.
[2] E. Allen, Andersson G, et al., “Blackout Experiences and Lessons, Best Practices for System Dynamic Performance, and the Role of New Technologies,” IEEE, Tech. Rep. Special Publication, 07TP190, July 2007.
[3] S. Repo, “On-Line Voltage Stability Assessment of Power System-An Approach of Black-box Modelling,” Ph. D. Thesis, Univ. Tech., Tampere Univ, Finland, 2001.
[4] S. Larsson and A. Danell, "The black-out in southern sweden and eastern denmark, september 23, 2003," Power Systems
Conference and Exposition, 2006. PSCE ’06. 2006 IEEE PES, Oct 2006, pp. 309–313, December 2006.
[5] C.Bouchoucha, M. Mansouri and F. Mimouni, "Protection Strategy and Robustness of Maghreb Electrical System: An Analytical Study, " ICGST-ACSE Journal, vol. 9, no. 2, October 2009.
[6] G. Andersson, P Donalek, et al., "Causes of the 2003 major grid blackouts in north America and europe, and recommended means to improve system dynamic performance," IEEE Transactions on Power Systems, vol. 20, no. 4, pp. 1922–1928, Nov 2005.
[7] S. Corsi and C. Sabelli, "General blackout in Italy Sunday september 28, 2003, h. 03:28:00," Power Engineering Society
General Meeting, 2004. IEEE, pp. 1691-1702, June 2004.
[8] S. Khotari, R. Agrawel and S. Kumar, "Enhancement of voltage stability using FACTS controllers: A State of the Art Review, " Journal of Advanced Scientific and Technical Research, vol. 1, pp. 262-271, Feb 2014.
[9] N.G. Hingorani, "Understanding FACTS, Concepts and technology of Flexible AC transmission systems," IEEE Press, 2000. [10] I. G. Adebayo, A. A. Jimoh and A. A. Yusuff A. A., "A study of the effect of power electronic system interaction with
power system voltage stability," Int Trans Electr Energy Syst, vol. 28, no. 8, 2018.
[11] M. Sedighizadeh, H. Faramarzi, et al., "Hybrid approach to FACTS devices allocation using multi-objective function with NSPSO and NSGA-II algorithms in Fuzzy framework, " International Journal of Electrical Power and Energy
Systems, vol. 62, pp. 586-598, Nov 2014.
[12] D. Mondal, A. Chakrabarti, et al., "Optimal placement and parameter setting of SVC and TCSC using PSO to mitigate small signal stability problem, " International Journal of Electrical Power and Energy Systems, vol. 42, pp. 334-340, 2012. [13] M. Saravanan, S. Mary, et al., "Application of particle swarm optimization technique for optimal location of FACTS devices considering cost of installation and system loadability, " Electric Power Systems Research, vol. 77, no. 3-4 pp. 276-283, March 2007.
[14] E. Nasr Azadani, et al., "Optimal placement of multiple STATCOM for voltage stability margin enhancement using particle swarm optimization," Electrical Engineering, vol. 90, pp. 503-510, July 2008.
[15] M. Veera Venkata Satya Narayana M, et al., " Impact of D-STATCOM in distribution systems with load growth on stability margin enhancement and energy savings using PSO and GAMS", International Transactions on Electrical
Energy Systems, vol. 28, no. 11, 2018.
[16] O. L Bekri, M.K. Fellah, M.F. Benkhoris and A. Miloudi, "Voltage Stability Enhancement by Optimal SVC and TCSC Location via CPFlow Analysis," International Review of Electrical Engineering, vol. 5, no. 5, pp. 2263-2269, Oct 2010. [17] C. A. Canizares, "Power flow and Transient Stability Models of FACTS controllers for Voltage and Angle Stability
Studies," Proc. Power Engineering Society Winter Meeting, pp. 1447-1454, January 2000.
[18] F. Milano, "Pricing System Security in Electricity Market Models with Inclusion of Voltage Stability Constraints,” Ph. D. Thesis, Elect. Eng, Genova Univ, Italy, 2003.
[19] J. Kennedy, R. Eberhart,"Particle swarm optimization," Proc. IEEE International Conference on Neural Networks
(ICNN’95), pp. 1942-1948, Nov. 1995.
[20] M. Pandya J. G. Jamnani, "Transient Stability Assessment by CoordinatedControl of SVC and TCSC with Particle Swarm Optimization," International Journal of Engineering and Advanced Technology, vol. 9, no. 1 pp. 2506-2510, 2019. [21] Y. Shi and R. Eberhart, "A Modified Particle Swarm Optimizer," Proc. Evolutionary Computation, IEEE World
Congress on Computational Intelligence, pp. 69-73, May 1998.
[22] M. E. H. Pederson, "Good Parameters for Particle Swarm Optimization," Hvass Laboratories, Technical Report HL1001, 2010. [23] Z. Li-Ping, et al., "Optimal choice of parameters for particle swarm optimization," Journal of Zhejiang University
Science, vol.6, pp. 528-534, Jun 2005.
[25] R. Kalaivani and S. K. Dheebika, "Enhancementof Voltage Stability and Reductionof Power Loss Using Genetic Algorithm Through Optimal Locationof SVC, TCSC and UPFC," Journal of Engineering Science and Technology, vol. 11, pp.1470-1485, Oct 2016.
[26] M. A. Abido, J. M. Bkhashwain, "Optimal VAR dispatch using a multiobjective evolutionary algorithm," International
Journal of Electrical Power and Energy Systems, vol. 27, no. 1, pp.13-20, Jan 2005.
BIOGRAPHIES OF AUTHORS
Oum El Fadhel Loubeba Bekri received her Ph.D. degrees in electrical engineering from
Sidi Bel-Abbes University in Algeria in 2013. Since december 2002, she has been with the University of Dr Moulay Tahar (U.D.M.T.) of Saida as a teacher and researcher. She was a member of the Intelligent Control and Electrical Power Systems Laboratory, Djillali Liabès University, Sidi Bel Abbès, Algeria. She is currently a member of the Electrotechnical Engineering Laboratory, Dr Moulay Tahar University, Saida, Algeria. Her current research interest includes Power Systems, FACTS, application of metaheuristics and intelligent methods in power systems and renewable energy.
Abdellah Chehri is a Professor at the department of applied science of the University of
Quebec in Chicoutimi, which he joined in August 2018. He received the Ph.D. degrees in Electrical Engineering from Laval University (Quebec City, QC) in 2009. He worked as a project member at the Bell-Aliant Research Laboratory, between 2007 and 2009. During this period, he served as a lecturer in the Information Technologies Graduate Program of the University of UQAT. He joined the University of Ottawa in July 2009 as a post-doc fellow/research associate and member of “WiSense project” working on Wireless Heterogeneous Sensor Networks in the e-Society. From 2012 to 2014, he worked as a senior research engineer at BLiNQ Networks, Kanata. From 2014 to 2018, he worked as Manager of Next-Generation Network (NGN)/VoIP & Emerging Technologies at Bell Canada. Dr. Chehri received a number of prestigious awards: Dean's Scholarship Award, Dean's Teaching Awards,Postdoctoral Studies (University Ottawa), Scholarship Fund to Support Success (Laval University), and the NSERC Postdoctoral Fellowship. He is serving as guest editor and a technical reviewer for several international conferences and journals. Additionally, he is a Senior Member of IEEE Communications Society, IEEE-Quebec Section, Member of the Order of Engineers of Quebec (OIQ) and IEEE Canadian Humanitarian Initiatives Committee (HIC).
Professor Tounsia Djamah Faculty of Electrical and Computer Engineering, University M.
Mammeri of Tizi-Ouzou. She received B.S. degree from Ecole Nationale Polytechnique d’Alger, Algiers, M.S. degree in Electrical Engineering from Cleveland State University, OH, USA, and Ph.D. degree in Automatic control from the University M. Mammeri of Tizi-Ouzou, Algeria. Her research interests include non linear systems, fractional dynamics and control, system identification, modeling and optimization and signal processing.
Mohammed-Karim Fellah received his Ph.D. degree from National Polytechnic Institute of
Lorraine (Nancy, France) in 1991. Since 1992, he is Professor at DjillaliLiabès University of Sidi-bel-Abbès (Algeria). Between 2000 and 2010, he was Director of the Intelligent Control and Electrical Power Systems Laboratory at this University. His current research interest includes Power Electronics, HVDC links, and Drives.