DISTRIBUTION OF TEMPERATURE AND SALINITY IN THE BEAUFORT SEA DURING THE CANADIAN ARCTIC SHELF EXCHANGE STUDY
SAMPLING EXPEDITIONS 2002-2004
By
Annie Simard1, Marie-Emmanuelle Rail1 and Yves Gratton1
1
INRS-Eau, Terre et Environnement 490, de la Couronne
Québec, Qc Canada, G1K 9A9
2010, INRS-Eau, terre et environnement
CORRECT CITATION FOR THIS PUBLICATION :
Simard, A., M.E. Rail and Y. Gratton. 2010. Distribution of temperature and salinity in the Beaufort Sea during the Canadian Arctic Shelf Exchange Study sampling expeditions 2002-2004. Report No R1187, INRS-ETE, Québec (Qc): vii + 128 p.
ABSTRACT
This report presents the CTD (Conductivity, Temperature and Depth) data obtained during the Canadian Arctic Shelf Exchange Study (CASES) expeditions held between 2002 and 2004 in the Beaufort Sea. The report also contains information about data obtained by the Moving Vessel Profiler (MVP), moorings and ship mounted Acoustic Doppler Current Profiler (SM-ADCP) which was recorded during the same expeditions. Detailed maps of sampling sites in the Beaufort Sea and Mackenzie Shelf are included. CTD temperature and salinity data are presented as contour plots following West-East or South-North sections. Stick diagrams of moored ADCP’s data are also included.
RÉSUMÉ
Ce rapport présente les données de CTD (conductivité, température et profondeur) recueillies au cours des différentes missions du programme «Canadian Arctic Shelf
Exchange Study» (CASES) qui se sont déroulées dans la mer de Beaufort entre 2002 et
2004. Il présente également de l’information sur les données de Moving Vessel Profiler (MVP), du profileur de courant (ADCP) fixé sous la coque et des données de mouillage enregistrées au cours des mêmes missions. Des cartes détaillées montrant les sites d’échantillonnage dans la mer de Beaufort et le long de la marge continentale du Mackenzie y sont incluses. Les données de température et de salinité du CTD et du MVP y sont présentées sous forme de contours le long de sections ouest-est ou sud-nord. Les données enregistrées par les ADCP des mouillages sont présentées sous forme de diagrammes en bâtons.
ABSTRACT………..………. p. iii TABLE OF CONTENTS………..…………. p. iv LIST OF FIGURES………..………...……….. p. v LIST OF TABLES………..……... p. v LIST OF APPENDICES……….……….…….. p. vi FOREWORD……….….…... p. vii 1. INTRODUCTION……….……… p. 1 RELATED STUDIES……….. p. 2 2. SAMPLING PROGRAM……….……. p. 2 ROSETTE SAMPLING……….………..……….…... p. 2
MOVING VESSEL PROFILER (mvp)……….…………... p. 4
MOORINGS……….………..…….. p. 4
SHIP-MOUNTED ACOUSTIC DOPPLER CURRENT PROFILER (adcp).. p. 5 3. DATA PROCESSING AND QUALITY CONTROL……….……….. p. 6 ROSETTE-CTD DATA……….………..………. p. 6 MVP DATA………..… p. 6 MOORINGS DATA………..………... p. 7 4. DISCUSSION……….………...…… p. 7 5. ACKNOWLEDGMENTS………..………...…… p. 8 6. REFERENCES………..………...……. p. 8 TABLES………..……….. p. 10 APPENDICES……….……….. p. 20
LIST OF FIGURES
FIGURE 1 CASES study region in 2003-2004………..………… p. 1 FIGURE 2 Rosette-CTD sampling sites………..………... p. 3 FIGURE 3 Mooring schematics………..… p. 4 FIGURE 4 Mooring locations (2002-2004)……….……...……… p. 5
LIST OF TABLES
TABLE 1 Summary of CASES expeditions………...……... p. 10 TABLE 2 Rosette and MVP sensor specifications………....……… p. 11 TABLE 3 Summary of Rosette and MVP sampling………….………. P. 12 TABLE 4 List of Rosette sections, stations and casts………...…… p. 13 TABLE 5 Summary of moored instruments 2002-2003………...………… p. 16 TABLE 6 Summary of moored instruments 2003-2004………...………… p. 17 TABLE 7 Content of the ASCII Rosette data files………...………. p. 19
APPENDIX 1 Over-wintering station activities on the ice……….…... p. 20 APPENDIX 2 Maps of Beaufort Sea, Mackenzie Shelf and Amundsen Gulf
where Rosette and MVP data were collected …..……..………… p. 21 APPENDIX 3 Rosette casts logbooks………..………..…… P. 27 APPENDIX 4 Ice-CTD data logbook (over-wintering station Winter 1)……... p. 51 APPENDIX 5 Sections of salinity and potential temperature from CASES
Rosette data, Leg 0 (September-October 2002)…………...……... p. 54 APPENDIX 6 Sections of salinity and potential temperature from CASES
Rosette data, Leg 2 (October-November 2003)…….………. p. 63 APPENDIX 7 Sections of salinity and potential temperature from CASES
Rosette data, Leg 7 (May-June 2004)………. p. 71 APPENDIX 8 Sections of salinity and potential temperature from CASES
Rosette data, Leg 8 (June-July 2004)……….. p. 77 APPENDIX 9 MVP profiles logbooks………...……… p. 85 APPENDIX 10 Sections of salinity and potential temperature from MVP data,
Leg 7 (May-June 2004)…..………. P. 87 APPENDIX 11 Sections of salinity and potential temperature from MVP data,
Leg 8 (June-July 2004)………... P. 92 APPENDIX 12 Sections of salinity and potential temperature from MVP data,
Leg 9 (August 2004)………... P. 114 APPENDIX 13 ADCP data (stick diagrams)………...……… p. 117
FOREWORD: CANADIAN ARCTIC SHELF EXCHANGE STUDY
Funded by the Natural Sciences and Engineering Research Council of Canada (NSERC), the Canadian Arctic Shelf Exchange Study (CASES) Research Network is an international effort under Canadian leadership to understand the biogeochemical and ecological consequences of sea ice variability and change on the Mackenzie Shelf. The CASES Research Network brought together Canadian and foreign expertises in Arctic oceanography. The Canadian contribution included 42 researchers coming from ten universities, four Federal Departments and the Canadian Museum of Nature. Thirty Arctic experts coming from nine foreign countries (USA, Japan, UK, Denmark, Russia, Poland, Norway, Belgium and Spain) were associated with the CASES Network.
The Canadian contribution was to assess the dynamical aspects of the Mackenzie Shelf ecosystem. The scientific program is focussing on a central hypothesis which states that the atmospheric, oceanic and hydrologic forcing of sea ice variability dictates the nature and magnitude of biogeochemical carbon fluxes on and at the edge of the Mackenzie Shelf. The Canadian-led projects studied: 1) Atmospheric and sea ice forcing of coastal circulation; 2) Ice-atmosphere interactions and biological linkages; 3) Light, nutrients, primary and export production in ice-free waters; 4) Microbial communities and heterotrophy; 5) Pelagic food web: structure, function and contaminants; 6) Organic and inorganic fluxes; 7) Benthic processes and carbon cycling; 8) Millennial-decadal variability in sea ice and carbon fluxes; 9) Coupled bio-physical models of the carbon flows on the Canadian Arctic Shelf.
The CASES program was carried out from September 2002 to August 2004. The objective of the CASES field expeditions was to perform an extensive sampling of the Southern Beaufort Sea and the Amundsen Gulf coastal shelves (from 67N to 76N and from 120W to 41W) (see Fig. 1). Two different expeditions were held. The first expedition was conducted on board the CCGS Pierre Radisson between September 20th and October 14th, 2002 and was identified as leg 0. The second expedition was conducted on board the CCGS Amundsen between September 8th, 2003, and August 26th, 2004. This last expedition was divided into nine periods of six weeks (four weeks for leg 9) designated legs 1 to 9 (see Table 1).
FIGURE 1. CASES study region. The CTD–Rosette sampling stations are identified by
black squares or dots, and the mooring sites with yellow and red stars.
This report provides the CASES community with a synthesis of the available physical data recorded during this 13-month sampling campaign. The data set includes 983 Rosette-CTD (Conductivity Temperature Depth) casts and 1924 MVP (Moving Vessel Profiler) profiles. Also included are information about the 2002-2003 and 2003-2004 data recorded by 81 different instruments deployed on 24 (recuperated) mooring lines, and current data recorded along the ship track by a ship mounted ADCP (Acoustic Doppler Current Profiler).
Related Studies
A significant amount of published studies and scientific papers have reported on the physical oceanographic processes in the Canadian Arctic. The Beaufort Sea and Amundsen Gulf are the Canadian Arctic regions that have been studied the most extensively over the years, especially during the Canadian Arctic Shelf Exchange Study program and subsequently during ArcticNet expeditions. In 2008, the Journal of Geophysical Research published eleven papers from the CASES program in a special issue (volume 113, number C3). The same year, a book containing a synthesis of the work performed in every main research subject of the program was edited by L. Fortier, D. Barber and J. Michaud. It was titled: On thin Ice. The oceanography of the Beaufort Sea was also discussed by Ingram et al. in an issue of «The Sea» (volume 14, part A, 2005). Two thesis present information related to the polynya observations: Galley (2009) and Lanos (2009). The former focuses on ice processes and the latter on water column processes.
2. SAMPLING PROGRAM
Rosette
During CASES expeditions, the rosette was equipped with 24 «Niskin» 12 L bottles, a SeaBird 911+ CTD with eight independent sensors (see Table 2 for sensors specifications). Few sensors were changed during the expeditions. No altimeter was used during the first leg in 2002. At that time, the sea-bed proximity was detected with a weight attached to a line. The nitrates sensor was only installed on the rosette at the beginning of leg 3 (expedition 0305). Lastly, the PAR (light sensor) was removed for the winter lightless time period from the middle of leg 3 (expedition 0305) to the middle of leg 7 (expedition 0404).
During legs 0, 1, 2, the second half of 7, 8 and 9, the ship was sailing in open water and the rosette was deployed from the ship boat deck and lowered into the water at a rate of 1 m s-1. However, during legs 3, 4, 5, 6 and the first half of 7, the ship remained ice bound at its over-wintering station (Winter 1: 70o02.73’N and 126o18.07’W, see Fig. 2 and Appendix 1 and 2). For this period, the rosette was deployed from the Moon Pool, a 4 feet by 4 feet opening in the middle of the Amundsen’s hull giving access to the water underneath.
CTD profiles were carried out in the Southern Beaufort Sea and Amundsen Gulf along sections (see Fig. 2 and Appendix 2). A summary of the sampling effort is presented in Tables 3a and 4. In open water, the rosette was deployed as often as possible. At the over-wintering station, the sampling schedule was simpler: the Rosette was
0303 and 0406 is poor because those legs were dedicated to mooring deployment and/or coring.
Winter Station
FIGURE 2. CASES Rosette sampling sites. The Winter station is identified by a black
square in Franklin Bay (70o 02.71’N, 126o 18.06’W).
The logbooks of the CTD profiles are presented in Appendix 3. A summary of the CTD processing and quality control is presented in Section 3 of this report, and contour plots of salinity and potential temperature along some sampling sections are presented in Appendices 5 to 8. During the over-wintering months other CASES teams carried out CTD profiles through ice holes using a SBE 19 instrument. Most of those profiles were performed at the following ice "permanent" stations: Dukuduku, Titicaca, Takatuk and Angaguk. The locations of the stations with respect to the ship are shown in Appendix 1. Unfortunately, we don't have a copy of all that CTD data set. A summary of the information on the available ice CTD profiles is presented in Appendix 4. The interested reader should contact the other CASES teams directly.
CTD data are hosted on the Integrated Service Data Management (ISDM) website and are available to the international community.
Moving Vessel Profiler (MVP)
The Moving Vehicle Profiler is a towed CTD with fluorescence and dissolved oxygen sensors. It is used in automatic mode. The “fish” (right, picture credit: CASES Website) freefalls at ~ 5 m s-1 and is automatically winched back to 10 m under the surface after each cast. We are unable to sample the first 10 and last 10 meters of the water column. The instrument is a MVP 300-1700 model, meaning that it is equipped with 1700 m of cable and can profile down to 300 m at 12 knots. The slower the cruising speed the deeper the MVP can reach.
This MVP profiler was equipped with sensors similar to the Rosette (see Table 2 for sensors specifications). The MVP was mostly used during legs 0404 and 0405 and only once during leg 0406 between stations 200 and 124. One thousand nine hundred and twenty-four MVP casts were carried out during those legs. A summary of the sampling data is presented in Table 3b and the locations of the MVP sections are shown in Appendix 2. The logbook of the MVP profiles available for all the stations and casts is presented in Appendix 9. Contours plots of salinity and potential temperature recorded along the sections are presented in Appendices 10 to 12.
Moorings
Moorings lines were deployed in 2002 and 2003 to measure ocean currents and long-term variability of the water masses in the Beaufort Sea. Ingram et al. (2004) described in detail the CASES mooring activities and van Hardenberg (2004a) presented the general description of the deployment and recovery procedures. The following schematics (Fig. 3) show the different type of instruments and sensors attached to the moorings. A summary of the moorings, the sensors, and the recovered data may be found in Tables 5 and 6.
FIGURE 3 Example of mooring schematics.
(Credits: Bon van Hardenberg, Fisheries and Ocean Canada)
Eight moorings were deployed in 2002 along the Beaufort continental shelf and Amundsen Gulf (see Fig.4). All of them were successfully recovered and redeployed for another year of measurements in 2003 (except CA01 and CA02). A total of seventeen moorings were deployed in October 2003 along the Beaufort continental shelf and in the Amundsen Gulf (see Fig. 4). All the moorings but two (CA13-03 and CA14-03) were
year of measurements in the Beaufort Sea and Amundsen Gulf for ArcticNet (CA04, CA05, CA07, CA15, CA18 and CA20).
FIGURE 4. Mooring locations (2002-2004). The moorings are identified by the
red and yellow stars.
A summary of the 30 instruments recovered in 2003 and the 51 instruments recovered in 2004 and 2005, their sensors, and the periods of valid data are shown in Tables 5 and 6. The instruments included RDI 300 kHz Workhorse ADCPs, Aanderaa RCM-11, RCM-7 and RCM-4 (Recording Current Meters), Sea-Bird SBE-37 conductivity-temperature sensors, Sea-Bird SBE-26 water level recorders, Alec conductivity-temperature sensors, Alec chlorophyll sensors and Alec light sensors. Ingram et al. (2004) and van Hardenberg (2004) have summarized all the problems encountered in their technical reports. The stick diagrams of the sea currents recorded by the ADCPs on the different moorings between 2003 and 2004 are presented in Appendix 13.
Ship mounted Acoustic Doppler Current Profiler (ADCP)
During the entire 2003-2004 CASES sampling season, the CCGS Amundsen was equipped with a RDI Ocean Surveyor (ship-mounted) 150 kHz ADCP, sampling 24 hours a day. Unfortunately, the instrument had a defect and although the flaw was quickly detected, there was nothing we could do to correct the problem until the next dry dock scheduled for April 2006. Regardless, we continue to collect data with the ADCP throughout the 2003-2004 expeditions. The data set was saved as it may be possible to
3. DATA PROCESSING AND QUALITY CONTROL
Rosette-CTD data
The Rosette data processing and quality control are described in detail by Guillot (2003). The «READ ME » file attached to each yearly CTD data set also presents the most important processing steps and changes made to the data files. All users should read these files to be aware of data limitations.
Processing included the following steps: validation of the calibration coefficients, conversion of data to physical units, alignment correction and extraction of useless data. Oxygen sensor calibration was done using Winkler titrations and salinity data were compared with water samples analysed with a Guildline 8400B Autosal. The CTD data were passed through a quality control test based on UNESCO’s algorithm standards (1990). The recorded data were averaged every 1 dbar. The computed oceanographic parameters (see Table 7) were calculated using the averaged data. Missing data were linearly interpolated. Lastly, there is one ASCII file for every CTD cast. The content of a typical ASCII file is shown in Table 7.
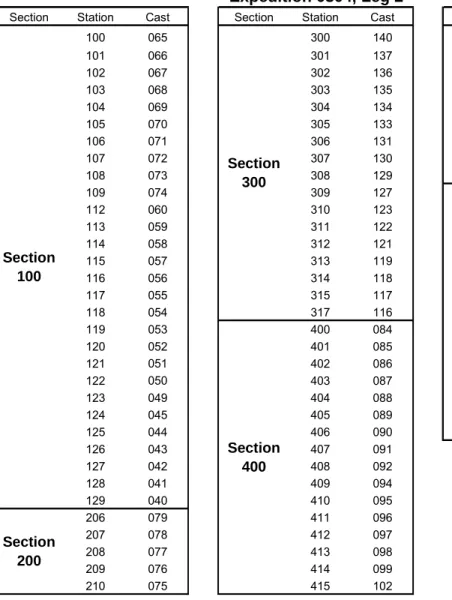
CTD profiles cover the water column down to 10 meters from the sea-bed. To reduce the amount of information presented in this report, temperature and salinity contours are only provided for each section shown in Appendix 2. The contours are presented in Appendices 5 to 8. Table 4 presents the stations and casts number used for each section interpolation process. The temperature and salinity data were interpolated on a 5 km by 5 m grid with a triangle-based cubic interpolation method and contoured in Matlab®. The origin of each section is always the westernmost or southernmost cast. For the West-East sections, West is on the left and East on the right; for the South-North sections, South is on the left and North on the right.
MVP data
MVP profiles cover the water column from 10 meters of the surface down to 10 meters from the sea-bed. The temperature and salinity contours are provided for each section shown in Appendix 2. The contours are presented in Appendices 10 to 12. The temperature and salinity data were averaged every 1 dbar but were not interpolated. The contours plots use the original data. The origin of each section is the westernmost or southernmost cast. For the West-East sections, West is on the left and East on the right; for the South-North sections, South is on the left and North on the right.
he mooring data were processed by Bon van Hardenberg of the Institute of Sydney, B.C. and distributed as Excel files. Information about the compasses calibration will be found in his report: Report on the 2003 calibrations of
magnet
rocessed by Dave Riedel from True North cientific Company. The summary of the processing and the quality control performed on the dat
ISCUSSION
e on-going studies are also worth mentioning. Romain Lanos has completed his study of southern Beaufort Sea and Amundsen Gulf using the CASES (Canadian Shelf E
T
Ocean Sciences in
ic compasses of Aanderaa current meters and RDI Acoustic Doppler Current Profilers (ADCPs) for use in Arctic mooring deployments.
The moored ADCP’s data were p S
a of 2002 and 2003 will be found in his report: ADCP Data Processing Summary:
CASES 2002-2003 ADCP. The report also includes an appreciation of the data quality
and a few recommendations.
4. D
CASES was a very demanding research program that was characterized by the overwintering of the first Canadian scientific icebreaker, the CCGS Amundsen, in the Amundsen Gulf. The ship was ice-bound in Franklin Bay for six months: from November 2003 to June 2004. The biggest surprise was the observation of a couple of eddies drifting under the ship during this period. A second surprise was the overwintering of an enormous school of Arctic cods under the ship. In February, the density of cods was so great that the ship-mounted ADCP was recording a ship vertical velocity when they were migrating up and down the water column.
Thre
xchange Study) mooring and CTD data. In his Ph.D. thesis (Lanos 2009), he describes the regional and seasonal variability in the Beaufort Sea – Amundsen Gulf region. Also in his Ph.D. thesis, Ryan Galley dedicates a chapter to the formation of the Cape Bathurst polynya in 2004. Finally, current pulses were observed in the 2003-2004 and 2003-2004-2005 mooring data at CA04. Some pulses were related to storms in Bering.
5. ACKNOWLEDGMENTS
nkeys» for their outstanding ampling effort cast after cast after cast. Thanks to the mooring team for their incredible work. A
6. REFERENCES
Fortier, L., D. Barber and J. Micha thin Ice. Aboriginal Issues Press, W nnipeg (MB): 215 p.
Galley,
Guillot
Ingram, R.G., E.C. Carmack, F.A. McLaughlin, and S. Nicol. 2005. Polar Ocean Coastal Boundaries, chapter 3 in: The SeaIdeas and Observations on Progress in the Study of the Seas, Volume 14 part B, A.R. Robinson and K.H. Brink (eds), Harvard
University Press, Cambridge: pp. 61-81.
Lanos, R., 2009. Circulation générale, mases d’eau, cycles d’évolution et transports entre la mer de Beaufort et le Golfe d’Amundsen. Ph.D. thesis, INRS-ETE, 245 p. We thank Captains Brulé, Thomas, Julien and Tremblay, the officers and crew of the CCGS Pierre Radisson, CCGS Sir Wilfrid Laurier and CCGS Amundsen for their outstanding collaboration throughout the CASES expeditions. We also thank the many members of the «Rosette team» and all the «Rosette mo
s
nd last but not least, thanks to Bon van Hardenberg, Pascal Guillot and Maryam Kamali Nezhad for their data processing efforts.
ud [Eds]. 2008. On i
R. 2009. Sea ice thermodynamic and dynamic processes in the ocean- sea ice - atmosphere system of the Canadian Arctic. Ph.D. thesis, University of Manitoba, 249 p.
Gratton, Y., M. Ouellet, M.E. Rail, and R.G. Ingram. 2006. Distribution of temperature and salinity in Northern Baffin Bay during the International North Water program (August 1997, April to July 1998, and September 1999). Internal Report No R897, INRS-ETE, Québec (Qc): x + 124 p.
, P. 2003. Sea-Bird CTD Processing and Quality Control Procedure. Technical report, draft version, Québec-Océan, Université du Québec à Rimouski : 42 p.
Ingram, R.G., E.C. Carmack, Y. Gratton, B. Williams, D. Sieberg and B. van Hardenberg, 2004. Progress Report on the Physical Oceanography Component of the CASES Science Program 2002-2004, Canadian Arctic Shelf Exchange Study technical report (unpublished): 10 p.
Melling, H. 1999. Observations by moored instruments in Northern Baffin Bay 1997-1998. Technical report (unpublished), Institute of Ocean Sciences, Department of F
y: CASES 2002-2003 ADCP. Technical report (unpublished), True North Scientific: 6 p.
Van Hardenberg, B. 2004a. Cruise Report for the Joint DFO / CASES /ArcticNet Science Program aboard the CCGS «Sir Wilfrid Laurier», 3-22 September. Technical report (unpublished), Institute of Ocean Sciences, Department of Fisheries and Oceans Canada, Sydney (BC): 27 p.
Van Hardenberg, B. 2004b. Report on the 2003 calibrations of magnetic compasses of deployments. Technical report (unpublished), Institute of Ocean Sciences, Department of Fisheries and Oceans Canada, Sydney (BC): 25 p.
isheries and Oceans Canada, Sydney (BC): 37 p.
Rail, M.E., 2007. Rapport sur le traitement des données des appareils des lignes de mouillages de CASES 2003-2004. Technical report (unpublished), INRS-ETE, Québec (Qc) : 31 p.
Riedel, D. 2005. ADCP Data Processing Summar
Aanderaa current meters and RDI Acoustic Doppler Current Profilers (ADCPs) for use in Arctic mooring
TABLE 1. Summary of CASES expeditions.
Leg Expedition
Number Dates Chief Scientists CTD Operators
0 0202 Sept 20th, 2002 To Oct 14th, 2002 Martin Fortier Marie Robert Marie-Emmanuelle Rail Gilles Desmeules 1 0303 Sept 8th, 2003 To Oct 15th, 2003
Martin Fortier Yves Gratton Jean-Éric Tremblay 2 , 2003 0304 Oct 15th, 2003 To Nov 25th
Lisa Miller Bill Williams Jane Eert 3 0305 Nov 26th, 2003 To Jan 6th, 2004 Christian
Nozais Marie-Emmanuelle Rail
4 0401
Jan 7 , 2004 To Feb 17th, 2004
Jody Deming Claude Bélanger th
5 0402
Feb 18th, 2004 To
March 30th, 2004
Jody Deming Mykola Vysotskyy
6 0403
March 31st, 2004 To
May 11th, 2004
Louis Fortier
Dave Barber Sergey Kirillov
7 0404 May 12th, 2004 To June 24th, 2004 Dave Barber Yves Gratton Louis Prieur Ian Beliveau 8 0405 June 25th, 2004 To August 4th, 2004 Louis Fortier Dave Scott Romain Lanos Christof Konig 9 0406 August 5th, 2004 To August 26th, 2004
Parameter Range Accu
Compagny ment Typ
CTD SeaB s 1 Tempera SeaB 1 Conducti SeaB 1 (0-70mmho/cm) 0. (0.003m ) Pressure Paroscie 05 up to 10 500m (15 000psia)2 0.015% of full
scale 0.001% of full scale
D olved oxy SeaB 3
saturation4 2% of s
pH SeaBird SBE-18-I 5 0-14 pH units 0,1 pH unit unknown
Nitrates concentration Satlan S 5T 6 0.5 to 2000 M 2 M
Light intensity (PAR) Biosphe 0
racy Resolution Instru e ird SBE-9plu ird SBE-03 ture vity -5°C à +35°C 0-7 S/m 0.001C 0.0002C 000 ird SBE-4C 3 S/m mho/cm) 0.00004 S/m (0.0004 mmho/cm ntific 410K-1
iss gen ird SBE-43 120% of surface
aturation unknown tic MBARI-ISU 0.5 M rical QCP230 1.4×10 -5 to 0.5 μE/(cm2·sec) sPAR Biospherical QCP2200 1.4×10 -5 to 0.5 μE/(cm2·sec)
Fluorescence Seap rometer
T smissiom Wetlabs C-Star
Altimeter Bentho 16 7 unknown 0.01 m
CTD SeaBir lus 1
Tempera SeaBird SBE-03 1 0.00
Conductivity SeaB 1 0-7 S/m (0-70mmho/cm) 0.0003 S/m (0.003mmho/cm) 0.00004 S/m (0.0004 mmho/cm)
Pressure Paroscie 5 up to 10 500m 0.0015% of full
s 0.001% of full scale
Dissolved Oxygen Sea 120% of surface
saturation4 2% of saturation unknown
Fluorescence Seap ometer 0.02-150 g/l unknown 30
Light transmission Wetl unknown 1.25 mV
7 Maximum depth of 6,000m
Attached to the MVP
Attached to e
3 Maximum depth of 7,000m 4 In all natural waters, fresh and 5 Maximu f 1,200m 6 Maximu f 1,000m N : 1 Maximum 6800m 2 Depending on the configuratio
oint Chlorophyll-fluo 0.02-150 g/l 0-5 V 0 - 100 m unknown 30 unknown 1.25 mV ran eter s PSA-9 d SBE-9p ture -5°C à +35°C 1C 0.0002C ird SBE-4C ntific 410K-10 (15 000psia)2 cale Bird SBE-43 3 oint Chlorophyll-fluor abs C-Star 0-5 V the Rosett marine m depth o m depth o Sensor otes depth of n
TABLE 3a. Summary of Rosette sampling, CASES 2002-2004.
Start End
0202 0 September 20 October 14 123 109 7
0303 1 September 8 October 15 37 17 n/a
0304 2 October 15 November 25 147 109 6
0305 3 November 26 January 6 60 1 n/a
0401 4 January 7 February 17 119 1 n/a
0402 5 February 18 March 30 90 1 n/a
0403 6 March 31 May 11 94 1 n/a
0404 7 May 12 May 30 40 1 n/a
June 4 June 24 93 47 5
0405 8 June 25 August 4 137 53 8
0406 9 August 5 August 26 24 8 n/a
Notes: n/a = not applicable
Date Expedition number Leg number Number of CTD casts Number of stations Number of sections
TABLE 3b. Summary of MVP sampling, CASES 2004.
Start End 0404 7 June 17 June 21 276 3 0405 8 June 25 August 1 1588 20 0406 9 August 7 August 7 60 1 Expedition number Leg number Number of CTD casts Number of sections Date
umbers in open water (page 1/3). n
Section Station Cast Section Station Cast Section Station Cast
6 124 48 038 89 094 7 123 49 039 90 095 8 122 50 043 91 096 9 121 51 044 92 097 10 120 52 045 93 098 11 119 53 046 94 099 12 115 54 048 95 100 12 115 56 050 96 101 13 114 57 051 97 102 14 113 58 052 98 103 15 112 59 053 99 104 16 111 60 054 100 105 17 110 61 055 101 106 18 003 62 056 101 106 19 004 63 057 102 128 20 005 64 058 103 129 21 006 65 059 104 130 22 007 66 067 105 131 23 008 67 068 106 132 24 009 68 069 107 133 25 013 69 070 108 134 26 014 70 071 109 135 28 016 71 072 110 136 29 017 72 073 30 018 73 074 31 019 74 075 33 021 76 077 34 022 77 078 34 022 78 079 35 023 79 080 36 024 80 081 37 025 81 082 38 026 82 083 39 027 83 086 40 028 84 088 42 030 85 089 43 031 86 090 44 032 87 091 45 033 88 092 46 035 89 094 47 037 48 038 Expedition 0202, Leg 0 1 6 7 5 2 3 4 32 020 75 076
TABLE 4. List of CASES Rosette sections and their corresponding station and cast
numbers in open water (page 2/3).
Section Station Cast Section Station Cast Section Station Cast
100 065 300 140 500 038 101 066 301 137 501 037 102 067 302 136 502 036 103 068 303 135 503 035 104 069 304 134 504 034 105 070 305 133 505 033 106 071 306 131 506 032 107 072 307 130 507 031 108 073 308 129 508 030 109 074 309 127 700 027 112 060 310 123 702 025 113 059 311 122 703 024 114 058 312 121 705 022 115 057 313 119 706 020 116 056 314 118 707 019 117 055 315 117 708 018 118 054 317 116 709 016 119 053 400 084 711 012 120 052 401 085 712 011 121 051 402 086 714 009 122 050 403 087 715 007 123 049 404 088 716 006 124 045 405 089 717 005 125 044 406 090 718 003 126 043 407 091 127 042 408 092 128 041 409 094 129 040 410 095 206 079 411 096 207 078 412 097 208 077 413 098 209 076 414 099 210 075 415 102 Section 700 Expedition 0304, Leg 2 Section 100 Section 300 Section 400 Section 500 Section 200
numbers in open water (page 3/3).
Section Station Cast Section Station Cast Section Station Cast
108 059 109 124 703 006 109 060 112 121 704 008 110 061 115 120 705 009 111 062 118 119 706 010 112 063 121 118 707 011 115 066 124 116 708 012 115 067 203 136 709 013 117 075 206 135 710 014 118 076 209 132 711 015 119 077 212 130 712 016 120 078 215 128 715 113 121 079 309 090 718 056 122 080 312 091 721 112 123 081 315 092 903 026 124 083 400 111 906 027 124 084 403 110 909 036 347 130 406 109 912 042 394 129 409 104 395 128 412 100 396 127 415 096 397 125 400 109 401 108 402 107 403 106 404 105 405 104 406 103 407 095 409 093 410 085 411 086 412 087 413 088 414 089 416 091 Section 400 (East) Expedition 0404, Leg 7 Section 100 Section 100 Section 400 Section 300 Section 300 Section 400 (West) Section 900 Expedition 0405, Leg 8 Section 200 Section 700
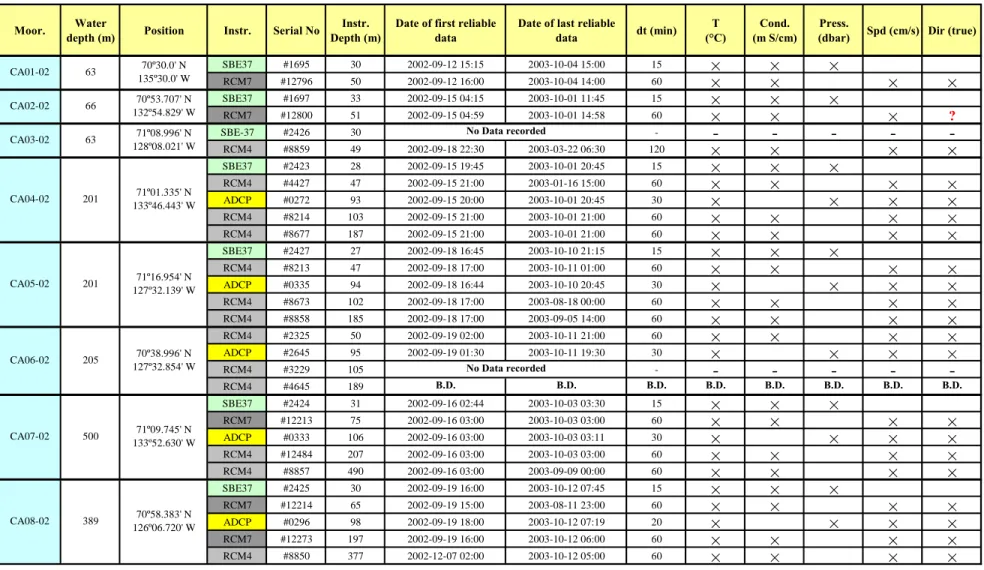
TABLE 5. Summary of moored instruments, CASES 2002-2003.
Moor. depth (m)Water Position Instr. Serial No Depth (m)Instr. Date of first reliable data Date of last reliable data dt (min) (°C)T (m S/cm)Cond. (dbar)Press. Spd (cm/s) Dir (true)
× × ? × × × × × × . SBE37 #1695 30 2002-09-12 15:15 2003-10-04 15:00 15 × × × RCM7 #12796 50 2002-09-12 16:00 2003-10-04 14:00 60 × × SBE37 #1697 33 2002-09-15 04:15 2003-10-01 11:45 15 × × × RCM7 #12800 51 2002-09-15 04:59 2003-10-01 14:58 60 × × × SBE-37 #2426 30 - - - - - -RCM4 #8859 49 2002-09-18 22:30 2003-03-22 06:30 120 × × SBE37 #2423 28 2002-09-15 19:45 2003-10-01 20:45 15 × × × RCM4 #4427 47 2002-09-15 21:00 2003-01-16 15:00 60 × × ADCP #0272 93 2002-09-15 20:00 2003-10-01 20:45 30 × × × × RCM4 #8214 103 2002-09-15 21:00 2003-10-01 21:00 60 × × RCM4 #8677 187 2002-09-15 21:00 2003-10-01 21:00 60 × × × × SBE37 #2427 27 2002-09-18 16:45 2003-10-10 21:15 15 × × × RCM4 #8213 47 2002-09-18 17:00 2003-10-11 01:00 60 × × × × ADCP #0335 94 2002-09-18 16:44 2003-10-10 20:45 30 × × × × RCM4 #8673 102 2002-09-18 17:00 2003-08-18 00:00 60 × × × × RCM4 #8858 185 2002-09-18 17:00 2003-09-05 14:00 60 × × × × RCM4 #2325 50 2002-09-19 02:00 2003-10-11 21:00 60 × × × × ADCP #2645 95 2002-09-19 01:30 2003-10-11 19:30 30 × × × × RCM4 #3229 105 - - - - - -RCM4 #4645 189 B.D. B.D. B.D. B.D. B.D. B.D. B.D. B.D SBE37 #2424 31 2002-09-16 02:44 2003-10-03 03:30 15 × × × RCM7 #12213 75 2002-09-16 03:00 2003-10-03 03:00 60 × × × × ADCP #0333 106 2002-09-16 03:00 2003-10-03 03:11 30 × × × × RCM4 #12484 207 2002-09-16 03:00 2003-10-03 03:00 60 × × × × RCM4 #8857 490 2002-09-16 03:00 2003-09-09 00:00 60 × × × × SBE37 #2425 30 2002-09-19 16:00 2003-10-12 07:45 15 × × × RCM7 #12214 65 2002-09-19 15:00 2003-08-11 23:00 60 × × × × ADCP #0296 98 2002-09-19 18:00 2003-10-12 07:19 20 × × × × RCM7 #12273 197 2002-09-19 16:00 2003-10-12 06:00 60 × × × × RCM4 #8850 377 2002-12-07 02:00 2003-10-12 05:00 60 × × × × 500 71º09.745' N 133º52.630' W 70º30.0' N 135º30.0' W 201 71º16.954' N 127º32.139' W CA08-02 389 70º58.383' N 126º06.720' W CA06-02 205 70º38.996' N 127º32.854' W CA07-02 CA04-02 201 71º01.335' N 133º46.443' W No Data recorded CA05-02 No Data recorded CA02-02 66 70º53.707' N 132º54.829' W 63 CA01-02 CA03-02 63 71º08.996' N 128º08.021' W
Moor. Water
depth (m)
Position Instr. Serial No Instr. Depth (m) Date of first reliable data Date of last
reliable data dt (min) T (°C) Cond. (m S/cm) Press. (dbar) Spd (cm/s) Dir (true) Turb (NTU) Diss. Ox. (μM) Chl a Light ALEC CT #592 27 2003-10-11 00:29 2004-09-27 16:00 10 × × RCM-11 #289 47 2003-10-11 00:30 2004-09-29 15:56 30 × × × × × × B.D ALEC CT #688 34 2003-10-04 04:00 2004-09-07 13:10 10 × × ADCP #3844 102 2003-10-04 04:44 2004-09-07 12:14 45 × × × × RCM-11 #281 202 2003-10-04 04:00 2004-09-07 12:52 30 × × × × × × × SBE37 #2425 33 2003-10-12 21:45 2004-07-28 17:15 15 × B.D B.D ADCP #2645 100 2003-10-12 21:29 2004-07-28 16:30 30 × × × × RCM-11 #271 202 2003-10-12 21:59 2004-07-28 16:58 30 × × × × × × × SBE37 #2427 35 2003-10-11 19:00 2004-09-05 21:00 15 × × B.D ADCP #0333 102 2003-10-11 19:00 2004-09-05 20:30 30 × × × × SBE26 #0371 243 2003-10-11 19:01 2004-09-05 20:31 30 × × SBE37 #1697 17 2003-10-03 22:30 2004-09-08 14:45 15 × × × ADCP #3895 80 2003-10-03 22:30 2004-09-07 14:15 45 × × × × RCM-11 #282 186 2003-10-03 22:30 2004-09-07 14:36 30 × × × × × × × RCM-11 #291 389 2003-10-03 22:30 2004-09-07 14:28 30 × × × × × × × ADCP #0296 90 2003-10-13 15:29 2004-07-18 13:59 30 × × × × RCM-11 #276 190 2003-10-13 04:00 2004-05-21 16:02 30 × × × × × × × ALEC CL #200523 20 2003-10-13 03:30 2004-07-17 13:50 10 × CA9-03 65 70º12.58' N 137º30.856' W RCM-11 #266 47 2003-10-06 04:29 2004-09-09 21:42 30 × × × × × × × ALEC CT #684 30 2003-10-06 23:10 2004-09-08 15:00 10 × × ADCP #3778 95 2003-10-06 22:59 2004-09-08 13:59 45 × × × × SBE37 #2424 54 2003-10-05 22:30 2003-09-09 14:30 15 × × × ADCP #3045 122 2003-10-05 22:15 2003-09-09 13:59 45 × × × × RCM-11 #273 223 2003-10-05 22:30 2003-09-09 13:53 30 × × × × × × × RCM-11 #280 430 B.D B.D B.D B.D B.D B.D B.D B.D B.D B.D RCM-11 #285 840 2003-10-05 22:29 2004-09-09 13:57 30 × × × × × × × RCM-11 #290 1021 2003-10-05 22:30 2004-09-09 13:53 30 × × × × × × × CA4-03 304 71º05.158' N 133º43.392' W CA3-03 64 71º09.182' N 128º07.569' W CA6-03 250 70º35.324' N 127º16.23' W CA5-03 250 7125.225' N 127°22.495' W CA8-03 401 71º00.048' N 125º57.852' W CA7-03 500 71º08.99' N 133º53.88' W CA11-03 1000 70º34.629' N 138º39.289' W CA10-03 250 69°57.307' N 138°40.424' W
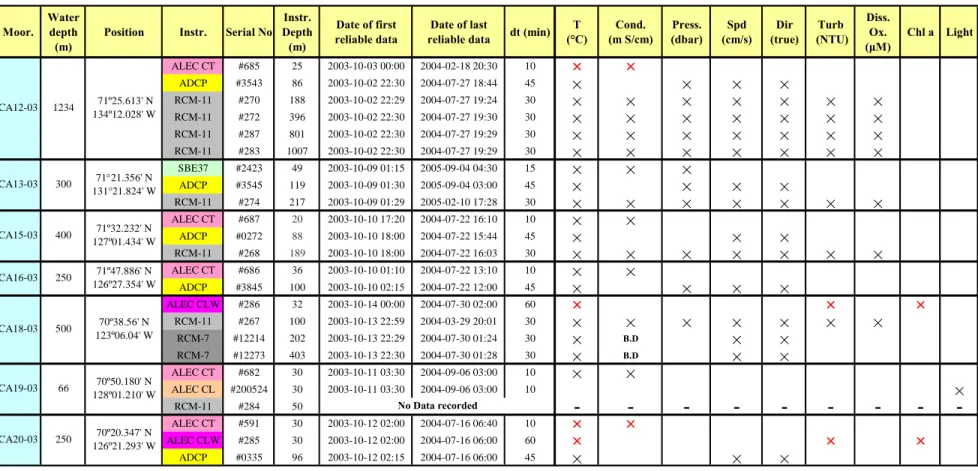
lease notice that B.D. stands for Bad Data. The red color is used for flawed but still available data. P
TABLE 6. Summary of moored instruments, CASES 2003-2004 (page 2/2).
Moor. Water
depth (m)
Position Instr. Serial No Instr. Depth (m) Date of first reliable data Date of last
reliable data dt (min) T (°C) (m S/cm) (d × × × × Cond. Press. bar) Spd (cm/s) Dir (true) Turb (NTU) Diss. Ox. (μM) Chl a Light ALEC CT #685 25 2003-10-03 00:00 2004-02-18 20:30 10 × × ADCP #3543 86 2003-10-02 22:30 2004-07-27 18:44 45 × × × × RCM-11 #270 188 2003-10-02 22:29 2004-07-27 19:24 30 × × × × × × × RCM-11 #272 396 2003-10-02 22:30 2004-07-27 19:30 30 × × × × × × × RCM-11 #287 801 2003-10-02 22:30 2004-07-27 19:29 30 × × × × × RCM-11 #283 1007 2003-10-02 22:30 2004-07-27 19:29 30 × × × × × × × SBE37 #2423 49 2003-10-09 01:15 2005-09-04 04:30 15 × × × ADCP #3545 119 2003-10-09 01:30 2005-09-04 03:00 45 × × RCM-11 #274 217 2003-10-09 01:29 2005-02-10 17:28 30 × × × × × × × ALEC CT #687 20 2003-10-10 17:20 2004-07-22 16:10 10 × × ADCP #0272 88 2003-10-10 18:00 2004-07-22 15:44 45 × × × RCM-11 #268 189 2003-10-10 18:00 2004-07-22 16:03 30 × × × × × × × ALEC CT #686 36 2003-10-10 01:10 2004-07-22 13:10 10 × × ADCP #3845 100 2003-10-10 02:15 2004-07-22 12:00 45 × × × × ALEC CLW #286 32 2003-10-14 00:00 2004-07-30 02:00 60 × × × RCM-11 #267 100 2003-10-13 22:59 2004-03-29 20:01 30 × × × × × × × RCM-7 #12214 202 2003-10-13 22:29 2004-07-30 01:24 30 × B.D × × RCM-7 #12273 403 2003-10-13 22:30 2004-07-30 01:28 30 × B.D × × ALEC CT #682 30 2003-10-11 03:30 2004-09-06 03:00 10 × × ALEC CL #200524 30 2003-10-11 03:30 2004-09-06 03:00 10 × RCM-11 #284 50 - - - -ALEC CT #591 30 2003-10-12 02:00 2004-07-16 06:40 10 × × ALEC CLW #285 30 2003-10-12 02:00 2004-07-16 06:00 60 × × × ADCP #0335 96 2003-10-12 02:15 2004-07-16 06:00 45 × × × CA15-03 400 71º32.232' N 127º01.434' W CA12-03 1234 71º25.613' N 134º12.028' W 300 7121.356' N 131°21.824' W CA13-03 CA18-03 500 70º38.56' N 123º06.04' W CA16-03 250 71º47.886' N 126º27.354' W No Data recorded CA20-03 250 70º20.347' N 126º21.293' W CA19-03 66 70º50.180' N 128º01.210' W
Parameters Units Number of significant digits
Pressure (or depth) dbars 2
Temperature C (ITS-90) 3
Transmissivity % 2
Fluorescence μg/l 2
Salinity PSS (1978) 3
Density, (S,T,P) kg/m3 2
Specific volume anomaly 10-8 m3/kg 0 N2: Brunt-Väisälä frequency 1/sec2 2 Density; (S,T,O) kg/m3 3 Potential temperature (θ) C 3 θ; Sθ kg/m 3 ,O) 3 2 4 3 2 sur 2 Freezing temperature C Dissolved oxygen concentration ml/l
pH no units
Nitrates mmol/m3
PAR pres e dbars
PAR μEinsteins/m2/sec 3
APPENDIX 1. Over-wintering station (ship position: 70o
02.71’N, 126o 18.06’W) and activities on the ice during CASES 2003-2004. The station “Angaguk”, not shown on this figure, was located close to Horton River (69o 58.911’N, 126o 43.529’W).
Rosette and MVP data were collected (Legs 0 to 9).
2.1 Rosette legs 0 and 1……….………...…...… p 2.2 Rosette leg 2 and Winter Station (legs 3 to 7)………..……… p 2.3 Rosette and MVP leg 7.……….……...………... p 2.4 Rosette and MVP leg 8.………….……...……...………...….. p 2.5 Rosette and MVP leg 9.……….……...……….... p
. 22 . 23 . 24 . 25 . 26
Leg 0 – Expedition 0202
Leg 1 – Expedition 0303
APPENDIX 2.1 Maps of Beaufort Sea, Mackenzie Shelf and Amundsen Gulf Rosette
sampling sites, Legs 0 and 1 (Sept-October 2002 and Sept-October 2003).
Leg 2 – Expedition 0304
Legs 3 to the beginning of 7 – Expeditions 0305 to 0404
Winter Station
APPENDIX 2.2 Maps of Beaufort Sea, Mackenzie Shelf and Amundsen Gulf Rosette
Rosette sampling stations
MVP sections
APPENDIX 2.3 Maps of Beaufort Sea, Mackenzie Shelf and Amundsen Gulf Rosette
Rosette sampling stations
MVP sections
osette and MVP sampling sites, Leg 8 (June and July 2004).
Rosette sampling stations
MVP sections
APPENDIX 2.5 Maps of Beaufort Sea, Mackenzie Shelf and Amundsen Gulf Rosette
station or mooring numbers for all CASES scientific expeditions 2002-2004.
3.1 Rosette logbook for Leg 0 (expedition 0202)……….. p. 28 3.2 Rosette logbook for Leg 1 (expedition 0303)……….. p. 31 3.3 Rosette logbook for Leg 2 (expedition 0304)……….. p. 32 3.4 Rosette logbook for Leg 3 (expedition 0305)……….. p. 35 3.5 Rosette logbook for Leg 4 (expedition 0401)……….. p. 37 3.6 Rosette logbook for Leg 5 (expedition 0402)……….. p. 40 3.7 Rosette logbook for Leg 6 (expedition 0403)……….. p. 42 3.8 Rosette logbook for Leg 7 (expedition 0404)……….. p. 44 3.9 Rosette logbook for Leg 8 (expedition 0405)……….. p. 47 3.10 Rosette logbook for Leg 9 (expedition 0406)……….. p. 50
APPENDIX 3.1 Rosette cast locations, sampling time, water depth and corresponding
APPENDIX 3.1 Rosette cast locations, sampling time, water depth and corresponding
APPENDIX 3.3 Rosette cast locations, sampling time, water depth and corresponding
n or mooring numbers. CASES Leg 2, Expedition 0304 (2003) (page 1
APPENDIX 3.3 Rosette cast locations, sampling time, water depth and corresponding
station or mooring numbers. CASES Leg 2, Expedition 0304 (2003) (page 3/3).
"
7,'54 37 "3 2003·11-08 00 47 05 7,'53 St 125'49 11"
"
",
2003·11-08 02"41 03 7,'54 02 125'51 !I.t"
"
'"
200).11-08 0320 U 7,'5242 125'56 56'"
'"
",
200).11-08 a.tl110 7,'5088 126'00 55'"
20'",
2003·11-08 lU 57 49 7,'4977 126'1).t 56'"
20''"
2003·11-08 054127 7,'48 !>4 126'0940 221 2J2'"
2003·11-08 QG 25 56 7,'4681 126"521'"
,~'"
"
2003·11-08 08 J2 51 7,'44 51 12S"539'"
2J1'"
"
2OOJ.11-O& 09 35 21 7,'4393 126'22 68 lU'"
'"
89 2OOJ.11-08 10 31 18 7,'4281 126'2ll 90'"
J1J'"
'"
2OOJ.11-08 114036 7,'4089 126'3087 ,~..
,
'"
,,,
2OOJ.11.(l8 1248 35 7,'3969 126'3594..
,
...
'"
,,,
2OOJ·1l.(l8 13 3921 7,'3855 126'40 14 .~'"
'"
'"
2003·11.11 024440 71'36 02 124'0608 ,~'"
'"
'"
2003·11.11 0840 07 71'2913 124'3099 '0'm
'
"
3" 2003·11.11 1225 30 Il'2562 124'4556'"
'"
'"
lU 2003·11.11 14 09 12 71'2189 124'5853'"
22'
"0'"
2003·11.11 154718 71'1803 125" '61'91
306'
"
'"
2003·11.11 201921 71'1835 125'1079 301 30' m'"
2003·11.12 033128 71'1464 125'23 82'"
~,'"
"0 2003·11.12 05 19 26 7\'10 69 125'3716'"
'"
'"
309 2003·11.12 10 15 2~ 7\'0742 125'52.42'"
38''"
309 2003·11.12 12_3048 7\'0712 125'5011 J15 )83'"
309 2003·11.12 163808 7\'0705 125'48 10"
390'"
309 2003·11.12 183-1 23 7\'06 67 125'5066 38' 388'"
309 2003·1\.13 012551 7\'06 99 125'4976 380 38''"
308 2003·1\.13 075931 7\'0386 126'0325 38' 3~".
30/ 2003·11.13 09 38 31 7\'0011 126'1642 ~, 310'"
306 2003·11.13 124520 70'56 69 126'28 47 3JO ).1''"
306 2003·11·13 155728 70'56 62 126'29 02 329 338 m JO, 2003·11·13 18 13 53 70'52 10 126'4145 29' 3" ,).1 JO, 2003-11·13 1952-10 70'4939 126'Sot 95 26' '10 US J03 2003-11.14 00 17 02 70'4611 127'0845 229 ').1 ,~ JO, 2003-11.14 05 15 12 70'4225 121'2215 20' 206'"
3" 2003·11.14 064417 70'3883 127'3305'"
20' ,)8 300 2003·11·14 161129 70'35 7\ 121'4864 26 JJ",
300 2003·11.14 17 58 31 10'3564 127'4951"
"
'"
300 2003·11.14 20 09 02 10'3544 121'4333 J9'"
300 2003·11.14 21 Sot 29 10'35 « 121'« 52"
'"
200 2003·11.19 225151 69'55 « 126'3215'"
200 2003·11·20 010645 69'5543 126'32 13,
..
200 2003·11·20 024620 69'554-3 126'32-23'---1-'"
200 2003·11·20 161215 69'55 35 126'3205 17 40 29 69'55 35 126'3198,
APPENDIX 3.4 Rosette cast locations, sampling time, water depth and corresponding
APPENDIX 3.5 Rosette cast locations, sampling time, water depth and corresponding
APPENDIX 3.6 Rosette cast locations, sampling time, water depth and corresponding
station or mooring numbers. CASES Leg 5, Expedition 0402 (2004) (page 2/2).
Cal! S!atlon O' SIIIf! d,,'.
'""
latitude Cao! dep!h Sea bonomnumba. moo.ln
U"
IÎm. UTC"
mm
"''''m
."
Wonter 1 200J-03·13""
70"0271 126'1806'"
232 052 Wonter 1 200J-03·U 0141 70"0271 126'1806 227 232 05) Wonter 1 2004-03·U 1535 70"0271 126'1806 225 232 05' Wonter 1 2004-OJ.15 01 38 70"0271 126'1806'"
2J2 055 Wonter 1 2004-OJ.15 13 38 70"0271 126'1806 22' 2J2.56
W"'!er 1 2004-03·15''''
70"0271 126'1806 22J 2J2 05' Win!er 1 2004-03·16'12'
70"0271 126'1806 22' 2J2 05. Won!er 1 2004-03·16 "'2 70"0271 126'1806 22' 2J2.59
Win!er ! 2004-03·17'12'
70"0271 126'1806 22' 2J2'"
Win!er ! 2004-03·17""
70"02 71 126'1806 227 2J2."
Win!er ! 2004-03·18 01 35 70"02 11 126"1806'"
2J2.<2
Win!er ! 2004-03·18 1332 70'02 11 126"1806'"
2J2."
Win!er 1 2004-03·18 21 25 10'02 11 126'1806'"
2J2'"
Win!er 1 2004-03·19 13 40 70'0211 126'1806'"
232.<5
Wimer 1 2OO4-O3·2(l 01 32 10'0211 126"806'"
232'"
Winter 1 2004 -0 3· 2(l 13 37 10'0211 126'1806'"
232'"
Wimer 1 2004·0Hl 01 21 10'0211 126'1806'"
232".
Winter 1 2004·0Hl 13 JO 10'0211 126°1806 2" 2J2'"
Winter 1 2004·0Hl 15 JO 70'0271 126"806 2" 232 01. Winter 1 2004-OH2 01 JO 70'0271 '25"806 2" 232.11
Winter 1 2004-OH2""
70'02.71 12S01806 2" 232.12
Winter 1 2004-OH3 01 29 70'02.71 12S'1806 2" 232.13
Winter 1 2004-OJ.23 1333 70'02.71 12S'1806 2" 232.'"'
W;n,erl 2004-OJ.2J 01 25 70'02.71 12S'1806 2" 232 015 Wonter 1 2OO4-03·2J 13 30 70'02.71 12S'1806 225 232.16
W,n1er 1 2004-03·25 01 30 70"02.71 126'1806 2" 232on
Win1er 1 200J-03·25 1332 70"02.71 126'1806 225 232 019 Wonter 1 200J-03·26 01 30 70"02.71 126'1806 226 232 01' Winler l 2004-03·26''''
70"0271 126'1806'"
232 OB' Wonter 1 2004-03·27 0138 70"0271 126'1806'"
232.91
Wonter 1 2004-03·27 1331 70"0271 126'1806 225 232 OB2 Wonter 1 2004-03·27 1532 70"0271 126'1806 225 232 OB) Wonter 1 2004-03·28'13'
70"0271 126'1806 22' 232."'
Wonter 1 2004-03·28 1528 70"0271 126'1806'"
2J2 OB5 Wonter 1 2004-03·29 02·12 70"0271 126'1806'"
2J2'"
Wonter 1 2004-03·29 lH5 70"0271 126'1806 225 2J2.81
Won!er 1 2004-03·30'12'
70"0271 126'1806 222 2J2.88
Win!er 1 2004-03·30''''
70"0271 126'1806 22' 2J2 OB' Win!er 1 2004-03·31 01 J3 70"02 11 126'1806 22' 2J2.90
Win!er 1 2004-03·31 1333 10"OY71 126"1806 22' 2J2APPENDIX 3.7 Rosette cast locations, sampling time, water depth and corresponding
station or mooring numbers. CASES Leg 6, Expedition 0403 (2004) (page 2/2). Cal! S!atlon O' SIIIf! d,,'.
'""
latitude numba. moo.lnU"
IÎm. UTC"
mm
.51
Wonter 1 200J~·22 1423 70"0271 126'1806 227 052 Wonter 1 200J~·23 0022 70"0271 126'1806 225'"
05) Wonter 1 2004~·23 1218 70"0271 126'1806'"
232 05' Wonter 1 2004~·N 01 25 70"0271 126'1806'"
2J2 055 Wonter 1 2004~·N 12"20 70"0271 126'1806'"
2J2.56
W"'!er 1 2004~·25 00'" 70"0271 126'1806'"
2J2.51
Win!er 1 2004~·25 12-21 70"0271 126'1806'"
2J2 05. Won!er 1 2004~·26 OOll 70"0271 126'1806'"
2J2 05' Win!er ! 2004-04·26 12 31 70"0271 126'1806'"
2J2'"
Win!er ! 2004-04·27 OO~ 70"02 71 126'1806'"
2J2."
Win!er ! 2004-04·27 1238 70"02 11 126"1806'"
2J2.<2
Win!er ! 2004-04·28 0029 70"02 11 126"1806'"
2J2."
Win!er 1 2OO4.()4·28 1223 10"02 11 126'1806'"
2JJ'"
Win!er 1 2OO4.()4·28 1423 70"0211 126'1806 227 2".<5
Wimer 1 2OO4.()4·29 00 JO 10"0211 126'1806 227 2"'"
Winter 1 2004.()4·29 1221 10"0211 126'1806'"
2" 0;;7 Wimer 1 2004·04·30 0027 10"0211 126'1806 227 2" 0;;8 Winter 1 2004·04·30 1223 10"0211 126°1806 226 2" 0;;' Winter 1 2004·0S.{)1 00 19 70"0271 126'1806 226 2JJ .7. Winter 1 2004.{)S.{)1 12 19 70"0271 125'1806 226 2JJ.77
Winter 1 2004.{)S.{)2 0033 70"02_71 12S01806 226 2JJ.72
Winter 1 2004.{)S.{)2 1230 70"02_71 12S'1806 226 2JJ 07) Winter 1 2004.{)S.{)3 0024 70"02.71 12S'1806 227 2JJ.'"'
W;n,er l 2004.{)S.{)3 12_19 70"02_71 12S'1806 227 2" 075 Wonter 1 2OO4.{)S.()4 01 2~ 70"02_71 12S'1806 226 2".76
W,n1er 1 2OO4.{)S4l 12_20 70"02_71 126'1806 227 2".77
Win1er 1 200J'{)54l 14 26 70"02_71 126'1806 227 2" 07B Wonter 1 200J'{)5'{)5 0029 70"02_71 126'1806 227 2JJ 07' Winler l 2OO4'{)5'{)5 12"19 70"0271 126'1806'"
2JJOB' Wonter 1 2OO4'{)5-06 00'" 70"0271 126'1806 227 2JJ
.87
Wonter 1 2004'{)5-06 1222 70"0271 126'1806 227 2JJ OB2 Wonter 1 2004'{)5.{)7 0033 70"0271 126'1806 227 2JJ OB) Wonter 1 2004'{)5.{)7 12-23 70"0271 126'1806'"
2JJ."'
Wonter 1 2004'{)5'{)8 00" 70"0271 126'1806 227 2JJ OB5 Wonter 1 2004'{)5'{)8 12-26 70"0271 126'1806'"
2JJ'"
Wonter 1 2004-45-09 00-21 70"0271 126'1806 227 2JJ."
Won!er 1 2004-45-09 12-22 70"0271 126'1806'"
2JJOB' Win!er 1 2004-45-49
,,,a
70"0271 126'1806m
2JJ.09
Win!er 1 2004-45-49 1625 70"02 11 126'1806 227 2JJ 09. Win!er 1 2004-45·10 0026 70"02 11 126"1806 227 2JJ."
Win!er 1 2004-45·10 1224 10"02 11 12S'1806 227 2JJ 092 Win!er 1 2004-45·11 0022 70"02 11 126'1806 227 2JJ 09) Win!er 1 2004,{)S·11 1223 10"02 11 126'1806'"
2JJ...
Win!e< 1 2004,{)S·12 00" 10"0211 lili'lS-06 227 2JJAPPENDIX 3.8 Rosette cast locations, sampling time, water depth and corresponding
APPENDIX 3.8 Rosette cast locations, sampling time, water depth and corresponding
APPENDIX 3.9 Rosette cast locations, sampling time, water depth and corresponding
APPENDIX 3.10 Rosette cast locations, sampling time, water depth and corresponding
4.1 Ice-CTD logbook for Legs 3, 4 and 5………..……. p. 52 4.2 Ice-CTD logbook for Leg 7……….………. p. 53
APPENDIX 4.1 Ice-CTD casts sampling date and time, water depth and corresponding
station. CASES Leg 3 (0305), 4 (0401) and 5 (0402).
Leg 0305
Station or Start date Start time Cast depth
mooring UTC UTC (m)
Dukuduku 2003-12-14 20:29 220 Dukuduku 2003-12-17 21:00 12 Dukuduku 2003-12-20 20:00 24 Dukuduku 2003-12-20 13:39 230 Dukuduku 2003-12-26 13:15 232 Dukuduku 2003-12-23 20:35 26 Dukuduku 2003-12-29 19:57 29 Dukuduku 2004-01-04 13:35 233
Leg 0401
Station or Start date Start time Cast depth
mooring UTC UTC (m)
Dukuduku 2004-01-29 14:35 20 Dukuduku 2004-02-14 15:38 233
Leg 0402
Station or Start date Start time Cast depth
mooring UTC UTC (m)
Angaguk 2004-03-05 16:00 100 Angaguk 2004-03-08 15:00 107 Angaguk 2004-03-09 11:15 106 Angaguk 2004-03-12 11:17 106 Dukuduku 2004-02-21 09:37 109 Dukuduku 2004-02-29 11:40 229 Dukuduku 2004-03-07 14:00 227 Takatuk 2004-02-22 16:53 -2 Takatuk 2004-02-24 14:47 150 Takatuk 2004-03-05 09:40 150 Takatuk 2004-03-08 13:50 150
station. CASES Leg 7 (0404).
Leg 0404
Station or Start date Start time Cast depth
mooring UTC UTC (m)
Dukuduku 2004-05-24 10:54 15 Dukuduku 2004-05-24 10:57 37 Dukuduku 2004-05-24 11:00 38 Dukuduku 2004-05-26 13:50 25 Dukuduku 2004-05-26 14:25 45 Dukuduku 2004-05-26 14:46 41 Dukuduku 2004-05-26 15:20 7 Dukuduku 2004-05-26 15:33 0 Dukuduku 2004-05-26 15:34 67 Dukuduku 2004-05-26 15:54 65 Dukuduku 2004-06-06 14:22 62 Dukuduku 2004-06-06 14:35 62 Dukuduku 2004-06-06 14:45 58 Dukuduku 2004-06-06 14:56 63 Dukuduku 2004-06-06 15:03 60 Titicaca 2004-05-16 11:00 0 Titicaca 2004-05-19 08:57 8 River 1 2004-05-27 20:01 16 River 1 2004-05-27 21:38 80 River 1 2004-05-27 22:31 108 River 1 2004-05-27 23:30 138 River 1 2004-05-28 00:42 192
APPENDIX 5. Sections of salinity and potential temperature from CASES Rosette data.
Leg 0 (September-October 2002). The same color scale is used for all sections.
5.1 Map of station locations………...……. p. 55 5.2 Section between stations 12 and 6………...…. p. 56 5.3 Section between stations 12 and 34………...…………... p. 57 5.4 Section between stations 48 and 34………...………... p. 58 5.5 Section between stations 65 and 48………...……... p. 59 5.6 Section between stations 66 and 89………...…... p. 60 5.7 Section between stations 89 and 101………...…. p. 61 5.8 Section between stations 101 and 110………...…... p. 62
APPENDIX 5.2 Potential temperature and salinity between stations 12 and 6, Leg 0.
South-West is on the left and North-East is on the right.
o,---~----~----~----~----~----~_, -50
Ê
-100 3 ' - ' -oC 2-
C-O)o
-150 0 -200 _250L-____ L -_ _ _ _ ~ _ _ _ _ ~ _ _ _ _ _ L _ _ _ _ _ L _ _ _ _ ~~ o 10 20 30 40 50 60Distance (km) from South to North
-C
a
0)o
-1 ou 1 ____ -..._ 10 20 30 40 50 Distance (km) from South to NorthAPPENDIX 5.3 Potential temperature and salinity between stations 12 and 34, Leg 0.
South-East is on the left and North-West is on the right.
Ê
-.<:15.
Q)o
Ê
-.<:15.
Q)o
50 100 150 200Distance (km) from South to North
50 100 150 200
APPENDIX 5.4 Potential temperature and salinity between stations 48 and 34, Leg 0.
West is on the left and East is on the right.
Ê
-.c15.
'" -101'O~o
Ê
-.c15.
'"
o
o 50 100 150Distance (km) Irom West to East
o 00 100 100
Distance (km) Irom West to East
APPENDIX 5.5 Potential temperature and salinity between stations 65 and 48, Leg 0.
South is on the left and North is on the right.
Ê
-.c15.
'"
o
Ê
-.c15.
'"
o
40 60 80 100 120 140Distance (km) from South to North
40 60 80 100 120 140
APPENDIX 5.6 Potential temperature and salinity between stations 66 and 89, Leg 0.
West is on the left and East is on the right.
Ê
-.<:15.
Q)o
Ê
-.<:15.
Q)o
50 100 150 200 250Distance (km) from West to East
50 100 150 200 250
APPENDIX 5.7 Potential temperature and salinity between stations 89 and 101, Leg 0.
orth-West is on the left and South-East is on
N the right.
Ê
-.<: -3D,,1-a
Q)o
Ê
-.<:a
Q)o
m
_
00 W 100Distance (km) from West to East
m
_
00 W 100APPENDIX 5.8 Potential temperature and salinity between stations 101 and 110, Leg 0.
West is on the left and East is on the right.
Ê
-.<:15.
Q)o
Ê
-.<:15.
Q)o
20 40 60Distance (km) from West to East
20 40 60
Leg 2 (October-November 2003). The same color scale is used for all sections.
6.1 Map of station locations………...……. p. 64 6.2 Section 100………...…. p. 65 6.3 Section 200………...………. p. 66 6.4 Section 300………...………. p. 67 6.5 Section 400………...………. p. 68 6.6 Section 500………...………. p. 69 6.7 Section 700………...…………. p. 70
APPENDIX 6.2 Potential temperature and salinity along section 100, Leg 2. North-West
is on the left and South-East is on the right.
Ê
-Ê
-.<:15.
Q)o
o o 50 100 150 200 250 300Distance (km) from West to East
50 100 150 200 250 300
APPENDIX 6.3 Potential temperature and salinity along section 200, Leg 2. South-West
is on the left and North-East is on the right.
Ê
-.<:15.
Q)o
Ê
-.<:15.
Q)o
10 15 20 25 30 35Distance (km) from South to North
10 15 20 25 30
APPENDIX 6.4 Potential temperature and salinity along section 300, Leg 2. South-West
is on the left and North-East is on the right.
Ê
-.<:15.
Q)o
Ê
-.<:15.
Q)o
40 60 80 100 120 140Distance (km) from South to North
40 60 80 100 120 140
APPENDIX 6.5 Potential temperature and salinity along section 400, Leg 2. South-West
is on the left and North-East is on the right.
Ê
-.<:15.
Q)o
Ê
-.<:15.
Q)o
50 100Distance (km) from South to North
50 100
APPENDIX 6.6 Potential temperature and salinity along section 500, Leg 2. West is on
the left and East is on the right.
Ê
-.c15.
'"
o
Ê
-.c15.
'"
o
50 100 150Distance (km) from West to East
50 100 150
APPENDIX 6.7 Potential temperature and salinity along section 700, Leg 2. South is on
the left and North is on the right.
Ê
-.c15.
'"
o
Ê
-.c15.
'"
o
-1500 L-~~~--~--~--~--~--~--~--40 60 80 100 120 140Distance (km) from South to North
-1500_L-~~~~~~~~
~~~~~~~--40 60 80 100 120 140
Leg 7 (May-June 2004).
The same color scale is used for all sections.
7.1 Map of station locations……….... p. 72 7.2 Section 100……… p. 73 7.3 Section 300……….... p. 74 7.4 Section 400 (west part)………. p. 75 7.5 Section 400 (east part)………... p. 76
APPENDIX 7.2 Potential temperature and salinity along section 100 Leg 7. West is on
the left and East is on the right.
Ê
-.<:15.
~
-.O()t'i'-,
"1
Ê
-.<:15.
Q)o
o 00 100 100Distance (km) from West to East
o 50 100 150
APPENDIX 7.3 Potential temperature and salinity along section 300, Leg 7. North-West
is on the left and South-East is on the right.
.c
15.
'"
o
-30E"o._10 15 20 25 30 35
Distance (km) from West to East
.c
15.
~
-30 ....~
10 15 20 25 30 35
APPENDIX 7.4 Potential temperature and salinity along western part of section 400, Leg
7. South-West is on the left and North-East is on the right.
Ê
-.<:15.
Q)o
Ê
-.<:15.
Q)o
20 30 40 50 60 70Distance (km) from South to North
20 30 40 50 60 70
APPENDIX 7.5 Potential temperature and salinity along eastern part of section 400, Leg
7. South-West is on the left and North-East is on the right.
.<:
15.
Q)
o
10 20 30 40 50
Distance (km) from South to North
10 20 30 40 50
Leg 8 (June-July 2004).
The same color scale is used for all sections.
8.1 Map of station locations………...………. p. 78 8.2 Section 100………...……. p. 79 8.3 Section 200………...…. p. 80 8.4 Section 300……….... p. 81 8.5 Section 400……….... p. 82 8.6 Section 700……… p. 83 8.7 Section 900……….... p. 84
APPENDIX 8.2 Potential temperature and salinity along section 100 of Leg 8.
North-West is on the left and South-East is on the right.
Ê
-Ê
-.<:15.
Q)o
o o 50 100 150Distance (km) from West to East
50 100 150
APPENDIX 8.3 Potential temperature and salinity along section 200 of Leg 8.
South-West is on the left and North-East is on the right.
Ê
-.<:15.
Q)o
Ê
-.<:15.
Q)o
20 40 60 80 100Distance (km) from West to East
20 40 60 80 100