O
pen
A
rchive
T
OULOUSE
A
rchive
O
uverte (
OATAO
)
OATAO is an open access repository that collects the work of Toulouse researchers and
makes it freely available over the web where possible.
This is an author's version published in :
http://oatao.univ-toulouse.fr/
Eprints ID : 4168
To cite this document :
Bourgeois, Florent and Courteille, Frédéric ( 2010)
Particle-by-Particle Reconstruction of Ultrafiltration Cakes in 3D from
Binarized TEM Images. Chemical Engineering & Technology
-CET, vol. 33 (n° 8). pp. 1290-1296. ISSN 0930-7516
Any correspondance concerning this service should be sent to the repository
administrator: staff-oatao@inp-toulouse.fr
.
Particle-by-Particle Reconstruction of
Ultrafiltration Cakes in 3D from Binarized
TEM Images
Transmission electron microscopy (TEM) imaging is one of the few techniques
available for direct observation of the microstructure of ultrafiltration cakes.
TEM images yield local microstructural information in the form of
two-dimen-sional grayscale images of slices a few particle diameters in thickness. This work
presents an innovative particle-by-particle reconstruction scheme for simulating
ultrafiltration cake microstructure in three dimensions from TEM images. The
scheme uses binarized TEM images, thereby permitting use of lesser-quality
images. It is able to account for short- and long-range order within ultrafiltration
cake structure by matching the morphology of simulated and measured
micro-structures at a number of resolutions and scales identifiable within the observed
microstructure. In the end, simulated microstructures are intended for improving
our understanding of the relationships between cake morphology, ultrafiltration
performance, and operating conditions.
Keywords: 3D reconstruction, Cake microstructure, Multiresolution, Multiscale,
Ultrafiltration
DOI: 10.1002/ceat.201000097
1
Problem Statement
Water purification using ultrafiltration membranes is an in-dustrial-scale process that replaces both coagulation and sand filtration. At present, stakes are high for increasing the cost-ef-fectiveness of the process. One key dimension to this problem is the correlation between ultrafiltration efficiency (production rate and filtrate quality) and the microstructure of the cake, also known as the ultrafiltration cake, that forms on the mem-brane surface during the ultrafiltration process. As in other fil-tration processes, cake microstructure is a crucial element in this problem. But ultrafiltration differs from other filtration processes in that direct observation of the morphology of an ultrafiltration cake is particularly difficult. Because particles are nanosized, only a few techniques are available for capturing local information about the microstructure of ultrafiltration cakes. Amongst them, TEM imaging has been successfully used for direct observation of ultrafiltration cake microstructure [1]. The grayscale information from TEM images is potentially valuable for spatial reconstruction. However, it turns out that the quality of TEM images when imaging nanostructures is
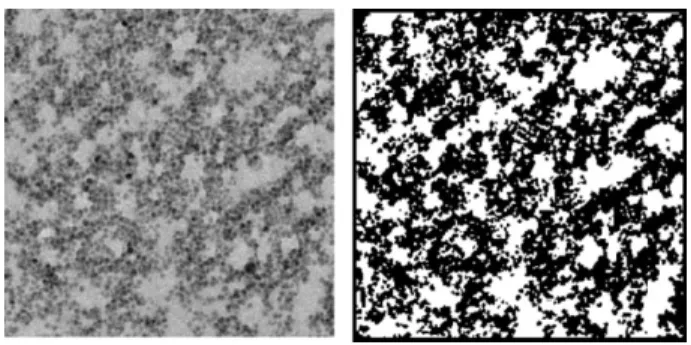
of-ten insufficient for making quantitative use of the grayscale in-formation. Hence, there is value in developing a reconstruction scheme that uses binarized TEM images only. Such images cor-respond to the projection of the particles captured by TEM images onto a plane situated anywhere inside the cake slice captured by the TEM scan. A typical TEM image and its binar-ized transform are shown in Fig. 1 for an ultrafiltration cake obtained using 26-nm monodispersed spherical particles. The thickness of the cake slice captured in this TEM image is 80 nm, which is typical of what can be expected from current TEM machines and sample preparation techniques.
Florent Bourgeois1 Frédéric Courteille1
1University of Toulouse,
Laboratoire de Génie Chimique, Toulouse Cedex 4, France.
–
Correspondence: Prof. F. Bourgeois (florent.bourgeois@ensiacet.fr), University of Toulouse, Laboratoire de Génie Chimique, 4, Allée Émile Monso, 31432 Toulouse Cedex 4, France.
Figure 1. Original and binarized TEM image of an ultrafiltration
2
3D Reconstruction Scheme
In order to reconstruct ultrafiltration cakes from cross-section images, several options can be selected. At one end of the spec-trum of reconstruction solutions, one finds statistical models as described in references [2–5], for example. With the Cox process for instance, Jeulin and Moreau [6] were able to esti-mate the parameters of several Boolean processes which they combined to reconstruct microstructures with aggregates. In general, statistical models can be used provided particles are arranged according to some process whose spatial statistical properties can be extracted from morphological functions measured on 2D images. This approach is elegant and attrac-tive, both computationally and analytically. At the other end of the spectrum, one may consider one of several reconstruction schemes that use numerical optimization algorithms. Exam-ples of optimization reconstruction schemes can be found in references [7–10]. For example, Oberdisse et al. [9] have used the reverse Monte Carlo (RMC) technique for simulating frac-tal aggregates. Although they did not start from images, as they used small-angle neutron scattering (SANS) information in-stead, their procedure starts from a randomly formed aggre-gate, which they rearrange using the RMC
algorithm until the SANS spectrum of the reconstructed aggregate matches the one measured. In principle, optimization tech-niques can be applied to structures larger than single aggregates. However, the task becomes more complex as the number of particles increases. Moreover, choosing the number of particles is a critical step with such reconstruction schemes as the recon-structed volume must be filled with parti-cles before the start of the rearrangement process. The particle rearrangement algo-rithm is also computer intensive. However, there is no reason why such an approach could not be made to work satisfactorily.
The procedure developed in this paper sits somewhere between purely statistical and optimization approaches. The former was not selected on the basis that there is no evidence that ultrafiltration cakes con-form to any particular statistical configura-tion. The authors avoided using the latter approach because they are designed to seek a global optimum, not one solution amongst many. Moreover, optimization schemes present foreseeable difficulties with simulating large volumes. The pro-posed reconstruction approach uses an in-cremental particle-by-particle reconstruc-tion scheme of a cake slice, which corresponds to the volume captured by the TEM image. Adding particles one by one avoids having to specify the number of particles a priori and circumvents the diffi-cult choice of this unknown. At every itera-tion, i.e., every time a new particle is added
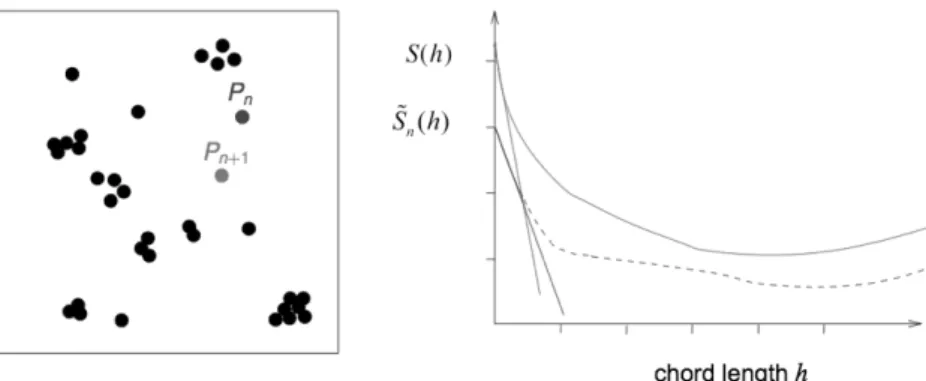
into the system, the point, P(x, y ,z), at which it is implanted is chosen such that it minimizes the difference between the spe-cific surface area of the real microstructure and the spespe-cific surface area of the reconstructed microstructure at the current iteration with the new particle added at point P. In practice, the new particle can be positioned at random locations of two types. If the targeted specific surface area is less than that mea-sured at the end of the previous particle addition step (see Fig. 2), the particle is positioned at a randomly chosen loca-tion such that its projected area does not overlap with that of other particles. Hence, it contributes its whole perimeter to the specific surface area. Otherwise, as shown in Fig. 3, it is posi-tioned at a randomly chosen location such that its projected area overlaps with that of other particles, thereby contributing only marginally to the change in specific surface area.
The specific surface area can be calculated directly from the image by counting pixels that are located at the interface be-tween the porous and solid phases. However, the function that is used in this work is the classical 2-point covariance function,
S [2, 11, 12, 13], which is defined over the set of chords of
length h. Not only is S a reliable means for calculating specific surface area from binary images [3, 11], but it also captures a
Figure 2. The targeted specific surface area is less than that measured at iterationn.
Hence, particle Pn+1is positioned at iterationn+1 at random inside the reconstructed
volume such that its projected area does not overlap with that of other particles.S and
~Sn correspond to the two-point covariance function of the targeted image (solid line)
and the reconstructed structure (dotted line) aftern iterations, respectively.
Figure 3. The targeted specific surface area is higher than that measured at iterationn.
Hence, particle Pn+1is positioned at iterationn+1 at a position such that its projected
area overlaps with that of other particles.S and ~Sncorrespond to the 2-point covariance
function of the targeted image (solid line) and the reconstructed structure (dotted line) aftern iterations, respectively.
meaningful short-range morphological signature of the tex-ture. The authors have found that, despite the fact that the proposed reconstruction algorithm relies on matching the spe-cific surface area only, the 2-point covariance function of the textures reconstructed with the proposed method matches that of the original textures over significant chord lengths. The rea-son for this interesting finding is believed to be the combina-tion of the multiscale and multiresolucombina-tion reconstruccombina-tion scheme that is presented later, and the specified particle shape which constrains the 2-point covariance function significantly.
The next issue consists of capturing the multiscale nature of the texture from the image of the texture, from single particles to large aggregates. Quantification of the multiscale informa-tion of the texture is achieved in two successive steps, as de-scribed in Fig. 4: step one, a set of images of individual scales is generated by successive application of an erosion operator1); step two, the 2-point covariance function is computed for each scale.
The multiscale texture simulation algorithm then simply consists of matching the 2-point covariance function at every individual scale, starting from the upper scale (rightmost im-age in Fig. 4) and moving to the left of Fig. 4 towards the lower scales. Addition of particles reduces the porosity of the image. Hence, the 2-point covariance function, S(h), moves upward every time a particle is added to the system. Once the porosity
of the current scale is matched, the algorithm uses the slope of the 2-point covariance function of the next scale as the next target for the particle-by-particle addition scheme presented earlier. This innovative particle-by-particle addition process gives an optimally-controlled growth of the reconstructed mi-crostructure.
The scale-controlled microstructure reconstruction path fol-lowed by the proposed multiscale scheme was found to yield realistic porous media reconstructions, provided the micro-structure did not exhibit too long a range order. In order to better match the observed microstructure over long ranges, multiresolution was added into the reconstruction scheme. A series of increasingly coarse resolutions, each one characterized by one image, are calculated by applying the dilation opera-tor1)to the original binarized TEM image. Every image thus
generated is analyzed by the multiscale analysis scheme, which identifies the scales within each resolution. Assuming the mul-tiresolution analysis scheme identifies r resolutions and that the multiscale analysis scheme identifies siscales within
resolu-tion i, the reconstrucresolu-tion scheme is controlled by a total num-ber of 2-point covariance functions equal toX
r
i1
si. The total number of resolutions and the number of scales within each resolution depend on the microstructure of the binarized TEM image.
The reconstruction scheme then takes the reverse path. It moves forward by reconstructing the microstructure from the highest resolution down to the lowest one, which is that of the binarized TEM image. The multiscale reconstruction process is used to simulate the texture at each resolution, as described earlier. Particles that are added into the reconstruction volume
Figure 4. Illustration of the multiscale image analysis scheme.
–
1) Erosion is one of the two elementary operators in the area of mathematical morphology [2], the other being dilation. The basic effect of the operator is to erode away the boundaries of regions of foreground pixels (black pixels).
to simulate the texture at any given resolution correspond to the cake particles dilated by the same number of dilations that was used to generate the resolution in question. The positions available for adding particles at resolution n–1 is restricted to the particulate volume of the microstructure reconstructed at resolution n. It is this inter-resolution inclusion principle that gives the proposed reconstruction scheme the ability to match long-range textural order.
3
Results and Analysis
Firstly, the simulation algorithm was tested against images ob-tained from slices through an artificial cake generated using the physico-chemical model developed by Madeline et al. [1]. This is an ideal situation in that particles in the images are spherical and every spatial property is known for the particles inside the cake, making it possible to develop and fully test the validity of the reconstruction scheme.
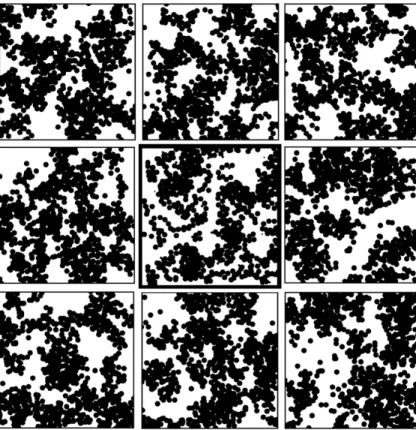
Fig. 5 shows the results obtained when simulating the tex-ture whose frame is bolded with the proposed algorithm. Fig. 5 was deliberately presented as a children’s Spot the difference game, with the original cake slice image placed amongst 8 sim-ulations. Should the bold frame be removed, it then becomes rather difficult to spot the original image in Fig. 5, thereby confirming the potential of the proposed 3D simulation tech-nique for ultrafiltration cake slice simulation. We note,
how-ever, some differences with the reconstruction of the aggre-gates. The cause is an insufficient sampling of the larger particle aggregates in the original image, due to the fact that the technique used to generate the artificial ultrafiltration cake could only produce relatively small cake volumes.
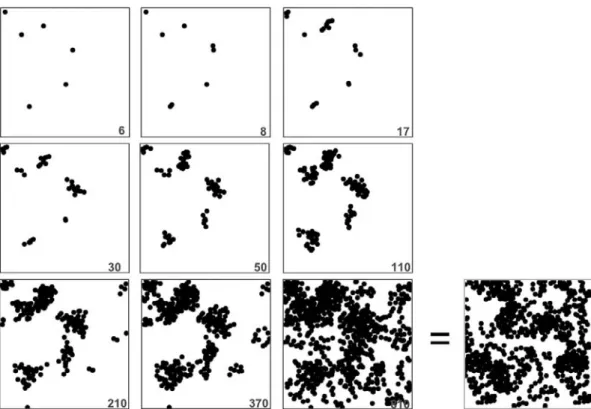
For the sake of illustration, Fig. 6 gives intermediate results of an ongoing particle-by-particle reconstruction at the final resolution, for which the target image is shown in the lower right corner. What is referred to as final resolution here corre-sponds to the lowest resolution, that is the resolution of the observed microstructure. The values at the bottom right cor-ner indicate the number of particles that have been added into the reconstruction slice volume as reconstruction proceeds. One can readily see the progressive state of clustering of the particles, as they are being added into the volume restricted by the reconstruction at the previous resolution according to the scale-controlled reconstruction path.
The second application of the proposed method is the re-construction of the binarized TEM image of a real ultrafiltra-tion cake, which was presented in Fig. 1. Contrary to the artifi-cial cake reconstructed in Figs. 5 and 6, the sampling of the aggregates is more satisfactory, as the field of view is large rela-tive to the size of the largest aggregates. One reconstruction re-sult is shown in Fig. 7, directly to the right of the original im-age. A notable difference with the previous ideal example is that particles no longer appear as spheres in the raw image. This is due to both the size of the particles (26-nm nominal di-ameter) and the binarization step applied to the grayscale TEM image. Nevertheless, the projected image of the simulated slice gives a satisfactory match to the original image. Moreover, as we hinted earlier, Fig. 7 confirms the match between simulated and measured 2-point covariance func-tions at a number of intermediate scales.
Visually, every reconstructed image is satisfacto-ry. One observes that the simulation scheme re-covers correctly both the void space and the state of particle aggregation. The state of aggregation is better recovered than with the artificial cake used earlier as the raw image provides a good sampling of the morphological features that correlate over long distances.
Quantitatively, the quality of the convergence was assessed using chi-square statistics, which showed equality between measured and recon-structed 2-point covariance functions at a confi-dence level greater than 95 %. In particular, the in-terfacial area was precisely matched, as confirmed by the match between the slopes of the 2-point covariance functions near the origin.
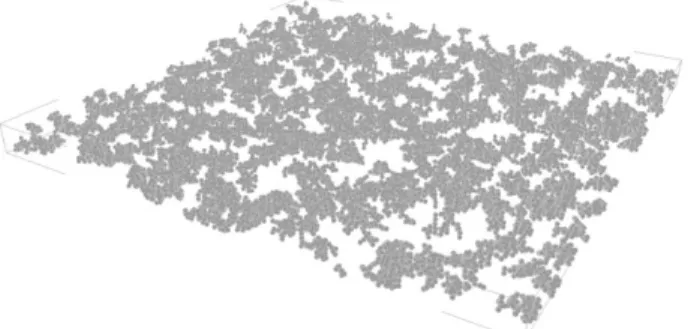
Fig. 8 gives a 3D view of one of the cake slices whose projection was shown in Fig. 7. The recon-struction scheme described here uses binarized TEM images only, which do not contain informa-tion that can be used directly to derive particle po-sition in the vertical direction. Without additional constraint, the reconstruction algorithm yields a particle network that is looser than the real one. This problem is successfully overcome by using the
Figure 5. Projected image of the artificial ultrafiltration cake slice (bold frame)
and 8 projected images of simulated slices using the proposed reconstruction method.
algorithm described above to position particles in the xy-plane and then selecting vertical positions that favor inter-par-ticle contact in 3D where possible (i.e., when the projection of the particle is not isolated in the projected image of the slice under reconstruction). This constraint embeds the physics of
particle deposition in an ultrafiltration cake, which dictates that particles must form a connected network. The authors have checked from artificial cakes (see ear-lier example illustrated in Fig. 6) where the number of particles that are implanted in the reconstructed volume is very close to the number of particles inside the original cake slice. One explanation is that ultrafil-tration cakes are very dilute systems, so al-most every particle inside a slice a few par-ticle diameters in thickness will contribute something to the projected binary image of that slice. In other words, only very few particles can possibly hide directly behind others inside the thickness of the thin cake slice captured by TEM. Nevertheless, the reconstruction scheme presented in this paper does not yield the exact number of particles inside the slice, nor can it possibly "decide" what the best vertical position might be for each particle inside the recon-structed slice.
In the end, 3D reconstruction is in-tended for helping us to investigate and understand the relationships between cake morphology, ultrafiltration performance, and operating condi-tions. A 3D reconstructed porous cake can, for example, be in-put into transport codes as boundary conditions for calculat-ing flow properties. Many publications have been written on investigation of fluid flow from porous media simulated in 3D.
Figure 6. Illustrative example of the scale-controlled particle-by-particle addition scheme at the final resolution.
Figure 7. 3D simulation of a real ultrafiltration cake slice (original binarized TEM image
to the left; simulated image to the right). Measured 2-point covariance functions are rep-resented as a solid line, whereas simulated functions are shown as dotted lines. Confi-dence intervals are given for 300 simulations.
For example, Adler et al. [14, 15] investigated the permeability of porous media from reconstructed porous media. Keehm et al. [16] applied the Lattice-Boltzmann technique, which is par-ticularly relevant with complex porous media for simulation of 3D flow in reconstructed porous media. Many such exam-ples can be found throughout the literature. It should be stressed that a major advantage of reconstructing 3D textures is that it permits generation of many different random realiza-tions, thereby providing confidence intervals for any property that can be derived from microstructure simulations, either by simulation or from direct analysis of the reconstructed micro-structures. For example, the 300 simulations from which one example was given in Figs. 7 and 8 gave the 3D porosity distri-bution shown in Fig. 9. This is a particularly important practi-cal point as it is often the case that only one single ultrafiltra-tion cake image is available for a given set of experimental conditions.
4
Conclusions and Perspectives
This article presented a new scheme for simulating ultrafiltra-tion cakes from binarized TEM images. Such images can be obtained in practice even from poor-quality grayscale images:
this makes the proposed approach particularly valuable for studying the morphology of nanostructures.
The originality of the proposed 3D simulation scheme is manifold. Firstly, the scheme uses a particle-by-particle addi-tion process. Hence, the 3D simulaaddi-tion does not rely upon any assumption about the spatial statistics of the system and simu-lated volumes are not limited in size as with numerical optimi-zation reconstruction schemes. Secondly, the proposed simula-tion scheme simulates multiscale textures successfully by matching the morphology of simulated and measured textures at every individual scale. The morphological properties of the texture at every scale, for any given resolution, are quantified using the 2-point covariance function. Because the scheme adds particles of a given shape and size distribution into the reconstruction volume, it is found that it is sufficient to match the y-intercept and the slope near the origin of the 2-point covariance function in order to obtain satisfactory 3D simula-tions. Thirdly, a multiresolution description of the microstruc-ture is built into the scheme in order to describe long-range order. Overall, the proposed technique is quite straightforward to implement. Convincing simulation results were obtained with both ideal and real ultrafiltration cakes. It should be noted that such conditions correspond to images of thin slices of dilute cakes. Strictly speaking, the proposed scheme is ap-plicable provided that all the particles present in the slice vol-ume captured by TEM contribute in a measurable way to the image. If this condition is not met, as with thick and/or dense slices, the proposed reconstruction scheme should not be ap-plied.
The proposed scheme is not generic. However, all things considered, it requires only a relatively small degree of tuning. Factors that are required include the erosion operator for multiscale analysis, the dilation operator for multiresolution analysis, the shape and size distribution of the elementary par-ticles – which should correspond to the ultrafiltration cake particles – and a rule for positioning particles along the z-axis, since this information is not readily available in binarized TEM images.
Development of a generalized version of this 3D simulation algorithm that solves the problem of reconstructing a whole
Figure 8. Example of a 3D ultrafiltration cake slice simulated
with the proposed multiscale method.
cake from one or more TEM images is ongoing. The principle consists of using a moving reconstruction volume whose thick-ness equals that of the TEM image, centred on the vertical po-sition of the particle that is added during the particle-by-parti-cle addition reconstruction scheme. Hence, a volume larger than the simulated slice is built in the end, in such a way that every slice centred on every particle inside the system has a projected image whose 2-point covariance function matches the measured values. Using an elevation-invariant 2-point cov-ariance function, or an elevation variant function, the tech-nique is able to reconstruct not just one single cake slice, but a whole ultrafiltration cake. Moreover, the technique that is de-veloped here with spheres can readily be applied using other particle shapes (e.g., polyhedra) and distributions of particle size. Hence, with such a technique, which is quite simple to implement, one should be able to simulate a wide variety of multiscale two-phase materials. It is worth noting that the 3D simulation technique presented here could also be applied to multi-phase systems, using inter-phase 2-point covariance functions.
References
[1] J. B. Madeline, Langmuir 2007, 23 (4), 1645.
[2] J. P. Serra, Image Analysis and Mathematical Morphology, Academic Press 1982.
[3] R. P. King, Chem. Eng. J. 1996, 62, 1.
[4] D. Jeulin, Statistics and Computing 2002, 10, 121.
[5] P.-S. Koutsourelakis, G. Deodatis, J. Eng. Mech. 2005, 131 (4), 397.
[6] D. Jeulin, M. Moreau, in Proc. ECS9, Zakopane 2005. [7] C. L. Y. Yeong, S. Torquato, Phys. Rev. E 1998a, 57, 495. [8] C. L. Y. Yeong, S. Torquato, Phys. Rev. E 1998b, 58 (1), 224. [9] J. Oberdisse, P. Hine, W. Pyckhout-Hintzen, Soft Matter
2007, 3, 476.
[10] X. Zhao, J. Yao, Y. Yi, Transport in Porous Media 2007, 69, 1. [11] J. G. Berryman, J. Appl. Phys. 1985, 57 (7), 2374.
[12] Y. Jiao, F. H. Stillinger, S. Torquato, Phys. Rev. E 2007, 76, 031110.
[13] Y. Jiao, F. H. Stillinger, S. Torquato, Phys. Rev. E 2008, 77, 031135.
[14] P. Adler, Porous Media: Geometry and Transport, Butter-worth-Heinemann, Stoneham 1992.
[15] S. Torquato, Random Heterogeneous Materials: Microstructure
and Macroscopic Properties, Springer-Verlag, New York 2001.
[16] Y. Keehm, T. Mukerji, A. Nur, Geophys. Res. Lett. 2004, 31