HAL Id: tel-02518405
https://tel.archives-ouvertes.fr/tel-02518405
Submitted on 25 Mar 2020
HAL is a multi-disciplinary open access archive for the deposit and dissemination of sci-entific research documents, whether they are pub-lished or not. The documents may come from
L’archive ouverte pluridisciplinaire HAL, est destinée au dépôt et à la diffusion de documents scientifiques de niveau recherche, publiés ou non, émanant des établissements d’enseignement et de
Synaptic and cellular mechanisms underlying functional
responses in mouse primary visual cortex
Marta Gajowa
To cite this version:
Marta Gajowa. Synaptic and cellular mechanisms underlying functional responses in mouse primary visual cortex. Neurons and Cognition [q-bio.NC]. Université Sorbonne Paris Cité, 2018. English. �NNT : 2018USPCB125�. �tel-02518405�
Université Paris Descartes
École Doctorale Interdisciplinaire Européenne Frontières du Vivant
Neurophotonics Laboratory, CNRS UMR8250 (dir. V. Emiliani)
Synaptic and cellular mechanisms underlying functional
responses in mouse primary visual cortex
Marta Gajowa
Presented at 23.11.2018
Supervised by Lyle Graham
Jury composition :
Brice Bathellier – reviewer
Alain Destexhe – reviewer
Laurence Cathala – jury member
Federico Trigo – jury member
Abstract
This thesis describes two projects which examine functional neuronal processing in the primary visual cortex of the mouse, from both a population and a single cell perspective.
The first part focuses on the development of an all optical stimulation and readout biological preparation, for the eventual application of constructing a functional synaptic map of primary visual cortex. More specifically, my findings are for the characterization of opsins for this protocol using in vitro recordings from slices of mouse primary visual cortex and CHO cells. I show examples of well working opsin constructs that provide photocurrents enabling induction of an action potential, and how the various features of opsin viral constructs can influence their usability in the context of a functional connectivity project, judged based on whether the evoked photocurrent can lead to reliable induction of an action potential. I describe the biophysical parameters of the studied opsins and their influence on desired temporal patterns of action potentials. Under 2 photon holographic illumination, ReaChR opsin enables sub-milisecond control of single action potential, but the long kinetics of this opsin influences the temporal control for inducibility of the train of action potentials. Results with CoChR - mCardinal stress the influence of opsin expression variability in the preparation, which impacts effective optogenetically induced spiking. I also show how modeling studies facilitate understanding of the influence of biophysical parameters on the evoked current, and can provide a tool to predict the output of different stimulation protocols that take into account conditions influencing the evoked photocurrent.
In the second part I examine visually-evoked synaptic excitatory and inhibitory responses and dissect their influence on the spiking cell output, thus the functional I/O transfer function, based on a large (~60 cell) dataset of in vivo whole-cell patch recordings in mouse primary visual cortex. This part is based on the development of a novel, closed-loop in-vivo protocol that uses the dynamic-clamp method to re-inject parameterized versions of visual-evoked responses back into the same neuron. I find a diverse set of dynamical relationships between visually-evoked excitation and inhibition, with in general weak cross-correlations across the entire response, and occasional highly synchronized transient responses. Inhibitory inputs are consistently larger and show stronger fluctuations than excitatory inputs, with overall higher frequency content. These results suggest that the dynamics of the neuronal code differ between excitatory and inhibitory pathways, and provide constraints on theoretical descriptions based on balanced states between the two. I find that the spiking response to both visually-evoked and steps of simulated synaptic excitation is significantly modulated both linearly and non-linearly by, respectively, visually-evoked and steps of inhibition, including increasing excitation threshold, and reducing both gain and the saturation response. Comparison of the original visual spiking responses to those from the dynamic-clamp protocols suggest quantitative constraints on the relevant time-scale for the underlying neuronal code, in particular when considering rate-based versus spike time - rate-based descriptions.
KEYWORDS: Visual cortex, optogenetics, in-vivo electrophysiology, synaptic interactions, dynamic-clamp
Acknowledgements:
I would like to say thank you to all good-hearted people I met during this journey.
First of all, I would like to thank my supervisor Lyle Graham for being a true supervisor during last four years. Thank you for all the support I got on many occasions during the thesis and before, during my master studies. Especially, thank you for the team work and trust, which help me to grow
scientifically and as a researcher, for reasonable and thoughtful advices and for challenging me on the daily basis.
Secondly, I would like to thank the members of the thesis advisory committee: Alain Destexhe, Uwe Maskos and Alberto Bacci, for useful insights, advice and guidance in taking hard decisions. Thirdly, I would like to thank to the whole ‘FdV family’ (officially known as the FdV doctoral program) – for organizing such an amazing doctoral school. Special thank you to student scientific
coordinators - Sofie Leon and Maria Molina Calavita - for their help in navigation during thesis, possibly straight to the goal; Elodie Kaslikowski, for taking care about all formal side of the program
and saving me a lot of stress; David Tareste and Francois Taddei, for creating a friendly and open atmosphere and scientific courses program, which was truly useful and put us out of the comfort
zone encouraging to think wider.
A special thank you needs to be said to the FdV scientific board members for their support and useful discussions about scientific life and all career advices -Melissa McCartney, Andrew Murray,
Suzannah Rutherford and Saskia van der Vies.
Thank you to the whole CRI family for fostering creativity and sharing their vision of education. To my family. Thank you to my partner for being a companion in all this journey. For his support expressed in the coffee in the morning and taking over much of the duties of our everyday life, so I
could focus on thesis only, especially in the final part of the thesis.
Thank you to my parents for supporting all my crazy ideas and not putting a pause to my excessive additional activities schedule when I was younger. For teaching me that ‘the knowledge is the only
thing no one can take back from you’ and extrapolating this rule to all life domains.
To my brothers and sisters – who expressed their support in many unexpected ways which touch my heart and give a lot of strength.
To my closest friends on whom I could count:
Ida, Anna and Kuba the trio with whom I could share both good and worse moments. I would also like to acknowledge the support of the Neurophotonics Laboratory, in particular the
and sincere good-heartedness. Special thank you to Dimitrii, Eirini, Valeria, Rosella, Emmanuelle, Fabio, Nicolo and Abeer.
And to many others to whom I could talk during moments of weakness and get an advice and with whom I was sharing the good moments.
Table of Contents:
1. Introduction ___________________________________________________________________ 9 1.1. Thesis outline ____________________________________________________________________ 10 2. Deciphering brain function in terms of network architecture and neuronal biophysics ______ 12
2.1.1 Primary Visual Cortex of a mouse __________________________________________________________ 12 2.2. Functional network architecture of primary visual cortex ________________________________ 16 2.2.1. Optical interrogation of network architecture ________________________________________________ 16 2.2.2. Background based perspectives of the structure-function mapping approach _______________________ 17 2.3. Synaptic-spike transduction of cortical neurons ________________________________________ 23 2.3.1. Electrophysiological interrogation of function - neuronal biophysics and experimental approach ________ 23 2.3.2 Perspectives based on current background __________________________________________________ 24 3. An all-optical approach towards circuit interrogation _________________________________ 29
3.1. Experimental Challenges: optical and molecular tools ___________________________________ 29 3.1.1. Optical tools for optical-channels activation _________________________________________________ 29 3.1.2. Light activated channels (opsins) __________________________________________________________ 32 3.1.3. The “Holy Grail” opsin – characteristic ______________________________________________________ 36 3.1.4. Calcium indicators _____________________________________________________________________ 41 3.2. Strategies to obtain an all-optical preparation _________________________________________ 45 3.2.1. Characterization of CoChR - mCardinal viral construct _________________________________________ 45 3.2.2. Characterization of ReaChR-tdTomato viral construct __________________________________________ 52 3.2.3. Co-expressing of multiple viruses in the V1 using AAV injection __________________________________ 58 3.2.4. Discussion on boosting expression _________________________________________________________ 66 3.3. Characterization of opsin kinetics in CHO cells: towards the modeling of photocurrents ________ 71 3.4. Discussion ______________________________________________________________________ 79 3.4.1 Reaching threshold for spiking ____________________________________________________________ 79 3.4.2. Dealing with artifacts – limitations of the technique and possible improvements ____________________ 80 4. Functional synaptic dynamics of receptive fields in primary visual cortex _______________ 88
4.1. Background information ___________________________________________________________ 88 4.1.1. Conductance: meaning in neurophysiology __________________________________________________ 88 4.1.2. Synaptic conductance measurements- technical comments _____________________________________ 91 4.1.3. The art of conductance estimation _________________________________________________________ 94 4.2. Conductance changes underlying visual processing ____________________________________ 103 4.2.1. Early findings on cat primary visual cortex __________________________________________________ 103 4.2.2. Conductance changes in mouse primary visual cortex_________________________________________ 105 4.3. Investigation of synaptic input changes in light anesthesia conditions: experimental results ___ 111 4.3.1. Conductance change in mouse V1 – experimental results. _____________________________________ 111 5. Probing the transfer function of a neuron in vivo ___________________________________ 128
5.1. Neuronal code and possible mechanisms of implementation ____________________________ 129 5.1.1. Terminology and scientific context ________________________________________________________ 129 5.1.2. Shunting inhibitory conductance _________________________________________________________ 131
5.3. Playing with input amplitude - I/O dependence on E/I balance ___________________________ 148 6.Discussion ___________________________________________________________________ 156
6.1. Alternative methods of conductance estimation: ______________________________________ 156 6.2. Influence of conductance estimation procedure to results interpretation __________________ 157 6.3. Comparison of experimental findings: _______________________________________________ 158 6.4. I/O transfer function ____________________________________________________________________ 160 6.5. E/I balance definition and consequences: ____________________________________________ 161 7. Methods: ___________________________________________________________________ 163
7.1.in vivo electrophysiology for neuronal code studies: ____________________________________ 163 7.1.1. Animal model ________________________________________________________________________ 163 7.1.2. Data acquisition and protocols: __________________________________________________________ 164 7.1.3. Data analysis _________________________________________________________________________ 167 7.2. In vitro electrophysiology for opsin characterization ___________________________________ 170 7.2.1. Expressing an opsin in the biological preparation ____________________________________________ 170 7.2.2. Electrophysiology _____________________________________________________________________ 172 7.2.3. Data acquisition and protocols ___________________________________________________________ 173 7.2.3. Imaging and photostimulation ___________________________________________________________ 174 7.2.4. Data analysis _________________________________________________________________________ 176 8. Appendices: _________________________________________________________________ 178
8.1. Appendix 1: Two-photon holographic stimulation of ReaChR ____________________________ 178 8.2. Appendix 2: Two-photon optogenetics by computer-generated holography ________________ 179 Bibliography: __________________________________________________________________ 180
1. Introduction
Feature selectivity of cortical neurons, one example of functional properties in the brain, is the ability of neurons to respond to particular stimulus attributes - e.g. the receptive field of a neuron in primary visual cortex (V1) with respect to object movement direction. This thesis contributes to understand how feature selectivity arises in mouse V1. It is divided into two parts, each based on distinct approaches to elucidate visual processing mechanisms, the first at a population level and the second at the single neuron level.
First, on a population level, I have developed tools towards an eventual project that combines 2-photon optogenetics, 2-2-photon imaging and traditional whole cell electrophysiology to map functional connectivity in V1. This map will provide a link between cell tuning (i.e. cell function) and network architecture, enabling quantitative and qualitative distinction between two extreme scenarios in which cells in mouse V1 are either randomly connected, or are associated in specialized subnetworks. Here I describe technical validation of the method, with the main focus on finding the appropriate biological preparation and reagents.
Second, based on whole-cell patch recordings of single mouse V1 neurons in vivo, I characterize visually-evoked synaptic conductances and the associated neuronal input-output (I/O) transfer function. I employ a novel closed-loop in vivo protocol based on a combination of current, voltage and dynamic clamp recording modes. I first measure the basic I/O transfer function of a given neuron with current steps under current clamp, and with excitatory and inhibitory conductance steps under dynamic clamp. I then measure the visually evoked spiking output of the neuron, under current clamp, and its synaptic conductance input, under voltage clamp. Finally, I reintroduce variations of the visually evoked conductance input to the same cell, under dynamic clamp, to construct the functional I/O transfer function. I find that visually evoked synaptic excitation and inhibition are dynamically unbalanced in visual cortex, which I describe in the context of theories based on balanced excitatory inhibitory states. I describe and compare the different I/O transfer functions, which allows a characterization of the mathematical operations performed by the neuron. I find that synaptic inhibition based on visual responses has both a linear and divisive impact on the spiking response to synaptic excitation based on the same visual response. Furthermore, modifications of the relative scaling and the temporal characteristics of the reintroduced synaptic excitation and inhibition enables dissection of each component’s role in shaping the spiking output, as well as to infer overall differences between various physiological cell types (e.g. regular-adapting, presumably excitatory, versus fast-spiking, presumably inhibitory, neurons). Finally, examination of the transfer functions, in particular their dependence on temporal modifications, provides insights on the relationship between the neuronal code and the biophysical properties of neurons and their network.
1.1. Thesis outline
The first part of my thesis is focused on the efforts undertaken towards the validation of an ‘all-optical stimulation and readout' protocol. Combined with the in vivo patch clamp technique, this approach has been developed in order to map functional connectivity of V1. In this context neuronal function is defined as feature selectivity, and connectivity by the pattern and strength of the synapses providing input to a given neuron, characterized by their individual receptive field properties. Such a population map is a necessary step to link network architecture and circuit function, and thus to understand visual processing mechanisms on a population level.
To more fully understand the neuronal processing that underlies circuit function, the functional mapping, characteristic to systems neuroscience, needs to be supported by a biophysical study elucidating neuronal computation at the single cell level. This comprises the second part of my thesis, where I have described the transformation of synaptic input evoked during visual stimulation to the neuronal spiking output. This was accomplished by the application of a closed loop approach, combining traditional patch clamp protocols with the use of the dynamic clamp recording mode in vivo, enabling the systematic probing of a cell with modifications of its original “natural” synaptic input. This probing protocol helps to describe the different roles of excitatory and inhibitory synaptic components in shaping the neuronal output, and thus the mathematical operations underlying neuronal processing,
Thus, contributing towards understanding the neuronal code and neuronal biophysics of computation.
In chapter 2 I describe briefly the logic behind the technical aspects of each part of the project, the specific biological questions, and finally a common scientific context for both projects. Next, I will focus on my contributions to the functional connectivity mapping project (Chapter 3), explaining various aspects towards validation of the optogenetic methods. Since the thesis duration allowed only for contributing to technical aspects of the all optical stimulation and readout I present the results of my work and contribution to other lab projects in that context.
In the second part of my thesis I will present my results on studying functional processing in mouse visual cortex, focusing on two aspects:
-Characterization of visually evoked synaptic conductances, thus contributing to understanding visual circuit functioning (Chapter 4)
-Description of the input-output transfer function of single neurons, thus contributing to general understanding of neuronal processing rules (Chapter 5)
to explaining the method in detail, and to elaborate on important technical aspects influencing the interpretation of the measurements. Some part of the discussion (chapter 6) refers to the technical aspects, as well as compare the findings with the literature.
All the tools used in both parts of this thesis project shaped my understanding of the problems and scientific perspective with a mutual benefit. I am closing this thesis with a small comparison of the two technological approaches used, stressing the limitations and possibilities they give (Chapter 6, section 6.6).
In summary, this thesis is an interdisciplinary work, integrating different approaches to a problem, using different technical combinations and applying elements of theoretical investigations to the experimental work.
2. Deciphering brain function in terms of network architecture and
neuronal biophysics
The early visual system, including V1 decomposes the visual scene into single, simple attributes. The cells in V1, the first major cortical area that receives visual input from the lateral geniculate body in the thalamus, respond selectively to these decomposed attributes - for example, to the orientation and direction of a visual feature. Orientation and direction selectivity (tuning) was first discovered by Hubel and Wiesel in the cat and was a seminal result towards understanding how visual processing occurs(Hubel and Wiesel 1962). Since then, an enormous body of work has been aimed towards understanding how the neurons in V1 are wired together and what is the role of each cell in the circuit.
In this section I am presenting a short synthesis of the knowledge regarding both the V1 circuit architecture and feature selectivity. This synthesis provides the reader with the background knowledge about V1 circuit – the model of this thesis.
In this first part I am only focusing on findings describing neuronal architecture or tuning in V1 separately. In the following sections, I am describing both projects of this thesis with addition of more project-specific scientific context.
2.1.1 Primary Visual Cortex of a mouse
Neuronal circuit architecture in V1
Visual cortex, as a part of the neocortex, follows the universal structure of six distinguishable layers of neurons, as well as the less well-defined concept of cortical columns. In rodents the cortical column is considered to have a diameter of 0.3 mm and contain around 7 500 neurons (Markram et al. 2004)L2/3, which is the main focus of the thesis, lies 125-135μm below the brain surface(Xu et al. 2016). As in other parts of the neocortex, it contains around 20-30% of interneurons and 70-80% of excitatory cells. This ratio varies a bit in between layers, with exception of L1, which contains almost only interneurons (Markram et al. 2004).
Neocortical circuit architecture seems to follow a universal structure among different modalities, repeating a similar motif (Mountcastle 1997) with subtle but essential modifications are found between different cortical areas. In general, excitatory connections of various modalities obey a certain laminar organization of structure and connections. Thalamic input arrives in L4, whose neuronal afferents mainly contact L2/3. Descending projections from L2/3 terminate in L5 and L6 (Gilbert and Wiesel 1979). In L2/3, excitatory pyramidal cells tend to connect with each other sparsely, with only a 19% probability (Hofer et al. 2011).
Functional properties of cells in V1 (focus on the L2/3)
Description of receptive fields in cat primary visual cortex (Hubel and Wiesel 1962) initiated characterization of cell functional properties and tries to find the link between cell function and circuit architecture. Receptive fields are parts of the space within a stimulus is influencing response of a particular neuron. As such, receptive fields presence and shape is a consequence of a circuit architecture at all the previous stages. In this context, the first, very simplistic definition of neuronal function is to react when the stimuli will appear in the receptive field of a given neuron. This definition is further developed, as neurons differ between each other in the response they provide, depending on various stimuli characteristic. The functional properties of neurons such as orientation and direction selectivity, investigated in this thesis, and others, like spatial and temporal frequency, speed or contrast, together creates the necessary primitives for the eventual perception of a visual scene in higher visual areas.
There is no complete agreement between authors about the exact numbers and proportions of cells selective to various functional parameters. These differences are usually due to different methods, which can favor one or another type of cells (Gao, DeAngelis, and Burkhalter 2010). The work of Niel and Stryker on mouse V1 receptive field properties, using silicon electrode arrays, has provided useful data concerning functional properties of cells in mouse V1. Indeed, the mouse model has only been extensively investigated in recent years, motivated by the possibility of genetic modifications that are impractical with the cat. Generally, the selectivity of V1 neurons in the mouse to various attributes of visual stimuli increases in more upper layers (Cristopher M Niell and Stryker 2008) (Figure 1), suggesting that these layers are fulfilling a key role in the perception of the image. These authors determined that 74% of cells are selective to the orientation of a drifting grating, with a predominance of narrowly tuned cells, especially in the upper L2/3. Analysis of direction selectivity (by comparison of responses to opposite directions that correspond to the same orientation) revealed that about 23% of orientation selective cells are also tuned for a preferred direction, with a bit higher selectivity for cells in L2/3 and 4. This finding corresponds to other findings in the mouse, rat, rabbit and macaque, with the number varying between 24-28% between different species (reviewed in Gao et al., 2010).
Figure 1 . Orientation and direction selectivity in mouse V1 (modified after C. M. Niell & Stryker, 2008). (A) Histogram presenting all orientation selective cells distribution of orientation selectivity index. Excitatory and inhibitory cells are marked in grey and black respectively. (B) Same as A, for direction selectivity index. (C) and (D) Layer distribution of direction and orientation selectivity index. (E) Mean OSI values for layer and inhibitory cells. (F) Tuning width change across layers. In more superficial layers, both the orientation and direction selectivity indices are higher and more sharply tuned.
The same authors also report spatial frequency tuning (in cycles of a presented grating pattern per degree of visual field), which defines the width of the bar in the grating, in the range of 0.02 – 0.09 c/deg, with the preferred median being equal 0.03c/deg. Similar values were recorded in L2/3, equal to 0.04 c/deg for excitatory neurons. The selectivity of inhibitory neurons and neurons in layer 6, is characterized by a significantly lower preferred spatial frequency of 0.02 c/deg. The median preferred spatial frequency of the mouse was found to be significantly different than in a cat (0.9 c/deg) and macaques (1.5-4.2 c/deg), corresponding to the much lower spatial resolution of mice vision (reviewed in (C. Niell 2015). Additionally, in 90% of neurons, a specific cut off value was found that is always lower than ~0.43c/deg, above which the activity of cells decreases to 10% (Gao et al., 2010).
Temporal frequency tuning indicates the timing acuity of neurons, with more than 90% of V1 cells showing temporal frequency tuning (Gao et al., 2010) (median response frequency of ~2Hz, and ~4Hz for layer 4 cells).
inhibitory cells, respectively (C. M. Niell & Stryker, 2008). It is noteworthy to point out that the increase of the spiking frequency during the visual response above baseline is most dramatic for excitatory cells in L2/3. Moreover, inhibitory cells, and cells in L5, which have the highest spontaneous spiking frequency, are at the same time characterized as being least selective cells for various stimulation properties. This might suggest the different role of L2/3, L5 and interneurons in the information processing (and possibly different code).
A change in stimulus contrast has a weak influence on tuning properties, rather acting as a scale factor for the response amplitude, with the strongest response at 100% contrast. Although it is worthy to mention that we can distinguish cells which respond quickly to even small changes in contrast tend to be characterized by steep contrast saturation curve (sigmoidal), whereas other neurons have a lower sensitivity to contrast change (Gao et al., 2010). Cells in L2/3 are especially sensitive to contrast change (C. M. Niell & Stryker, 2008).
2.2. Functional network architecture of primary visual cortex
2.2.1. Optical interrogation of network architecture
Understanding of any system requires understanding two components: the circuit architecture and its individual unit functions. In the context of the primary visual cortex circuit the connections between the cells constitute the circuit structure. The neuronal function is the ability of a neuron to respond selectively to a repertoire of a stimuli. Historically, researchers had access only to one elements of the circuit - the structure or the function (as reviewed in previous subsection), sometimes supplemented with indirect measurement of the other component. Usually, also the description in hand was limited to only a snippet of the real, physiological situation, because of technological limitations. This situation limited strongly the success in linking the two essential circuit components.
In this project we had the goal to develop a protocol to perform a large scale functional connectivity mapping of V1, filling the gap between pure structural or functional maps by providing the link between the two. To achieve that a validation technique with a functional biological preparation is needed. The designed combination of techniques includes:
• calcium imaging: use of a fluorescent probe, which reports the level of neuronal activity (firing) during visual stimulation. This step would provide information about the function of a neuron, for instance, its tuning.
• “whole-cell” patch clamp technique: a traditional electrophysiology technique to monitor the membrane potential of a neuron or its currents fluctuations. This technique serves in this protocol for detection of synaptic connections between cells.
• optogenetics technique: enables genetic modification of neurons to make them light sensitive. This technique combined with 2 - photon photostimulation gives the possibility to excite single or groups of neurons by light and thus, map the connections between pre- (stimulated by light) and post-synaptic (patched) neuron.
• 2 - photon Computer Generated Holography - technique enabling light shaping into a desired spatial pattern, allowing to illuminate and photoactivate only specific neuron of interest. In the context of the combination of these techniques, my contribution to the project falls into developing a biological preparation which could be used effectively to apply this electro-optical investigation of the functional connectivity map.
Practically, in this project my focus has been the searching of the right optically sensitive channel (opsin), which could be paired with calcium sensor for in-vivo recording in mouse V1.
2.2.2. Background based perspectives of the structure-function mapping approach
The functional mapping protocol described in previous section, enables to screen an unprecedented high number of pre-synaptic candidates during experimental session than other existing technique, such as, for instance, patch-clamp pair recording. Additionally, due to whole-cell patch clamp, the strength of the connection and or input conductance could be assessed. Added to that anatomical context information about the function of the total, or at least the majority, of the cells screened for connection would enable us to strive today neuroscience questions by providing more accurate large-scale description of the circuit performance. Such a description would enable us to understand how the function of cell emerges from the circuit architecture, how important is the wiring pattern, if it exists, towards creating tuning properties and finally, what are the strategies of information processing and how are they different between rodents and other mammals?
Below, I will elaborate on some of the hypotheses existing in literature providing the experimental background and pointing out how the proposed combination of techniques would help to investigate particular aspects of functional connectivity.
2.2.2.1. Functional subnetworks or random connections
What is the connectivity pattern between similarly oriented cells in mouse V1? How important is the wiring pattern, if it exists, towards creating tuning properties?
The work of (Ko et al. 2011) suggests the existence of functional subnetworks of pyramidal cells. The double step protocol, using first OGB calcium imaging in vivo and second multi - electrode patch clamp connectivity studies in vitro was applied to investigate in detail the connectivity between pyramidal cells in relation to their tuning. Results revealed that cells sharing the same orientation or direction sensitivity tend to be more frequently connected. The big caveat of interpreting of this work is the fact that the second part was done in vitro and thus some of the connections were cut. On the other hand, the number of cells examined was also low (one could investigate group of 3 - 4 cells at a time).
Similar functional subnetwork perspective is emerging form studies of Wertz et all. GCaMP6s calcium imaging in the mouse shows that in about one third of pyramidal cells in L2/3, all presynaptic cells share the same selectivity as the target neuron (creating tuned networks) (Wertz et al. 2015). This study took advantage of retrograde trans-synaptic trafficking of rabies virus inducing GCaMP6s expression, injected to single pyramidal cell in L2/3, allowing the expression of calcium indicator that was restricted to a target pyramidal cell and all its pre-synaptic neurons. The remaining two thirds of the identified networks were untuned. The spatial distribution of the connections showed that
Vreeswijk 2012) shows that in mouse V1 a totally random connectivity between the cells is enough to obtain orientation selectivity observed.
This contrasting examples stress the need of a systematic, big-scale study investigating connectivity and function at the same time to learn the rules about how such subnetwork would be created and the tuning differences within such an ensemble of cells is still not well explained.
2.2.2.2. Connectivity description and its influence for signal processing:
a) Assessment of the main information flow paths
An exemplary mapping study, with the use of glutamate uncaging, showed that excitatory neurons in L2/3 of V1 receive the strongest excitatory input from L4 and L5a, weaker from L2/3 and minimal from L6. On the other hand, excitatory L2/3 neurons were reported to receive a majority of inhibitory inputs from L2/3, L4, L5a and L1 Inhibitory connections in L2/3 were also much easier to detect, taking into account their high IPSC amplitude (~50 pA) and the probability of inhibitory input to excitatory cell was assessed to be around 50% within L2/3, and 30% if the input was from L4. Additionally, this study found that cells in L2/3 do not receive significant inhibitory transmission from deep infragranular layers (L5 and L6, low probability of connection and small amplitudes) and are the only excitatory population that obtain connections from interneurons in L1 (Xu et al. 2016)
This work done in slices in vitro provides useful information about possible paths of information flow at the level of local circuit. Additionally, drafted before Connectivity in V1 can be complemented with the findings of other researchers focusing more in detail on particular connections examining more in detail their specific properties and the cell type they relate. For example, studies on rat V1 showed that fast – spiking interneurons preferentially connect to neighboring PCs, which in turn provided them with reciprocal excitation (Yoshimura and Callaway 2005). Furthermore, a fine scale circuit rule was noticed. Fast spiking interneurons were usually connected with two other PCs, which were also reciprocally connected. Such fine-scale circuits were not found in the case of adapting, inhibitory neurons (Yoshimura & Callaway, 2005).
It is hard to integrate together precise information about the connectivity of specific cell types within layers because studies are done with the use of different techniques that can potentially influence the results (e.g. the amplitude and latency of inputs, and the percentage of connections between different cell types) and the consequent interpretation. Once again, this is why descriptive, mapping studies on a large scale are highly valuable.
that pyramidal cells (PCs) with correlated calcium imaging responses shared strong reciprocal connections in L2/3, even if there were far more weak connections, and weak connections linked neurons with uncorrelated responses (Cossell et al. 2015).
Thanks to population and layer specific ChR2 expression, the studies demonstrated that somatostatin interneurons (SOM) connect to pyramidal neurons with a 43% probability, typically at a target location 200μm from the soma (Adesnik et al. 2012) This connection was characterized by a post-synaptic signal amplitude (31,3±11,5 pA) that was twice as large, and a latency (1,29±0,2 ms) that was shorter, in comparison to PC to PC input (amplitude: 15,7±2,36 pA, latency: 3,33±0,42 ms)(Fino and Yuste 2011). On the other hand, fast-spiking, weakly tuned interneurons (considered to be PV expressing interneurons, comprising up to 10% of neuronal population) receive input from neighboring PCs with a high 88% probability (EPSP amplitude ~1 mV) (Hofer et al., 2011).
Presented studies present a snippet of circuit architecture with insights into subpopulations building the circuit. Again, integration of the knowledge inferred from studies using different techniques pose obstacles for results interpretation and this suggest again the need a more versatile and high throughput investigation approach. In the context of these findings it would be especially interesting to ask what the proportion of suggested previously tuned vs untuned networks is and what would be the role of weak connections towards shaping the post-synaptic cell’s response.
c) The role of the inhibitory/ excitatory populations
Investigation of the inhibitory network has benefited from the use of calcium imaging. One of the earliest studies of GABAergic neurons with calcium imaging (using Fura-2 sensor) confirmed a broader tuning of interneurons in comparison to PCs (Sohya et al. 2007). This result was confirmed via a combination of OGB imaging and immunohistology, where broad tuning was shown to be a characteristic feature of all inhibitory neurons, regardless of type (PV, SOM, VIP - positive) (Kerlin et al. 2010). Additionally, combining OGB loading and electron microscopy has allowed for the retracing of connections between cells of known function, showing that inhibitory cells in L2/3 receive excitatory input from differently tuned cells in the neighborhood, which could explain the broad tuning of interneurons (Bock et al. 2011).
These findings raised the question about the function of different cell types, especially in the context of different connection schemas between each inhibitory cell subtype and PCs. Subsequently, inhibitory networks started to be investigated with optogenetic tools. The combination of conditional expression of ChR2 in particular cell types and layers, with patch clamp recordings, allowed more insight on that question. PV interneurons (supposedly fast –spiking cells), which target perisomatic regions of PCs, were found to sharpen neuronal feature selectivity. This was an effect specific to PV
Niell & Stryker, 2008) with the use of the dynamic clamp method. The study showed that an increase of inhibition delivered by the dynamic clamp sharpened tuning. In addition, a decrease of inhibition caused a reduction of cell selectivity (B.-H. Liu et al. 2011).
In these findings the 1-Photon optogenetic combined with single patch clamp recording allowed only to assess the influence direction of a whole population excitation on a single cell pyramidal cell function and thus, provides us only a snippet of a real situation.
2.2.2.3. Integration of synaptic input by the cell
a) Population perspective
The balance between excitatory and inhibitory inputs shapes the spiking output of the neuron. Such balance includes both the ratio and strength of excitatory and inhibitory synapses to the output cells, as well as their temporal interplay.
The study comparing the selectivity of excitatory and inhibitory input conductance in cats with selectivity of the cell for either orientation or direction selectivity showed three possible input schemes, which contribute in different ways to the output response of a cell. The majority of cells (60% for orientation selectivity and 70% of those for direction selectivity) had both excitatory and inhibitory inputs tuned to the same orientation/ direction as the cell’s output, with some differences in input selectivity, in particular the relative width of the input tuning curves. Importantly, in general the temporal overlap of the excitatory and inhibitory input conductances were out of phase for the preferred stimulus and in phase for the non- preferred stimulus. The other two groups, less frequently detected but still significant, were either characterized by a complete mismatch in the preferred orientation / direction for both inputs and the cell output, or partial mismatch, where only the excitatory conductance was tuned similarly as the cell output (Cyril Monier et al. 2003).
Similar measurements of the excitatory and inhibitory inputs in mouse did not show the change in phase observed in cats, but found that both excitatory and inhibitory inputs were similarly tuned as the spike output with a high correlation (r = 0.83) ( a. Y. Y. Tan et al. 2011; B.-H. Liu et al. 2011) (Figure 2). In both of these studies, cell type was not assessed, but it is likely that taking into account the number of cells recorded both excitatory and inhibitory cells were represented.
Both of these measurements, try to relate synaptic input measured in the cell by conductance measurements with the cell output and function. Conductance measurements provide the information about summed synaptic input from all the circuit before the recorded cell but the information about the function of the particular presynaptic cells and the weight of their contribution to the postsynaptic cell is unknown. The mapping protocol could provide this context.
b) Single cell perspective
A study combining targeted patch-clamp in vivo and fast 2- photon calcium imaging (GCaMP6s) showed that neurons in mouse visual cortex have several differently tuned ‘hot spots’ in their dendrites, which seems to be spaced randomly. Such ‘hot spots’ could be described as areas on the dendrite responding selectively for visual stimulation. 72% of these ‘hot spots’ were sharply tuned, and were found in all recorded cells regardless of the degree of spike tuning (or lack of tuning) (Jia et al. 2010). Another, study utilizing GAaMP6s presented similar hot spots. Additionally, an analysis of spine tuning in relation to cell selectivity showed that summed synaptic input to individual neurons allow for reliable prediction of neuron orientation preference (Wilson et al. 2016) (study conducted on ferret).
These studies focused on analysis of the functional profile of both the whole cell and its sub-compartments could largely benefit by adding the information about influence of specific pre-synaptic cell of known type and function. It would enable to ask about connections distributions and strength shading light into the mechanism of creation of described hot spots. In other words, one could verify if the hot spots are created by single cell vs. several cells input and what would be their origin and input strength.
Figure 2 Visually - evoked conductances for cat and mouse in response to preferred(left) and orthogonal orientation(right). Scale bar for mouse: 5nS, for cat 2 nS. After Tan et al.2011
2.2.2.4. Current background knowledge synthesis
Altogether, these results suggest a sparse network of pyramidal cells in V1 with some degree of specificity among their connections and synaptic strength (strongly connected networks of PCs, whose selectivity properties would be strongly correlated), contrasted with a dense but weak connectivity of inhibitory neurons that provide a representation of local activity that counterbalances the more specific excitation. Excitatory and inhibitory synaptic connectivity is spatially balanced across the excitatory neuronal network in V1. Statistical comparison of the location of synaptic inputs across cortical layers did not show a significant difference, showing that pyramidal neurons obtain a similar distribution of inhibition and excitation across V1 layers (Xu et al., 2016). The balanced distribution of excitation and inhibition is contrasted with unbalanced tuning properties across cortical layers, which suggest an increase in information filtering across layers (stronger selectivity in more upper layers), especially in the L2/3, which receives input from all other layers. Nevertheless, the exact mechanism and rules of information flow, especially in the L2/3, is still not well understood. The specific application of the methods developed in this project will fill several gaps in current knowledge, in particular because of our all in-vivo approach, in contrast to previous studies. For example, we will be able to derive functional connectivity data based on a larger population that previous work (Cossell et al. 2015; Ko et al. 2011). Comparison of synaptic conductance measurements between visually-evoked responses and optogenetic stimulation of candidate afferent neurons will allow us to gain insight in the balance description between inhibition and excitation on the recorded cell, in particular to decipher quantitative and qualitative differences between intra and interlayer connections. Indeed, it is important to perform such studies in vivo, among other reasons given the physiological high synaptic background activity present in the context of studies reporting how global brain state can significantly modify the synaptic properties of an investigated (Kwan and Dan 2012).
2.3. Synaptic-spike transduction of cortical neurons
2.3.1. Electrophysiological interrogation of function - neuronal biophysics and
experimental approach
Feature selectivity differs among the neurons in V1. Although the majority of V1 neurons respond to differently oriented stimuli, tuning might change on cell to cell basis within the same population of cells (e.g. Pyramidal neurons) (Cristopher M Niell and Stryker 2008). Understanding of the link between the synaptic input to a cell, which might differ depending on cell function, and spiking output, which constitutes the signature of cell feature selectivity is crucial to understand neuronal processing. To characterize this link, we are asking about both the nature of synaptic input and about the biophysical computations performed by the neuron. The biophysical approach adopted in this project searches for the mechanisms that enable cells equipped with the same cellular machinery to vary their output depending on the input. Furthermore, it will dissect the role of different components important for the process and help to describe biologically relevant information for a given neuron. In the end, this biophysical description frames neuronal processing as mathematical operation/s, which can then be translated into theoretical studies.
Therefore, in the second part of the thesis I am focusing on characterization of two aspects:
1. The visually evoked synaptic input: In this part I am measuring variations in the amplitude and dynamics of synaptic inputs. Observation, of synaptic input changes as a signature of circuit wiring might provide insights into feature selectivity.
2. The input – output transfer function of a neuron: In this part I describe how the synaptic input to a cell shapes the neuronal spiking output. I am searching for a universal description of a neuron as an integration unit. Such description should be true for neurons not only in V1 but also provide general insights into the nature of neuronal computation. Further, I am taking into account the electrophysiological firing type of the cell (FS, RA vs. bursting) eventually for describing how the general I/O function changes depending on the neuronal population under consideration.
Experimental approach:
We validate a closed-loop protocol for single cell probing in vivo in the low anesthesia regime (0,25% isoflurane). The protocol combines traditional whole cell protocols under current and voltage clamp mode with the application of dynamic clamp. Dynamic clamp performed under in vivo conditions constitutes the main novelty and heart of the closed loop approach enabling us to mimic synaptic
As first steps, we characterize the cellular properties of a neuron and the spiking response of a cell to a given stimulus direction. Next, in voltage clamp mode, we measure visually evoked conductances associated with the same visual stimuli. This initial part of the protocol serves to describe the variability of synaptic inputs occurring in visual cortex and provides the reference synaptic input waveforms for the next part of the closed loop. In the second part, the synaptic input waveform based on visually-evoked conductance measurements is iteratively modified and reintroduced back to the same neuron, while recording spiking output. Comparison of spiking outputs and artificially introduced synaptic waveforms provide the input-output transfer function of a single neuron. The subsequent modifications of the synaptic input applied during the protocol scales the amplitude of excitatory and inhibitory components and thus, changes the E/I ratio. This step enables the dissection of the different roles of excitation and inhibition in neuronal computation. Additionally, changes in the temporal dynamic of both components, thus changes in the integration time window, enables a description of the relevant resolution for the neuronal code.
Some of the cells were also probed by the application of stereotypical conductance steps. This synaptic input constitutes the simplified temporal dynamics and a constant E/I ratio. As such, this project contributes to the question of the importance of spike timing for the neuronal code and how the balance between excitation and inhibition (E/I balance) determines functional responses.
In summary, we are able to characterize the neuronal input-output transfer function that describes the mathematical operations underlying neuronal processing depending on electrophysiological type of the cell.
Application of such a closed-loop protocol have a few important advantages. First, we are able to perform measurements in vivo under close to physiological conditions taking advantage of intact circuit architecture and the low anesthesia brain state.
Second, we are performing all the recordings on the same cell, taking advantage of extracting function, synaptic input and cellular parameters at the same time. In contrast, to other studies, we are able to interact with the cell using a repertoire of various physiologically relevant scenarios. For example, we could apply synaptic input with an increased excitatory component. In the same manner, we could apply different input characteristics of the input in particular bandwidth. The impact of these manipulations on the cell enables us to infer rules of neuronal processing at biophysiological level.
2.3.2 Perspectives based on current background
One of the mysteries of neuroscience is understanding the neuronal code.
Previous attempts towards describing the neuronal code have been restricted by the range of information measured, thus allowing only for eavesdropping of a particular group of cells in a
circuit. Providing quantitative insights into brain computation serves both basic physiological studies as well as identification of pathophysiological mechanisms. Additionally, this study provides important constraints that are applicable to theoretical studies and industrial applications, e.g. processor architectures based on neuronal networks.
First, presented in this work characteristic of neuron allows to gain more insight into the neuronal code. More precisely, we were able to describe the functional I/O properties of neurons and eventual differences between different electrophysiological types or recording cortical layers.
Secondly, as this work is embedded in the context of visual circuit, the results deliver insight into the mechanisms of visual processing in primary visual cortex of the mouse. Information about visually evoked conductance, has been reported in a few papers (Haider, Häusser, and Carandini 2013; B.-H. Liu et al. 2011; A. Y. Y. Tan et al. 2011), and to date there is no complete agreement in the reported results. Our analysis of conductance measurements further contributes to the topic about synaptic dynamics in V1 in the context of cell selectivity at the level of its inhibitory and excitatory inputs and its functional spiking output.
Presented project allows for revision of some previous findings and push the understanding of neuronal computation forward.
2.3.2.1. Excitatory/Inhibitory balance in V1
There is a common agreement in the field about balanced E/I ratio at the level of the whole circuit. However, the reported in various studies ratios differ depending on the definition of balance and conditions of study. Study of (Xue, Atallah, and Scanziani 2014) investigated E-I balance in pyramidal cells of V1. They establish presence of E-I balance ratio at the level of unitary postsynaptic currents in all pyramidal cells, even if the cell to cell amplitude of synaptic excitation and inhibition was varying. Similar finding providing definition of E-I balance might be find in other papers (M. S. Wehr and Zador 2003; Haider et al. 2006; Haider, Häusser, and Carandini 2013). On the other hand, In the (Haider, Häusser, and Carandini 2013; B.-H. Liu et al. 2011) the predominance of inhibition was clearly presented. Predominance of inhibitory conductance over excitatory was also found previously in anaesthetized cat intracellular recordings (M. Rudolph et al. 2007).
In our project, we have measured the evoked conductance in almost awake animal condition. Therefore, we are able to discuss presented findings and provide a detailed description of excitatory-inhibitory balance in mouse primary visual cortex. Further, we are scaling the excitatory and inhibitory components and probe neuron using different E/I ratios. This step, enables us to change the E-I ratio and see the neuronal response for eventual change.
Additionally, by probing neuron with different E-I ratios we regularly probe neurons with inhibitory part lower than this originally recorded. Results from such ratios can be discussed in the context of
2.3.2.2. Temporal dynamics of Excitatory and Inhibitory part
Temporal relation of excitation and inhibition can provide insights into circuit processing mechanisms. Conductance measurements in cat area 17 reveled close to 180 degrees temporal shift between excitatory and inhibitory components, which was confirming ‘push-pull’ theories constituting visual processing (A. Y. Y. Tan et al. 2011). In contrast, in mice such relation was not found, and only small temporal shifts was measured (majority cells smaller than 30 degrees) ( A. Y. Y. Tan et al. 2011)(Fig.2, previous section). Additionally, the short delay of inhibition in reference to excitation found in rat primary auditory cortex was found to sharpen temporary precise neuronal response for the sound frequency (M. S. Wehr and Zador 2003).
Results of our project will be discussed in the context of various temporal dynamics recorded in low anesthesia regime. Additionally, the modifications of the temporal dynamics (conductance steps injections) elucidate importance of fluctuations for synaptic components.
2.3.2.3. Influence on the integrative neuron properties
Several theoretical and experimental studies tried to respond the question about the neuronal code. On one end we have the rate-based code hypothesis, according to which the information is encoded in the averaged spiking rate. It says that neuron act as temporal integrator. On the other end we have spike time-based code according to which the neuron act like coincidence detector. However, nowadays it is postulated that the neuron (pyramidal) operates in between these two modes (Rudolph and Destexhe 2003; Ratté et al. 2013). Conductance change during visually- evoked response varies strongly in time and amplitude fulfilling description of high conductance state (Destexhe, Rudolph, and Paré 2003). One of the biggest consequences of conductance change is the change of the neuronal time constant and resulting from it temporal window for input integration. Therefore, this change influences the operating mode of the neuron. On the other hand, it is also postulated that the input characteristic – it’s synchrony influences neuronal processing (Ratté et al. 2013).
In this study, we are measuring visually - evoked conductance and therefore will provide description of the synaptic input dynamics to the cell. We will investigate the amplitude of excitatory and inhibitory part and their ‘sharpness’ changing in time providing description of the input synchrony coming from the circuit (averaged over repetitions). Further, the probing applied in this study delivers experimental evidence about neuron output in various E/I balance conditions as well as with various fluctuating inputs. Thus, we are delivering direct experimental evidence of neuronal computation, which in turn provides further understanding of the relation between synaptic input influence on the neuron processing.
2.3.2.4. I/O transfer function
Conductances shapes the spiking output of a neuron. However, there is no common agreement about how this phenomenon occurs. More precisely, how excitatory and inhibitory parts influence the output. Some of the experimental studies point to the presence of synaptic noise as to the modulator of neuronal gain (Destexhe, Rudolph, and Paré 2003). Other studies point out possible mechanisms influencing neuronal gain like the activation of particular channels was experimentally shown (Vervaeke et al. 2006; Graham and Schramm 2018).
Here, we are asking about the role of shunting inhibition and excitation in shaping of the neuronal output. According to our knowledge our probing protocol investigating influence of various E/I ratios and fluctuation levels constitute a first experimental demonstration of this kind in vivo. We will show how I/O transfer function is changing upon inputs as simple as conductance steps or physiological, visually evoked synaptic input and its smoothed version. This description will provide a rich base of qualitative and quantitative parameters.
2.3.2.5. Common ground of both projects
The ultimate goal of all kinds of functional connectivity projects (referring to the physical connections, their synaptic strength, spatial arrangement or systematic description of the local architecture) is to understand link between the function of a cell and circuit architecture. The understanding of the process ultimately should deliver a description of precise neuronal computation process. Systems neuroscience endeavors to describe local and global architecture in order to predict the synaptic input and link it with various architecture arrangements.
In a project where cells’ connectivity would be mapped while knowing the cell function, the goal would be to infer how much each projection could contribute to the cell functional response. For that, a characterization of connections and the statistics on their number and strength is needed (Figure 3, left). Reversing this question to a single cell perspective means that the connections characteristics can be approximated by conductance measurements (Figure 3, right) which is done in the I/O transfer function project of this thesis.
Focusing on how the cell processes inputs from the circuit, delivers understanding on the biophysical operations performed by the cell, independently from the architecture of the circuit. It is characterizing the whole synaptic input to the cell. The functional connectivity project on the other hand, describes how the subparts of synaptic input contributes for cell response and from where physically they come from. In this context, the transfer function project complements the mapping project described in previous sections. Ultimately both projects results should be in agreement.
Figure 3 conceptual project comparison. Left – functional connectivity project. Right – I/O transfer function project. Functional connectivity is inferred by sequential holographic stimulation of opsin expressing presynaptic candidate and assessment of the post synaptic candidate current/voltage changes. The function of a cell is characterized based on calcium imaging step. On the other hand, the transfer function project does not recognize single cell inputs but the sum of the whole visually evoked synaptic input to a cell (split to a inhibitory and excitatory component). The cell function is inferred by assessment of spiking evoked in response to various direction/orientation of drifting grating.
3. An all-optical approach towards circuit interrogation
3.1. Experimental Challenges: optical and molecular tools
The achievements of an all-optical optogenetic control and monitoring of cell activity is a main challenge in the field of optogenetics. To tackle this problem one requires a proper combination of optical and molecular tools.
More specifically, concerning the photoactivation of neurons, one would like first, to be capable to induce activity on specifically selected neurons, with single cell resolution.
Additionally, the timing of the photoinduced should be controlled will millisecond temporal
resolution.
Here in this work we will use an optical technique, better described in the next section - Computer Generated Holography, that will allow to shape light over specific cell body of interests. This approach, developed and widely characterized by the Emiliani’s laboratory, when applied under 2-photon excitation, allows to photoinduce activity of arbitrary sub-ensemble of neurons deep in tissue with high spatial and temporal resolution (more details in the following section 3.1.1) (review from Oron et al. 2012).
The right biological preparation, which requires the combination of a calcium sensor and an opsin that provides the desired precision, is under development and my first part of the thesis was devoted to this optimization. During the project duration I have contributed to test various opsin candidates for the desired performances. Additionally, my work contributed to draw the clear limitations of the constructs available at that time and to understand better the importance of the fundamental biophysical properties of light-gated channels to achieve a reliable all-optical method for circuits mapping.
In the next sections I will introduce the reader with technical part of the protocol used for opsins validation as well as with basic informations about light-gated channels and calcium sensors. I will finish this part with the description of the desired biological preparation, and I will present the results of the subprojects I was working on. I finish this chapter with a short discussion of these results and perspectives for an all-optical circuits manipulation.
3.1.1. Optical tools for optical-channels activation
researchers. 1-photon microscopy allows efficient and relatively easy activation of optical channels in cell populations (Boyden et al. 2005; Judkewitz et al. 2009; S. Lee et al. 2012; Tye et al. 2011). Together with the development of genetic tools, optical technologies are improving. In fact, the choice of the activation method is as important as the choice of the optogenetic tool, and there is a strong co-dependence between the two, as some activation methods will show better performance in combination with different opsins. Today, a broad range of optical designs is available to researchers. 1-photon microscopy allows efficient and relatively easy activation of optical channels in cell populations (Guo, Hart, and Ramanathan 2009; Szabo et al. 2014). However, there is still a wide range of applications in which single cell resolution deep in tissue is required.
2- photon illumination-based techniques provide much better penetration and spatial resolution allowing the illumination to remain localized on the volume of the target -the opsin expressing cell (Packer et al. 2012; Eirini Papagiakoumou et al. 2010). However, the low 2-photon cross section of opsin and the small single channel conductance, made difficult to achieve the reliable triggering of action potential in neurons with a single static 2-photon diffraction-limited spot. To address this problem, enlarging the excited surface in order to target as many light-gated channels as possible in opsin expressing cells, has been an important goal for the development of 2-photon techniques for optogenetics.
We can distinguish two main groups of methods aimed at improving the light delivery to the tissue: scanning and parallel approaches. Scanning approaches are based on quick movement of a tiny diffraction limited laser spot across several points in the sample. To induce sufficient current to bring the cell to action potential threshold, the excitation spot must “visit” several places across the cell membrane, stopping at each long enough to open the channels. To improve scanning approaches, the scanned diffraction-limited spot can be slightly enlarged by underfilling the back aperture of the objective, to be able to activate bigger population of channels per scanned location. Together, these factors have allowed for successful photostimulation of ChRexpressing single neurons under 2-photon illumination (Rickgauer and Tank 2009) while, more recently, simultaneous scanning of multiple points allowed multicell in vivo excitation expressing the slow opsin C1V1 (Packer et al. 2015)(Yang 2016). Nevertheless, this intrinsically sequential approach, exciting point and by point and not simultaneously each location, can affect efficiency in current integration or can impose some limitation in the achievable temporal performances (Ronzitti et al. 2017). This is true particularly with fast opsin (with short off kinetics).
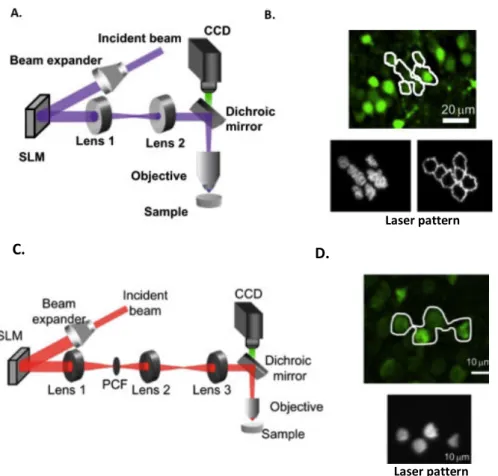
On the contrary, parallel approaches are based on exciting the entire targeted area at once, typically the whole cell body. This can be achieved by using optical approaches based on the modulation of the phase of the laser beam, which allows the creation of an arbitrary shape of illumination. Two techniques has been developed and applied in Emiliani’s lab for this purpose: Computer Generated holography (CGH (Lutz et al. 2008)) or generalized phase contrast (GPC) (Eirini Papagiakoumou et al.
(LC-SLM), it reshapes the laser beam in arbitrarily defined patterns. Generalized phase contrast instead, is a technique based on interferences between two differently dephased parts of the laser beam, that can reproduce arbitrary intensity pattern on the sample plane.
These two approaches, although presenting some differences, they can both reproduce pattern of illumination tailored over specific region of interest with micrometric lateral precision. Additionally, when applied under 2-photon excitation and coupled with an approach named temporal focusing (Oron, Tal, and Silberberg 2005), illumination can be well confined also on the axial direction, resulting in an excitation volume that can match the size of a typical neuronal cell body.
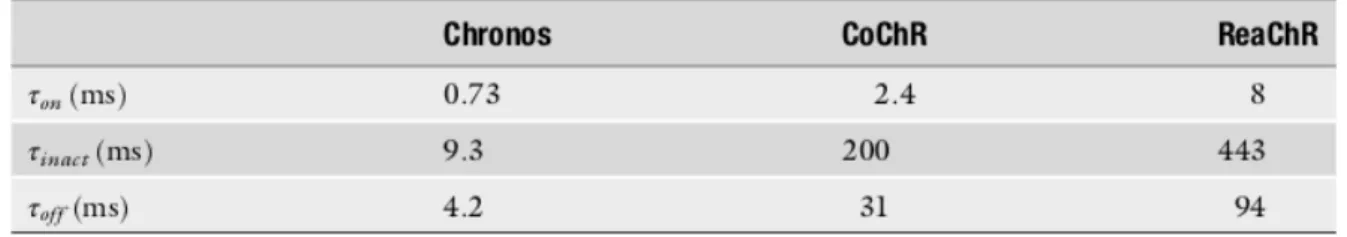
Both the GPC and CGH techniques have been used successfully in optogenetics over past years (Bègue et al., 2013; Hernandez et al., 2016; Papagiakoumou et al., 2010; Szabo et al., 2014). The simultaneous illumination of all the light-gated channels over the cell surface allows to maximize current integration, exploiting at the maximum the characteristic of each opsin optimizing the temporal performances in the photoactivation. As a consequence, these techniques can work very efficiently with both slow and fast kinetics opsins. Indeed, the performance of parallel approach was shown in combination with ChR2 (Papagiakoumou et al., 2010), C1V1 (Bègue et al., 2013), ReaChR (Chaigneau et al. 2016), Chronos (Ronzitti et al. 2016) and CoChR (Shemesh et al. 2017).As will better discussed in the Results section, in all these preparations single cell photoactivation was achieved, and high temporal precision was obtained, characterized by a short AP latency (<10 ms) and jitter (<1 ms) , and spiking frequencies up to 100 Hz was achieved for fast Chronos opsin (Ronzitti et al. 2016). However, the limitation of parallel approach could be the total laser power needed for targeting all of a desired group of cells, that could be either not achievable or could induce thermic damage (Picot et al. 2018). The use of amplified pulse lasers can overcome this limitation and significantly reduce the required laser power.
3.1.2. Light activated channels (opsins)
3.1.2.1. Historical backgroundThe origin of the idea of introducing Channelrhodopsin (ChR) – an algal protein enabling phototaxy – into neuronal cells appears for the first time in two papers – first by Boyden and Deisseroth, who expressed ChR2 in hippocampal neuronal culture (Boyden et al. 2005) and second by Zhuo-Hua Pan and colleagues who expressed it in retina (Bi et al. 2006). An interesting anecdote is that both papers were first rejected by high-profiles journals, and their findings were treated with skepticism and no appreciation of the potential for the new technique.
Although the symbolic beginning of optogenetics in neuroscience is typically considered to be in 2005, at that moment there were already a few groups working on techniques which would enable
Laser pattern
Laser pattern
C. D.
Figure 4 Parallel optical techniques for two-photon optogenetics. A: Schema of an optical holographic set up, and (B) few example of excitation pattern of a group of cells and its contour C: Schema of an optical GPC set up and (D) example of excitation shape, drawn based on a fluorescent image of the cells. (Modified after (Oron et al 2012)).