HAL Id: hal-02152062
https://hal.archives-ouvertes.fr/hal-02152062
Submitted on 20 Mar 2020
HAL is a multi-disciplinary open access
archive for the deposit and dissemination of
sci-entific research documents, whether they are
pub-lished or not. The documents may come from
teaching and research institutions in France or
abroad, or from public or private research centers.
L’archive ouverte pluridisciplinaire HAL, est
destinée au dépôt et à la diffusion de documents
scientifiques de niveau recherche, publiés ou non,
émanant des établissements d’enseignement et de
recherche français ou étrangers, des laboratoires
publics ou privés.
and Their Performance in Lithium-Ion Batteries
Sanghoon Kim, Mario De bruyn, Johan Alauzun, Nicolas Louvain, Nicolas
Brun, Duncan Macquarrie, Lorenzo Stievano, P. Hubert Mutin, Laure
Monconduit, Bruno Boury
To cite this version:
Sanghoon Kim, Mario De bruyn, Johan Alauzun, Nicolas Louvain, Nicolas Brun, et al.. Dehydration
of Alginic Acid Cryogel by TiCl 4 vapor: Direct Access to Mesoporous TiO 2 @C Nanocomposites
and Their Performance in Lithium-Ion Batteries. ChemSusChem, ChemPubSoc Europe/Wiley, 2019,
12 (12), pp.2660-2670. �10.1002/cssc.201900781�. �hal-02152062�
access to mesoporous TiO
2
@C nanocomposites and their
performance in lithium ion batteries
Sanghoon Kim,
[a]Mario De bruyn,
[b]Johan G. Alauzun,
[a]Nicolas Louvain,
[a,c]Nicolas Brun,
[a]Duncan J.
Macquarrie,
[b]Lorenzo Stievano,
[a,c]P. Hubert Mutin,
[a]Laure Monconduit,*
[a,c]and Bruno Boury,*
[a]Abstract: A new strategy for the synthesis of mesoporous TiO2@C
nanocomposites via the direct mineralization of seaweed derived-alginic acid cryogel by TiCl4 through a solid/vapour reaction pathway
was developed. In this synthesis, alginic acid cryogel can act multiple roles; i) mesoporous template, ii) carbon sources, and also iii) oxygen source for the TiO2 precursor, TiCl4. The resulting
TiO2@alginic acid composite was then transformed either into pure
mesoporous TiO2 by calcination, or into mesoporous TiO2@C
nanocomposites by pyrolysis. By comparing with a non-porous TiO2@C composite, the importance of mesopore in the performance
of electrodes for lithium ion batteries based on mesoporous TiO2@C
composite is clearly evidenced. In addition, the carbon matrix in the mesoporous TiO2@C nanocomposite also show electrochemical
activity vs. lithium ions, providing twice the capacity of pure mesoporous TiO2 or alginic acid derived mesoporous carbon (A600).
Given the simplicity and environment friendliness of the process, the mesoporous TiO2@C nanocomposite could greatly satisfy the main
prerequisites of green and sustainable chemistry, while showing improved electrochemical performance as negative electrode for lithium ion batteries.
Introduction
The demand for enhanced electrochemical energy storage devices such as portable electronic devices or hybrid electric vehicles is ever increasing.[1],[2] This stimulates the search for more sustainable processing of the required materials, better respecting the Green Chemistry Principles. Metal oxides (MxOy) and MxOy@C composites are among such required materials[3-5] and many efforts have been devoted to the fine tailoring of hierarchical macro- to microporous structures with tailored controlled porosity,[6],[7] doping,[8],[9] particle size[10-12] and structure.[13],[14] In this context, biomass polymers such as lignin or polysaccharides as C-source or bio-templates are intensively explored as starting reagents for the processing of
nanostructured C, MxOy and MxOy@C composites for applications in clean and efficient energy production and storage.[11],[15-19]
To process the material, atomic layer deposition[20-22] or chemical vapor decomposition[23,24] are not competitive with solution processing that offers better productivity, safety and simplicity. Sol-gel, hydrothermal and solvothermal processes have been extensively and sometime successfully used with soluble (starch, alginic acid, lignin) or insoluble (cellulose) biopolymers.[3],[25-27] This represents one of the basic idea of the Extreme Biomimetic approach, a special field in bioinspired materials science, which includes all types of hydrothermal synthesis as well as all the new way to assemble bio-template with synthetic material, by in vivo or in vitro reactions.[28] For example, the extreme biomimetic was used to obtain and describe rare examples of the assembly and binding between protein and metals such as Cu(0) or Fe(0).[29] A unique structure was obtained with chitin as scaffold for ZrO2/chitin nanoassembly[30,31] with the application for supercapacitors.[32] Spongin is another attractive material to prepare MnO2/C[33] or TiO2/Spongin material[34] for electrochemical application or depollution, respectively. However, cellulose is so far the most widely used template for such approach, as both carbon source and template in the preparation of nanocomposite such as Ag@TiO2/C[35,36] or SnO2/C[37] as negative electrode material for lithium ion batteries. Recently, the use of alginic acid has been developed in sol-gel templated process to elaborate porous metal oxide-based catalyst.[38,39] In terms of Green Chemistry, these processes present some drawbacks using water or solvents, sometimes high temperatures (>100°C) and reagents requiring synthetic and purification steps from the cheapest metal chloride, TiCl4 in the case of Ti-based metal oxides.[40]
We recently disclosed an innovative process based on the direct reaction a cellulosic biomass such as cotton, filter paper, or nanofibrillated cellulose with the simplest and cheapest metal oxide precursors.[17],[41-43] In such reactions, the biomass is not only considered as a template, but also as a reagent, from which O atoms are transferred to the metal precursors, in full agreement with the Green Chemistry principle of economy of atoms. The dehydration of the polysaccharides is the main chemical transformation occurring during the process and the resulting materials can then be converted into metal oxides by calcination or into their composites with carbon by pyrolysis. Our interest in applying this treatment to alginic acid (AA) results from the high performances of the mesoporous AA-derived carbon and titanate composites we recently introduced in the field of lithium ion batteries (LIB).[11],[44] It is well-known that titanium-based materials are among the best promising candidates as negative electrodes alternative to carbonaceous materials (e.g., graphite), owing to their good theoretical specific capacity, low cost, safety and environmental friendliness.[44],[45] [a] Dr. S. Kim, Dr. J. G. Alauzun, Dr. N. Louvain, Dr. N. Brun, Pr. L.
Stievano, Dr. P. M. Mutin, Dr. L. Monconduit,* B. Boury,* Institut Charles Gerhardt Montpellier, UMR 5253 Univ. Montpellier-CNRS-ENSCM, Montpellier, France
E-mail: laure.monconduit@umontpellier.fr, bruno.boury@umontpellier.fr
[b] Dr. M. De bruyn, Dr. Duncan J. Macquarrie
Green Chemistry Centre of Excellence, University of York, York, North Yorkshire, YO10, 5DD, UK
[c] Dr. N. Louvain, Pr. L. Stievano, Dr. L. Monconduit
Réseau sur le Stockage Electrochimique de l’Energie (RS2E), CNRS, FR3459, 33 Rue Saint Leu, 80039 Amiens Cedex, France Supporting information for this article is given via a link at the end of the document.
However, the practical application of these materials is greatly hampered by their poor electronic conductivity and slow lithium-ion kinetics, which further limit their rate capability, as in the case of anatase TiO2.[46] To improve the electronic conductivity, carbon coating[47],[48] or heteroatom doping have been proposed.[49],[50] Concerning lithium-ion kinetics, nano-structuring of TiO2 with controlled porosity could be a substantial solution as it can provide a larger contact area between electrode and electrolyte, resulting in an enhancement of lithium-ion diffusion inside the electrode.[51]
Accordingly, research has increasingly focused on the design of porous TiO2@C nanocomposites, where fast lithium ion diffusion in the mesopores and an enhanced conductivity ensured by the carbon matrix improve the electrochemical performance. This was obtained using various biopolymers as both templates and C-precursors via a hydrolytic sol-gel process.[17],[41]
In this work, the synthesis of TiO2@C nanocomposites by the direct mineralization of AA by TiCl4(g), a cheaper and solvent-free approach, is presented. This is expected to produce a chemical modification of the AA before pyrolysis, and consequently to a significantly different carbon from that obtained by direct pyrolysis of non-mineralized AA. Moreover, only few papers discuss about the advantages of lithium ion insertion into both TiO2 (2.5 to 1.0 V vs Li+/Li) (or even other metal oxides such as Li4Ti5O12: 2.5 to 1.2 V vs Li+/Li) and carbon (below 1.0 V vs Li+/Li) in such C-rich composites.[52-54] Therefore, our TiO2@C nanocomposites were investigated in a large range of potential (from 3 to 0 V) to take advantage of the reversible storage of lithium ions in both TiO2 and carbon, which could improve the electrochemical performance, such as higher capacity than TiO2 or carbon investigated separately.
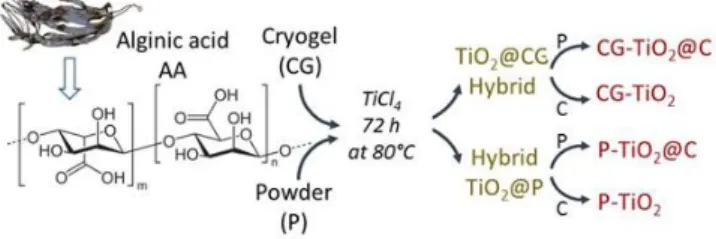
Here, the synthesis of mesoporous TiO2@C nanocomposites starts by a direct mineralization of seaweed derived-alginic acid cryogel (CG) by TiCl4 via solid/vapor reaction pathway (Fig. 1) giving hybrid composite so-called TiO2@CG, then transformed into mesoporous anatase TiO2 (CG-TiO2) by calcination or into a mesoporous TiO2@C nanocomposite (CG-TiO2@C) by pyrolysis. For comparison, we also performed the same experiment with a powder of alginic acid (P) leading to P-TiO2 or P-TiO2@C composite from the TiO2@P intermediate hydride. Very clear differences are evidenced, showing the advantages of the cryogel substrate and the formation of a mesoporous carbon-containing composite as electrode materials for LIB. We stress that the carbon part in the mesoporous TiO2@C composite could not only provide a rigid support for TiO2 by ensuring its stability during electrochemical cycling, but also create a conductive part, resulting in the improvement of its high rate capability. In addition, this carbon matrix can act as electrochemical active material vs lithium ion, leading to twice the capacity of porous TiO2 or alginic acid derived mesoporous carbon (A600) alone.
Results and Discussion
Synthesis and characterization of mesoporous TiO2@C,
TiO2 and A600 materials
The AA in this study is approximately 61% mannuronic acid and 39% guluronic acid with an average molecular weight of approximately 240 kDa.1, it was dissolved in water to prepare a mesoporous cryogel , with a specific surface area of 190 m2 g-1 and a pore volume of 1.24 cm3 g-1.[55] To maintain such a mesoporosity of the AA gel during freeze-drying, tert-butyl alcohol is added to form the water/tert-butyl alcohol eutectic (approximatively 67/33), otherwise, the mesoporous network collapses, yielding cryogel with a pore volume of only ca. 0.3 cm3 g-1. The TGA analysis of the CG evidenced the hydration of alginic acid at temperatures above 100 °C,[56] and no weight loss below such temperature. Such CG was then directly reacted with TiCl4 in an autoclave under autogenous pressure at 80°C. At this temperature, Titanium(IV) chloride (Bp.136.4°C at 101 103 Pa) has a vapor pressure close to 25 103 Pa in open vessel. Consequently, TiCl4 is only partly gaseous at the beginning of the reaction, a liquid/gas equilibrium is maintained through the reaction with the cryogel.
Fig. 1. Schematic representation of the synthesis of TiO2@C and TiO2
samples.
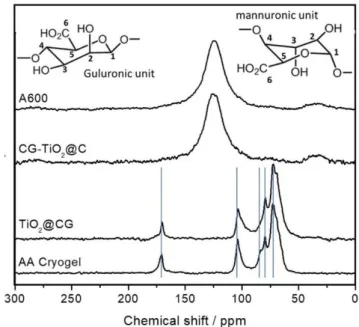
The modification of the AA is evidenced by 13C Solid State NMR spectroscopy only by a difference in the relative intensity of several signals like that of the carboxylic group G6+M6 at 170.1 ppm and the anomeric carbon G1+M1 at 104.2 ppm (G relates to the Guluronic units while M refers to the Mannuronic units).[57] The broadness of the signal doesn’t allow one to identify whether the mannuronic units are more or less impacted than the guluronic. Unlike cellulose,[42] the formation of aromatic compounds (e.g. furans or arenes) during the reductive dehydration of AA by TiCl4 vapor wasn’t evidenced. A possible reason is that for AA, dehydration can lead to ester or anhydride functions with chemical shifts close to the ones of carboxylic and alcohol functions.
Fig. 2. CPMAS 13C SS NMR images of a) CG, b) TiO2@CG, c) CG-TiO2@C
and d) A600.
The hybrid composites were then pyrolyzed or calcined at 600°C giving respectively TiO2@C composites or pure TiO2 (see Fig. 1). A sample of CG-derived carbon (A600) was also obtained by direct pyrolysis at 600°C of GC in order to highlight the possible effect of the TiCl4 on AA and its consequences on the formation of the carbonaceous residue in CG-TiO2@C.
TGA analyses in air of the material before thermal treatment of TiO2@CG and TiO2@P lead to a weigh loss of 65,8% at 1000°C, the weight loss of CG in the same conditions being of 99.1%. Consequently, the mass of TiO2 in these material is around 34.8 %. On sample obtained after pyrolysis, a TGA in air of CG-TiO2@C (Fig. S1 and see Fig. S2 for the others) allows to evaluate the C-content to ~33.7 wt%, TiO2 being the major component ~67.3 wt%. The same analysis on P-TiO2@C gives: C-content 39.9 w% C and TiO2 60.1 wt%.
The elemental mapping obtained by EDX indicates a perfectly homogeneous distribution of Ti, O and C in GC-TiO2@C and no segregation at the nanometer level (Fig. S3) whereas the segregation in two phases (TiO2 and C) is clearly observed for P-TiO2@C (Fig. S4). The quantitative analysis of CG-TiO2@C, assuming 2 O atoms for each Ti atom, lead to an atomic C/O ratio ~23-24 in the carbonaceous part of the composite. This must be compared to that of A600: C/O atomic ratio is ~14.0 (Table 1). On one hand, this much lower C/O ratio suggests that A600 is hardly graphitized or should be largely amorphous at this temperature. On the other hand, the high C/O ratio in CG-TiO2@C agrees with the role of AA as O-donor.
Fig. 3. SEM images of a-b) A600, b) alginic acid (AA) cryogel, c-d)
CG-TiO2@C, e-f) CG-TiO2, g-h) P-TiO2@C and f) P-TiO2@C. Backscattered
electrons detector used for P-TiO2@C sample.
The morphology of CG-TiO2@C investigated by SEM is very similar to the one of A600 (Fig. 3a) and CG (Fig. 3c). The large particles observed at low magnification (~10-30 µm) appeared as a dense packing of disordered meso-to-macro worm-like sub-structure at higher magnification. This type of morphology is also the one of A600(Fig. 3a). It thus appears that the reaction between TiCl4 and alginic acid perfectly kept the initial CG morphology, which is then preserved upon pyrolysis. At the highest magnification (x 10000) (Fig. 3d), the porous structure is clearly visible. The morphology of CG-TiO2 is very similar to that of CG-TiO2@C (Fig. 3e) but the surface seems smoother at high magnification (Fig. 3f), a probable effect of the removal of organic matters by calcination. Since this material is now pure TiO2, the templating role of CG at the nanometer level is demonstrated. Comparatively, the morphology of P-TiO2@C is completely different: the segregation in two separated phases, TiO2 and carbon, is clearly observed (as specified by white arrows in Fig. 3g). In this case, the treatment of P by TiCl4 leads to a crust (~0.5 - 2 µm thick) of flattened TiO2 fibers a few microns long surrounding the surface of the AA grains (> 10 µm),
as similar to TiO2 obtained through the conventional non-hydrolytic sol-gel method.[58]
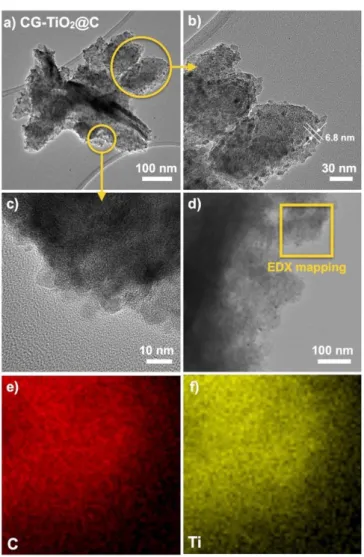
Fig. 4. a-c) TEM images, d) STEM image and e-f) EDX mapping of
CG-TiO2@C.
TEM (Fig. 4a-c) of CG-TiO2@C reveal the presence of TiO2 nanoparticles (6.8 ± 1.2 nm, counting 20 particles) closely assembled and embedded into a carbon matrix. No fibres, needles or flakes of TiO2 were observed. TEM-EDX mapping (Fig. 4d-f) reveals that both carbon and TiO2 particles are homogeneously dispersed with no segregation. In case of A600 (Fig. S5), TEM confirms that the mesoporosity arises from the entanglement of bundles of alginic acid chains (with the thickness of ~15 nm)[59] present in the cryogel and maintained during carbonization.
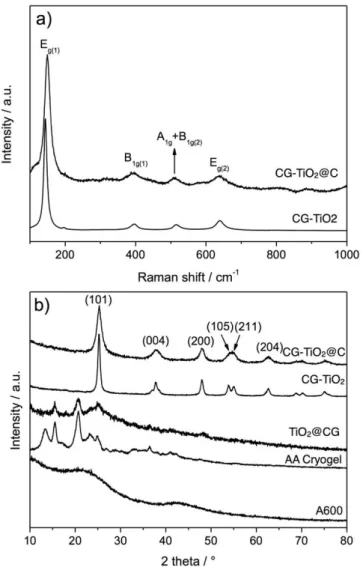
The Raman spectra of samples before thermal treatment do not present any signals clear and strong enough to be interpretable. This is significantly different from the one obtained with cellulose, as reported previously.[40] The same analyses performed on the pyrolyzed samples CG-TiO2@C and CG-TIO2 show an intense band at 148 cm-1 and weaker bands at 394, 512 and 639 cm-1 attributed to the characteristic modes of anatase TiO2 (Fig. 5a).[60] The peak shift, especially for Eg(1) mode of CG-TiO2@C
compared to CG-TiO2, might indicate formation of intimately mixed TiO2 and C species as observed in the case of TiO2/graphene oxide composites.[61] In the higher range of 1000 to 2000 cm-1 (Fig. S6), both in-plane vibration of disordered amorphous carbon band (D-band) at 1337 cm-1 and crystalline graphitic carbon band (G-band) at 1585 cm-1 are observed for CG-TiO2@C and A600 with the ID/IG ratios estimated to 0.9-1.0 in both cases. Based on the width of these bands and the low ID/IG, the carbon has a low degree of graphitization, even for A600, as a result of the low temperature of carbonization (600°C).
Before any thermal treatment, XRD analyses in Figure 5b show peaks at 2θ = 15.6, 20.6° indicating a partial preservation of crystalline AA. However, the broadening of these signals compared to the pristine AA cryogel and the absence of other peaks, notably the one at 2θ = 13.3°, suggest an important decrease of the crystallinity. In such TiO2@CG sample, very poorly crystallized anatase might be considered on the basis of the broad signals at 2θ = 25.3 and 48.1 corresponding to (101) and (200) reflections. For samples after thermal treatment, CG-TiO2@C or CG-TiO2, the diffraction peaks of anatase TiO2 (JCPDS Card no. 21-1272) are observed at 2θ = 25.3, 38.3, 48.1 54.1, 55.0 and 62.6°, corresponding to the (101), (004), (200), (105), (211) and (204) reflections, respectively. The size of TiO2 crystallites estimated by the Scherrer equation on the (101) peak is ≈6 nm and ≈15 nm for CG-TiO2@C and CG-TiO2, respectively. As frequently reported, the carbon in CG-TiO2@C effectively limits the growth of the TiO2 crystallites during calcination. For samples before or after thermal treatment, no characteristic peaks for carbon were observed either for CG-TiO2@C or TiO2@GC, demonstrating that carbon in these composites is largely amorphous. For comparison, broad signals of amorphous carbon are observed for A600 at around 22° and 42°.
Fig. 5. a) Raman spectra of CG-TiO2@C and CG-TiO2 (100 to 1000 cm -1
) b) X-ray powder diffraction patterns of CG-TiO2@C and CG-TiO2, TiO2@CG, AA
Cryogel and A600.
The textural properties evaluated by N2 physisorption measurements show that CG-TiO2@C and CG-TiO2 are essentially mesoporous, with a large pore size distribution in the range 2 - 50 nm (Fig. S7 and Table 1). The BET surface area and the total pore volume of CG-TiO2@C, CG-TiO2 were calculated to be 394 m2 g-1, 54 m2 g-1 and 0.47 cm3 g-1, 0.34 cm3 g-1, respectively. At the opposite, P-TiO2@C and P-TiO2, synthesized using P-AA, are clearly non-porous with negligible pore volumes (Fig. S7). Besides, a direct carbonization of the AA cryogel leads to the highly porous carbonaceous A600, with a pore volume of 1.04 cm3 g-1. The last line of the Table 1 are the values corresponding to a hypothetic mixture of 67 wt% of GC-TiO2 and 33 wt% of A600, the proportion of C and TiO2 found for the composite GC-TiO2@C. By comparison, CG-TiO2@C has a much higher specific surface area (+90%), but a lower mesoporosity. This might be the effect of the TiCl4 treatment, but also of the confinement of the alginic acid by TiO2.
Table 1. Textural properties of TiO2@C composite, TiO2 and A600
materials Sample SBET [a] PVtotal [b] PV<100 nm [c] PVmicro [d] C:O[e] CG-TiO2@C 394 0.47 0.45 0.14 23.6 CG-TiO2 54 0.34 0.33 < 0.01 - P-TiO2@C 214 0.09 0.09 0.08 - P-TiO2 13 0.05 0.05 < 0.01 - A600 514 1.12 1.06 0.22 14.0 (67% CG-TiO2 + 33% A600) 205 0.58 0.61 0.11 -
[a] Surface area determined by BET method (m2
g-1
). [b] Total pore volume at P/P0 = 0.99 (cm
3
g-1). [c] Pore volume less than 100 nm calculated by DFT method (cm3 g-1). [d] Micropore volume calculated by DFT method (cm3 g-1). [e] C:O atomic ratio obtained by SEM-EDX; For CG-TiO2@C,
C:O ratio was calculated by subtraction of oxygen of TiO2; For P-TiO2@C,
C:O ratio was not calculated as the distribution of carbon is not homogenous. (See Fig. 3 and Fig. S4 for SEM images).
The above data indicate a strong modification of AA upon treatment with TiCl4 at low temperature. Among different possible reactions, the most likely is the TiCl4 vapor diffusion inside the AA cryogel and its reactions with the hydroxyl and acidic functions leading to the formation of [Ti-O-C]-containing species and the concomitant release of HCl(g). Their reaction by Ti-Cl/C-O bond exchange may lead to the formation of TiO2 according to a Non-hydrolytic Sol-Gel reaction path.[57] The strongly acidic HCl vapour is also able to promote the intra- or intermolecular dehydration of AA with concomitant formation of esters, anhydrides and unsaturated functions. The water released in situ then can react with any [Ti-Cl]-containing species and progressively leads to TiO2. This corresponds well to the O-donor role of AA. Besides, the growth of TiO2 is perfectly templated by AA and leads to a controlled nano-composite. Finally, the modification of AA by TiCl4 ultimately leads, after pyrolysis, to a carbon with a different C:O ratio from that resulting from the direct pyrolysis of untreated AA. Anatase rutile phase transition is not observed here during the thermal treatment. The exact transition temperature strongly depending on the particle size or the synthesis method.[62] In our case, no rutile phase was observed by XRD, probably because of the nanosize of the TiO2 anatase particles (6.8 nm), which become significantly resistant against phase transition.[63] In addition, the pyrolysis generates carbonaceous char which part of them deposit on the TiO2 particles and inhibit their crystal growth and crystallization.
Electrochemical investigation as lithium ion batteries electrode
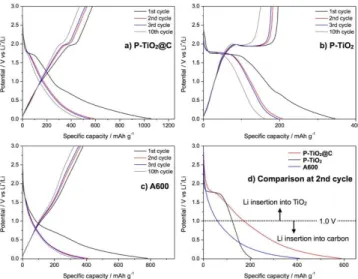
The lithium ion storage properties of CG-TiO2@C, CG-TiO2 and A600 were evaluated by galvanostatic discharge-charge measurement at different current densities. To facilitate the comparison of the different materials, their capacities were calculated based on the total mass of electrode material, not on that of TiO2 only.
As shown in Fig 6b, CG-TiO2 shows the typical charge/discharge galvanostatic profile of anatase TiO2 with three difference potential regions; i) a rapid drop to 1.8 V representing the formation of a solid solution of LiεTiO2, ii) a plateau around 1.8 V
ascribed to the two-phase reaction between tetragonal LiTiO2 and orthorhombic lithium titanate Li0.5±δTiO2, and finally iii) another two-phase reaction until 1.0 V leading to rock-salt tetragonal LiTiO2.[51] The shape of the plateau at 1.8 V is strongly dependent on the particle size of TiO2: a smaller particle size corresponds to a shorter plateau. Conversely, the extent of the sloping region from 1.8 V to 1.0 V, attributed to reversible surface lithium storage, is directly proportional to the specific surface area and the porosity, and large surface areas can largely increase the overall capacity.[51] The first discharge capacity of 345 mAh g-1 rapidly drops to 205 mAh g-1 at the second cycle. The corresponding large irreversible capacity can be explained by the formation of a passivation layer, a so-called solid–electrolyte interphase (SEI) during the first cycle. The capacity of CG-TiO2 further drops to 100 mA g-1 after 10 cycles, with a capacity retention of only 78 % compared to its initial capacity (161 mA g-1).
In case of CG-TiO2@C (Fig. 6a), the characteristic plateau of anatase is much shorter than that of CG-TiO2, due to low TiO2 content in the composite, and a long tail-like slope is observed below 1.0 V. The first and the second discharge capacity are 1056 and 589 mAh g-1, respectively. Indeed, this tail-like galvanostatic profile below 1.0 V is characteristic of lithium insertion in hard carbon, as confirmed by electrochemical signature of A600.
For A600 (Fig. 6c), the first and the second discharge capacity are 789 and 405 mAh g-1, respectively. The initial coulombic efficiency is 56 %, 59 % and 51 % for CG-TiO2@C, CG-TiO2 and A600. The low coulombic efficiency of CG-TiO2@C compared to CG-TiO2 could be due to the carbon matrix in the composite, in analogy with that of A600 (Table S1).
Fig. 6. Galvanostatic discharge-charge profile for a) CG-TiO2@C, b) CG-TiO2,
c) A600 and d) comparison of the 2nd discharge at 100 mA g-1.
Fig. 6d compares the second discharge of the different electrodes. As the reversible insertion-disinsertion of lithium in TiO2 mostly occurs between 1.0 and 3.0 V, whereas lithium insertion in hard carbon is reported below ca. 1.0 V (here, below ca. 1.5 V for A600), the discharge capacity of CG-TiO2@C can
be roughly decomposed into two contributions. Evidently, the increase in capacity for CG-TiO2@C arises from the region below 1.0 V, attributed to the carbon contribution. Interestingly, the second discharge capacity of CG-TiO2@C (589 mAh g-1) is obviously higher than the simple sum (272 mAh g-1) of the expected contributions of CG-TiO2 (205 mAh g-1 × 66 % = 135 mAh g-1) and A600 (405 mAh g-1 × 66 % = 137 mAh g-1). Moreover, the specific capacity of TiO2 (calculated from the weight of TiO2) corresponding to the plateau at 1.8 V for both CG-TiO2 (58 mAh g-1 of TiO2) and CG-TiO2@C (50 mAh g-1 of TiO2) is very similar. Based on these results, the difference in capacity must thus arise from the difference in the carbon contribution, which might be connected to the different nature of the two carbon matrices, as explained in the previous section (carbon in CG-TiO2@C has higher oxygen content than A600, cf. Table 1), which might interfere with lithium insertion into the carbon matrix.
Fig 7a compares the rate capability of CG-TiO2@C, CG-TiO2 and A600 at various current densities from 0.1 A g-1 to 1.2 A g-1. The most remarkable point is that the capacity of CG-TiO2@C is higher than any other samples at all current densities, for example, giving 329 mAh g-1 vs 252 mAh g-1 for CG-TiO2@C vs A600, respectively. More importantly, CG-TiO2@C recovers 94 % (444 mAh g-1) of its pristine capacity when the current density is set back to 0.1 A g-1, then becomes almost stable for 30 subsequent cycles, with a coulombic efficiency exceeding 99.0 %.
Fig. 7. Rate capability and b) long-term cyclability of different TiO2@C, TiO2
and A600 electrodes.
In addition, the importance of porosity and homogenous dispersion of TiO2 in CG-TiO2@C or CG-TiO2 can be elucidated by comparing them with non-porous P-TiO2@C or P-TiO2 (Fig. 6a). For example, P-TiO2@C delivers 4 times less capacity than CG-TiO2@C at 0.1 A g-1, and this value is even lower than that of CG-TiO2. Finally, the long-term cycling stability at high current density (0.4 A g-1) for CG-TiO2@C, CG-TiO2 and A600 is reported Fig. 7f. After 100 cycles, CG-TiO2@C retains 73 % of its initial capacity with a coulombic efficiency of more than 99.7 %, remarkably better than CG-TiO2 or A600, which show retentions of 52 % and 65 %, respectively. This result suggests that the carbon matrix of CG-TiO2@C stabilises TiO2 particles, and confirms that the properties of carbon matrix of CG-TiO2@C are different from those of A600. These results hint that this carbon matrix of CG-TiO2@C can effectively improve the electronic conductivity of the composite. To evaluate the influence of the carbon matrix on the electronic conductivity of the composite, CG-TiO2@C and CG-TiO2 electrodes without carbon black additive (CB) were also tested. Interestingly, CG-TiO2@C without CB electrode delivered 453 mAh g-1 as 2nd discharge capacity, even higher than that of A600 with CB, whereas a capacity of only 25 mAh g-1 was recorded for CG-TiO2 without CB (Fig. S8).
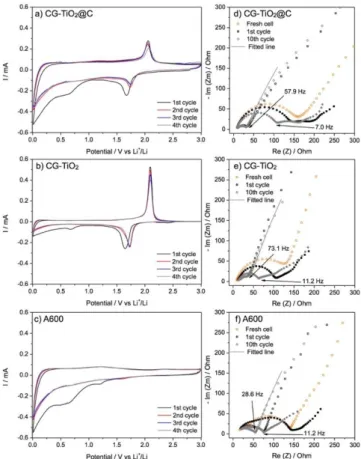
Fig. 8. CV curves at a scan rate of 0.1 mV s-1 for a) CG-TiO2@C, b) CG-TiO2,
c) A600 and d-f) their Nyquist plots; filled and open symbols refer to the end of discharge (0.01V) and the end of charge (3.0V), respectively.
To better understand the improved electrochemical performance of CG-TiO2@C compared to CG-TiO2 and A600, cyclic voltammetry (CV) was performed at a scan rate of 0.1 mV s-1 within the 0.01 - 3.0 V (vs Li+/Li) voltage range. As shown in Fig. 8b, GC-TiO2 presents a typical CV curve of anatase with a cathodic/anodic peak pair around 1.7/2.0 V, corresponding to the insertion/disinsertion of lithium in TiO2. No additional peaks are observed below 1.0 V, confirming that the lithium storage process mainly arises from the contribution of TiO2. A small cathodic peak at 0.7 V, recorded only during the first cycle, is attributed to the decomposition of electrolyte on the surface of the electrode. In case of mesoporous carbonaceous material A600 (Fig. 8c), the two cathodic peaks at 1.4 V and 0.7 V during the first cycle are probably due to irreversible reactions such as the reaction of lithium with oxygenated surface groups in A600 (1.4 V) and the decomposition of electrolyte (0.7 V), resulting in the formation of the SEI.[59] These two peaks are not observed during the following cycles, leaving only a peak at 0.1 V associated with the reversible insertion of lithium in amorphous carbon. From the second cycle onwards, CV curves are almost identical, confirming that the structure of A600 and the SEI formed at its surface are stable, without any significant degradation during cycling.
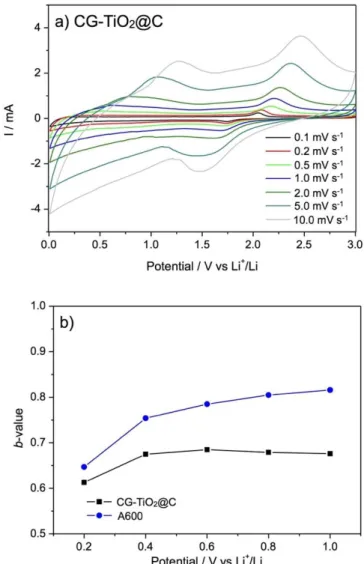
As it could be considered as a hybrid material of CG-TiO2 and A600, CG-TiO2@C exhibits a complex CV profile, which can be separated into two contributions: one typical of TiO2 and one resembling that of A600. The cathodic/anodic peaks pair of the TiO2 contribution is obviously less intense than that of CG-TiO2, due to the small content of TiO2 (76 wt%) in the composite. Only one irreversible peak, less pronounced than in A600, is observed at 0.7 V during the first cycle. In addition, the peak at 1.4 V, previously attributed to the possible reaction of lithium with oxygenated groups at the surface of carbon, is not visible. These differences in the CV profiles of CG-TiO2@C and A600, confirm the different properties of the carbon in the two samples. This difference positively impacts the electrochemical performance of CG-TiO2@C, increasing its specific capacity. To understand the performance in CG-TiO2@C, compared to A600, cyclic voltammetry at different scan rates (0.1 mV to 10 mV s-1) was performed (Fig. 9) Briefly, for lithium storage in carbonaceous material, the total capacity can be divided into a faradaic contribution (e.g., formation of the SEI and lithium intercalation) and a non-faradaic one (e.g., capacitive charge). In order to estimate the extent of these two contributions, the cyclic voltammetry curves at different scan rates from 0 to 1.0 V were analyzed following equation (1):[64]
i = avb (1)
where i is the current, v the scan rate and a, b are adjustable parameters which can be determined empirically by plotting log i vs log ν. For a non-faradaic capacitive charge mechanism, b approaches 1.0, whereas this parameter is close to 0.5 for a mostly faradic mechanism.[65],[66] For CG-TiO2@C, b takes values between 0.65 and 0.7, indicating a dominant faradaic contribution. For A600, on the contrary, b increases from 0.65 to 0.82 suggesting a more capacitive charge mechanism. In summary, the carbon matrix of CG-TiO2@C show typical ‘carbon-like’ insertion properties (with C:O ratio of 23.7), whereas the non-negligible oxygenated functional groups (C:O ratio of 14.0) in A600 might favour a non-faradaic capacitive charge process.
Given the interesting results CG-TiO2@C, electrochemical impedance spectroscopy (EIS) analysis was carried at different depths-of-discharge during cycling, and the corresponding Nyquist plots are presented in Fig. 8d-f. At the end of the first discharge (0.01 V, insertion of lithium), CG-TiO2 shows a depressed single semicircle at high frequency region, which can be associated, as usual, with the charge transfer process (Rct) and the solid electrolyte interphase (RSEI).
Fig. 9. a) CV curves of CG-TiO2@C electrode at various scan rates (2nd cycle), from 0.1 mV s-1 to 10.0 mV s-1, b) Calculated b-values for CG-TiO2@C
and A600 electrodes as a function of the cathodic (lithium insertion) sweep. On the contrary, the Nyquist plot of CG-TiO2@C exhibits an additional depressed semicircular arc at medium frequency, which should be related to semi-infinite diffusion-like processes as often observed in hard carbon materials.[67] However, the appearance of this semicircular is very different from that of A600, suggesting again that the carbon matrix in CG-TiO2@C is not the same as A600. The Nyquist plots recorded at the end of the charge (3.0 V, disinsertion of lithium) both TiO2 and CG-TiO2@C show a similar feature with a single semicircle at high frequency region, and the semicircle of CG-TiO2@C is slightly smaller than that of CG-TiO2 (Rct of 24.1 Ohm vs 32.8 Ohm). At this state, as all lithium ions are removed from the electrode, no signature of resistance related to lithiated carbon is observed for CG-TiO2@C. Therefore, it can be deduced that the carbon content in CG-TiO2@C may now effectively improve the electronic conductivity, thus ensuring a faster interfacial charge transfer. In addition, CG-TiO2@C shows smaller Warburg diffusion impedance, σ (See Table S2 and Fig. S9 for fitting results), compared to CG-TiO2 and A600, which could imply that
carbon matrix of CG-TiO2 enhances the lithium ion diffusion process. Indeed, the presence of carbon could increase the number of electron-conducting pathways,[68] especially when the carbon is homogenously dispersed as a composite with active material (CG-TiO2@C). Notably, the resistivity of CG-TiO2@C at charged state is almost identical with cycling, giving the same semicircle feature, indicating the excellent stability of the electrode.
Conclusions
This work presents a new concept in the use of alginic acid for the elaboration of metal oxides and metal oxide/carbon composites, with positive influence on the performance of these materials as anodes in LiBs. Indeed, beside the classical use of this biopolymer as template of metal oxide, it is also used here for the first time as a reagent and as a source of O and C atoms. The present methodology of preparation of mesoporous TiO2@C nanocomposites, based on the reactivity of alginic acid towards metal chloride, is among the greenest possible way in terms of economy of atoms, solvent, energy and equipment. Above all, it leads to high performance materials that, although not optimized, show a great potential for energy applications. Thanks to the synergy between the aerogel structure, the effect of the metal chloride treatment and the pyrolysis step, mesoporous TiO2@C nanocomposite shows a high capacity due to the electrochemical active role of the carbon matrix and an improved capacity retention even at high rates (up to 1.2 A g-1).
This concept can be probably generalised to other polysaccharide aerogels and/or other metal oxides making it a new broad scope and Green approach for the elaboration of materials for energy storage and catalysis.
Experimental Section
Chemicals. Alginic acid powder (AA-P) from brown algae was purchased
from Sigma-Aldrich (France). Titanium(IV) chloride (TC, TiCl4, >99.9%)
and tert-butyl alcohol (TBA, C4H10O, >99.5%) were purchased from
ACROS (France). Super P (>99%) was purchased from Alfa Aesar (France). All reagents were used without further purification.
Synthesis of mesoporous alginic acid cryogel. A mesoporous cryogel
of alginic acid was prepared as reported previously.[55] Briefly, an alginic acid solution (4.8 wt% in water) was gelled by heating at 90 °C for 2.5 h, and then kept at 4 °C for 24 h for retrogradation of alginic acid. Afterwards, tert-butyl alcohol (TBA) was added to the alginic acid gel, to obtain the eutectic composition of water and TBA (weight ratio of 7:3). The mixture was stirred for 1 h at RT then kept at 4 °C for 24 h. Removal of solvent by freeze drying was performed - 85 °C under 50 mbar, giving the mesoporous cryogel of alginic acid GC.
Synthesis of mesoporous TiO2, TiO2@C composite, and A600 materials. In a glove box, an alginic acid cryogel (0.352 g, 2.0 mmol) and
a pure titanium(IV) chloride (1.138 g, 6.0 mmol) were introduced in the Teflon liner of a steel autoclave, and then kept in an oven at 80 °C for 3 days under autogenous pressure. After cooling and eventually washing with ethanol (3 × 20 mL), the obtained mesoporous TiO2@CG was
further dried at 80 °C for 12 h under vacuum. Mesoporous TiO2
(CG-TiO2) was obtained by calcination of TiO2@CG at 600 °C in air (1 °C min -1, 5 h at 600 °C). Mesoporous TiO
2@C (CG-TiO2@C) was obtained by
pyrolysis of TiO2@CG at 600 °C in argon flow inside a tubular furnace
(1 °C min-1, 5 h at 600 °C, 150 mL min-1 of argon flow). For the synthesis
of non-porous TiO2 (P-TiO2) or TiO2@C (P-TiO2@C), alginic acid powder
(P) was introduced in the autoclave and treated in the same conditions than CG and the resulting hybrid TiO2@AAP was converted by pyrolysis
or calcination in same condition. Besides, a mesoporous carbonaceous material derived from alginic acid (A600) was prepared by the direct carbonization of the alginic acid cryogel at 600 °C under argon flow in a tubular furnace (1 °C min-1, 5 h at 600 °C, 150 mL min-1 of argon flow).
Characterization. Powder X-ray diffraction (XRD) patterns were
measured using a PANalytical X'Pert Pro MPD diffractometer, equipped with Cu Kα radiation (1.5418 Å), in the 10 - 80° 2θ range with steps of 0.033°. N2 physisorption experiments were carried out at -196 °C on a
Micromeritics 3Flex. The samples were outgassed at 120 °C for 10 h at 10-3 mbar before the analysis. Scanning electron microscopy (SEM) images were obtained on a Hitachi S-4800 electron microscope. Energy-dispersive X-ray spectroscopy (EDX) analyses were acquired with a JEOL CENTURIO detector. Transmission electron microscopy (TEM) and Scanning Transmission electron microscopy (STEM) images were acquired using JEOL FX2200 microscope. 13C CPMAS NMR spectra
were recorded on a VARIAN VNMRS 300 MHz spectrometer using a 3.2 mm T 3 2 channels probe. Rotors were spun at 12 kHz. Energy-dispersive X-ray spectroscopy (EDX) analyses were acquired with a JEOL CENTURIO detector. Raman spectra were measured on a Horiba Jobin-Yvon LabRAM ARAMIS microspectrometer with the excitation wavelength was 633 nm. TG analyses were performed using Netzsch Simultaneous Thermal Analyser STA 409 PC Luxx system. Galvanostatic electrochemical characterizations were performed at RT on a BTS3000 instrument (Neware Battery). Electrochemical impedance spectroscopy (EIS) studies were done on a VSP-300 (BioLogic), from 100 kHz to 10 mHz, with a 10 mV amplitude in the potentiostatic mode. Cyclic voltammetry (CV) measurements were carried out on a VSP-300 (BioLogic) with scan rate of 0.1 mV s-1. The electrodes are composed of the active material, a conductive carbon additive (Super P), and polyvinylidene fluoride (PVDF, Solef 5130) in the mass ratio of 80:14:6. After stirring in N-methyl-2-pyrrolidone (NMP, Sigma-Aldrich), the electrode slurry was mixed in an agate grinding jar (1 h at 500 rpm), then tape casted uniformly at 150 mm onto a copper current collector (0.018 mm, 99.96%, Prometor) using a 3540 bird film applicator (Elcometer). Electrodes were cut out from the film (diameter of 12.7 mm) and dried under vacuum at 80 °C for 15 h. The tap density of the electrodes was ca. 1.8 mg cm-2. CR2032 coin-type cells were assembled in a glove box (Braun) under Ar atmosphere (O2 < 0.5 ppm, H2O < 0.5 ppm), using
lithium metal as both reference and counter electrode. The electrolyte was LP30 (1M LiPF6 in ethylene carbonate (EC) and dimethyl carbonate
(DMC) (v/v = 1:1)). Whatman glass fibre disks were used as separators. Electrochemical galvanostatic cycling was performed in the voltage window 3.00 - 0.01 V vs Li+/Li at several different current densities.
Author Contribution
SK synthesized all electrode materials and carried out electrochemical testing and analysis. MDb synthesized the cryogel of alginic acid with advice from DJM. JGA, NL, NB, LS, PHM supervised data analysis. SK and BB wrote the manuscript with advice from LS and LM. LM and BB oversaw the study. All authors discussed the results and commented on the manuscript.
Acknowledgements
Financial support was received from the European Commission in the framework of POROUS4APP project (H2020 GA no. 666157). The authors would like to thank Didier Cot, Bertrand Rebiere (IEM, France) for SEM analysis, and Erwan Oliviero (Université de Montpellier, France) for TEM analysis. Lea Daenens (ICGM, France) is gratefully acknowledged for technical help in the collection of the Raman spectra.
Keywords: Cyrogel, alginic acid, TiO2, mesoporous, lithium ion battery
[1] M. Armand and J. M. Tarascon, Nature, 2008, 451, 652–657.
[2] V. Etacheri, R. Marom, R. Elazari, G. Salitra and D. Aurbach, Energy
Environ. Sci., 2011, 4, 3243–20.
[3] B. Boury and S. Plumejeau, Green Chem., 2015, 17, 72–88.
[4] J. Jiang, Y. Li, J. Liu, X. Huang, C. Yuan and X. W. D. Lou, Adv. Mater.,
2012, 24, 5166–5180.
[5] A. Henry, P. Hesemann, J. G. Alauzun and B. Boury, Carbohydr. Polym,
2017, 174, 697–705.
[6] X. Cao, C. Tan, M. Sindoro and H. Zhang, Chem. Soc. Rev., 2017, 46, 2660–2677.
[7] R. Wu, X. Qian, K. Zhou, J. Wei, J. Lou and P. M. Ajayan, ACS Nano,
2014, 8, 6297–6303.
[8] X. Han, Z. Zhao, Y. Xu, D. Liu, H. Zhang and C. Zhao, RSC Adv., 2014, 4, 41968–41975.
[9] Q. Li, X. Miao, C. Wang and L. Yin, J. Mater. Chem. A, 2015, 3, 21328– 21336.
[10] X. Li, H. Hu, S. Huang, G. Yu, L. Gao, H. Liu and Y. Yu, Electrochim.
Acta, 2013, 112, 356–363.
11] S. Kim, J. G. Alauzun, N. Louvain, N. Brun, L. Stievano, B. Boury, L. Monconduit and P. H. Mutin, RSC Adv., 2018, 8, 32558–32564. [12] E. Zhao, C. Qin, H.-R. Jung, G. Berdichevsky, A. Nese, S. Marder and
G. Yushin, ACS Nano, 2016, 10, 3977–3984.
[13] A. S. Aricò, P. Bruce, B. Scrosati and J. M. Tarascon, Nat. Mater., 2005, 4, 366-377.
[14] P. G. Bruce, B. Scrosati and J.-M. Tarascon, Angew. Chem. Int. Ed.,
2008, 47, 2930–2946.
[15] S. Spirk, Polysaccharides as Battery Components, Springer International Publishing, Cham, 2018.
[16] S. Kim, M. De Bruyn, J. G. Alauzun, N. Louvain, N. Brun, D. J. Macquarrie, L. Stievano, B. Boury, L. Monconduit and P. H. Mutin, J.
Mater. Chem. A, 2018, 6, 14392–14399.
[17] A. Henry, S. Plumejeau, L. Heux, N. Louvain, L. Monconduit, L. Stievano and B. Boury, ACS Appl. Mater. Interfaces, 2015, 7, 14584– 14592.
[18] A. Henry, N. Louvain, O. Fontaine, L. Stievano, L. Monconduit and B. Boury, ChemSusChem, 2016, 9, 264–273.
[19] T. Meng, R. Zeng, Z. Sun, F. Yi, D. Shu, K. Li, S. Li, F. Zhang, H. Cheng and C. He, J. Electrochem. Soc., 2018, 165, A1046–A1053. [20] W. Li, L. Li, X. Wu, J. Li, L. Jiang, H. Yang, G. Ke, G. Cao, B. Deng and
W. Xu, ACS Appl. Mater. Interfaces, 2018, 10, 21056–21060. [21] M. Kemell, V. Pore, M. Ritala and M. Leskelä, Chem. Vap. Deposition,
2006, 12, 419–422.
[22] Z. Li, C. Yao, Y.-C. Wang, S. Mikael, S. Gunasekaran, Z. Ma, Z. Cai and X. Wang, J. Mater. Chem. A, 2016, 4, 11672–11679.
[23] M. Kettunen, R. J. Silvennoinen, N. Houbenov, A. Nykänen, J. Ruokolainen, J. Sainio, V. Pore, M. Kemell, M. Ankerfors, T. Lindström, M. Ritala, R. H. A. Ras and O. Ikkala, Adv. Funct. Mater., 2010, 21, 510–517.
[24] H. Ghanem, M. Kormann, H. Gerhard and N. Popovska, J. Eur. Ceram.
Soc., 2007, 27, 3433–3438.
[25] M. L. Foresti, A. Vázquez and B. Boury, Carbohydr. Polym., 2017, 157, 447–467.
[26] S. Li and J. Huang, Adv. Mater., 2015, 28, 1143–1158. [27] H. Tian and J. He, Langmuir, 2016, 32, 12269–12282. [28] E. Hermann, Extreme Biomimetics, Springer, 2017
[29] A. A. Makarova, E. V. Grachova, V. S. Neudachina, L. V. Yashina, A. Blüher, S. L. Molodtsov, M. Mertig, H. Ehrlich, V. K. Adamchuk, C. Laubschat, D. V. Vyalikh, Sci. Rep., 2015, 5, 8710.
[30] H. Ehrlich, P. Simon, M. Motylenko, M. Wysokowski, V. V. Bazhenov, R. Galli, A. L. Stelling, D. Stawski, M. Ilan, H. Stöcker, B. Abendroth, R. Born, T. Jesionowski, K. J. Kurzydłowskii, D. C. Meyer, J. Mater. Chem.
B, 2013,1, 5092-5099.
[31] M. Wysokowski, I. Petrenko, A. L. Stelling, D. Stawski, T. l Jesionowski, H. Ehrlich, Polymers, 2015, 7, 235-265.
[32] I. Stepniak, M. Galinski, K. Nowacki, M. Wysokowski, P. Jakubowska, V. V. Bazhenov, T. Leisegang, H. Ehrlich, T. Jesionowski, RSC Adv., 2016, 6, 4007-4013.
[33] T. Szatkowski, K. Kopczyński, M. Motylenko, H. Borrmann, B. Mania, M. Graś, G. Lota, V. V. Bazhenov, D. Rafaja, F. Roth, J. Weise, E. Langer, M. Wysokowski, S. Żółtowska-Aksamitowska, I. Petrenko, S. L. Molodtsov, J. Hubálková, C. G. Aneziris, Y. Joseph, A. L. Stelling, H. Ehrlich, T. Jesionowski, Nano Res., 2018, 11, 4199.
[34] T. Szatkowski, K. Siwińska-Stefańska, M. Wysokowski, A. L. Stelling, Y. Joseph, H. Ehrlich, T. Jesionowski, Biomimetics, 2017, 2, 4.
[35] S. Li, J. Huang, J. Mater. Chem. A, 2015, 3, 4354-4360. [36] Y. Luo, J. Li, J. Huang, Langmuir, 2016, 32, 12338-12343.
[37] M. Wang, S. Li, Y. Zhang, J. Huang, Chem. Eur. J. 2015, 21, 16195-16202.
[38] S. Behar, P. Gonzalez, P. Agulhon, F. Quignard, D. Swierczynski, Catal. Today, 2012, 189, 35-41.
[39] E. Wan, A. Travert, F. Quignard, D. Tichit, N. Tanchoux, H. Petitjean, Hugo, ChemCatChem, 2017, 9, 2358-2365
[40] A. M. Escamilla-Pérez, N. Louvain, M. Kaschowitz, S. Freunberger, O. Fontaine, B. Boury, N. Brun and P. H. Mutin, J. Sol-Gel Sci. Technol.,
2017, 79, 270–278.
[41] A. Henry, N. Louvain, O. Fontaine, L. Stievano, L. Monconduit and B. Boury, ChemSusChem, 2016, 9, 264–273.
[42] S. Plumejeau, M. Rivallin, S. Brosillon, A. Ayral, L. Heux and B. Boury,
Chem. Eur. J., 2016, 22, 17262–17268.
[43] S. Plumejeau, M. Rivallin, S. Brosillon, A. Ayral and B. Boury, Eur. J.
Inorg. Chem., 2016, 1200–1205.
[44] S. Kim, A. M. Escamilla-Pérez, M. De Bruyn, J. G. Alauzun, N. Louvain, N. Brun, D. J. Macquarrie, L. Stievano, B. Boury, L. Monconduit and P. H. Mutin, J. Mater. Chem. A, 2017, 5, 24380-24387.
[45] A. R. Armstrong, G. Armstrong, J. Canales, R. García and P. G. Bruce,
Adv. Mater., 2005, 17, 862–865.
[46] G. Sudant, E. Baudrin, D. Larcher and J.-M. Tarascon, J. Mater. Chem.,
2005, 15, 1–7.
[47] A. M. Escamilla-Pérez, N. Louvain, B. Boury, N. Brun and P. H. Mutin,
Chem. Eur. J., 2018, 24, 4982–4990.
[48] H. Liu, W. Li, D. Shen, D. Zhao and G. Wang, J. Am. Chem. Soc., 2015, 137, 13161–13166.
[49] M. Fehse, S. Cavaliere, P. E. Lippens, I. Savych, A. Iadecola, L. Monconduit, D. J. Jones, J. Rozière, F. Fischer, C. Tessier and L. Stievano, J. Phys. Chem. C, 2013, 117, 13827–13835.
[50] H.-G. Jung, C. S. Yoon, J. Prakash and Y.-K. Sun, J. Phys. Chem. C,
2009, 113, 21258–21263.
[51] J.-Y. Shin, D. Samuelis and J. Maier, Adv. Funct. Mater., 2011, 21, 3464–3472.
[52] M. Zou, Z. Ma, Q. Wang, Y. Yang, S. Wu, L. Yang, S. Hu, W. Xu, P. Han, R. Zou and A. Cao, J. Mater. Chem. A, 2016, 4, 7398–7405. [53] L. Sun, W. Liu, Y. Cui, Y. Zhang, H. Wang, S. Liu, B. Shan, Green
[54] L. Zheng, X. Wang, Y. Xia, S. Xia, E. Metwalli, B. Qiu, Q. Ji, S. Yin, S. Xie, K. Fang, S. Liang, M. Wang, X. Zuo, Y. Xiao, Z. Liu, J. Zhu, P. Müller-Buschbaum and Y.-J. Cheng, ACS Appl. Mater. Interfaces, 2018, 10, 2591–2602.
[55] A. Borisova, M. De Bruyn, V. L. Budarin, P. S. Shuttleworth, J. R. Dodson, M. L. Segatto and J. H. Clark, Macromol. Rapid Commun.,
2015, 36, 774–779.
[56] J. P. Soares, J. E. Santos, G. O. Chierice and E. T. G. Cavalheiro, , 2004, 29, 53-56.
[57] C.M. DeRamos, A.E. Irwin, J.L. Nauss and B.E. Stout, Inorg. Chim.
Acta., 1997, 256, 69-75.
[58] P. H. Mutin and A. Vioux, Chem. Mater., 2009, 21, 582–596.
[59] S. Kim, M. De Bruyn, J. G. Alauzun, N. Louvain, N. Brun, D. J. Macquarrie, L. Stievano, B. Boury, P. H. Mutin and L. Monconduit, J.
Power Sources, 2018, 406, 18–25.
[60] W. F. Zhang, Y. L. He, M. S. Zhang, Z. Yin and Q. Chen, J. Phys. D:
Appl. Phys., 2000, 33, 912–916.
[61] D. Chen, L. Zou, S. Li and F. Zheng, Sci. Rep., 2018, 1–8.
[62] A. W. Czanderna, C. N. Ramachandra Rao, J. M. Honig, Trans.
Faraday Soc., 1958, 54, 1069-1073
[63] S. Patra, C, Davoisne, H. Bouyanfif, D. Foix, F. Sauvage, Sci. Rep.,
2015, 5, 10928.
[64] Y. Wang, Y. Song and Y. Xia, Chem. Soc. Rev., 2016, 45, 5925–5950. [65] T. Brezesinski, J. Wang, S. H. Tolbert and B. Dunn, Nat. Mater., 2010,
9, 146–151.
[66] A.J. Bard, L.R. Faulkner, Electrochemical Methods: Fundamentals and Applications, second ed., John Wiley & Sons, 2000.
[67] R. Väli, A. Jänes and E. Lust, J. Electrochem. Soc., 2017, 164, E3429– E3437.
[68] J. H. Jeong, M.-S. Kim, Y. J. Choi, G.-W. Lee, B. H. Park, S.-W. Lee, K. C. Roh and K.-B. Kim, J. Mater. Chem. A, 2018, 6, 6033–6044.
FULL PAPER
Simple and
eco-friendly method for a direct conversion of seaweed into mesoporous TiO2@C was developed with application for lithium ion battery.
Sanghoon Kim, Mario De bruyn, Johan G. Alauzun, Nicolas Louvain, Nicolas Brun, Duncan J. Macquarrie, Lorenzo Stievano, P. Hubert Mutin, Laure Monconduit,* and Bruno Boury* Page No. – Page No.
Dehydration of alginic acid cryogel by TiCl4 vapor: a direct access to
mesoporous TiO2@C
nanocomposites and their
performance in lithium ion batteries