HAL Id: hal-02154680
https://hal.archives-ouvertes.fr/hal-02154680
Submitted on 1 Apr 2021
HAL is a multi-disciplinary open access
archive for the deposit and dissemination of
sci-entific research documents, whether they are
pub-lished or not. The documents may come from
teaching and research institutions in France or
abroad, or from public or private research centers.
L’archive ouverte pluridisciplinaire HAL, est
destinée au dépôt et à la diffusion de documents
scientifiques de niveau recherche, publiés ou non,
émanant des établissements d’enseignement et de
recherche français ou étrangers, des laboratoires
publics ou privés.
Distributed under a Creative Commons Attribution| 4.0 International License
Milk polar lipids reduce lipid cardiovascular risk factors
in overweight postmenopausal women: towards a gut
sphingomyelin-cholesterol interplay
Cécile Vors, Laurie Joumard-Cubizolles, Manon Lecomte, Emmanuel Combe,
Lemlih Ouchchane, Jocelyne Drai, Ketsia Raynal, Florent Joffre, Laure
Meiller, Mélanie Le Barz, et al.
To cite this version:
Cécile Vors, Laurie Joumard-Cubizolles, Manon Lecomte, Emmanuel Combe, Lemlih Ouchchane, et
al.. Milk polar lipids reduce lipid cardiovascular risk factors in overweight postmenopausal women:
towards a gut sphingomyelin-cholesterol interplay. Gut, BMJ Publishing Group, 2020, 69 (3),
pp.487-501. �10.1136/gutjnl-2018-318155�. �hal-02154680�
487 Vors C, et al. Gut 2020;69:487–501. doi:10.1136/gutjnl-2018-318155
Original research
Milk polar lipids reduce lipid cardiovascular risk
factors in overweight postmenopausal women:
towards a gut sphingomyelin- cholesterol interplay
cécile Vors,
1,2laurie Joumard- cubizolles,
3Manon lecomte,
1emmanuel combe,
1lemlih Ouchchane,
4,5Jocelyne Drai,
1,6Ketsia raynal,
7Florent Joffre,
8laure Meiller,
1,2Mélanie le Barz,
1Patrice gaborit,
7aurélie caille,
9Monique sothier,
2carla Domingues- Faria,
3adeline Blot,
9aurélie Wauquier,
10emilie Blond,
1,6Valérie sauvinet,
1,2geneviève gésan- guiziou,
11Jean- Pierre Bodin,
12Philippe Moulin,
1,13David cheillan,
1,14hubert Vidal,
1Béatrice Morio,
1eddy cotte,
15,16Françoise Morel- laporte,
9Martine laville,
1,2annick Bernalier- Donadille,
10stéphanie lambert- Porcheron,
2,17corinne Malpuech- Brugère,
3Marie- caroline Michalski
1,2To cite: Vors c, Joumard- cubizolles l, lecomte M, et al. Gut 2020;69:487–501. ► additional material is published online only. To view, please visit the journal online (http:// dx. doi. org/ 10. 1136/ gutjnl- 2018- 318155). For numbered affiliations see end of article.
Correspondence to Dr Marie- caroline Michalski, inra, UMr1397, carMen laboratory, inserM U1060, Univ lyon, cens- eli Building, 165 chemin du grand revoyet, 69310 Pierre- Bénite, France; marie- caroline. michalski@ inra. fr Mle, emc and lO contributed equally.
cV and lJc contributed equally to the ValOBaB- c clinical trial. received 21 December 2018 revised 29 april 2019 accepted 30 april 2019 Published Online First 12 June 2019
© author(s) (or their employer(s)) 2020. re- use permitted under cc BY- nc. no commercial re- use. see rights and permissions. Published by BMJ.
AbsTrACT
Objective To investigate whether milk polar
lipids (Pl) impact human intestinal lipid absorption, metabolism, microbiota and associated markers of cardiometabolic health.
Design a double- blind, randomised controlled
4- week study involving 58 postmenopausal women was used to assess the chronic effects of milk Pl consumption (0, 3 or 5 g- Pl/day) on lipid metabolism and gut microbiota. The acute effects of milk Pl on intestinal absorption and metabolism of cholesterol were assessed in a randomised controlled crossover study using tracers in ileostomy patients.
results Over 4 weeks, milk Pl significantly reduced
fasting and postprandial plasma concentrations of cholesterol and surrogate lipid markers of
cardiovascular disease risk, including total/high- density lipoprotein- cholesterol and apolipoprotein (apo) B/apoa1 ratios. The highest Pl dose preferentially induced a decreased number of intestine- derived chylomicron particles. also, milk Pl increased faecal loss of coprostanol, a gut- derived metabolite of cholesterol, but major bacterial populations and faecal short- chain fatty acids were not affected by milk Pl, regardless of the dose. acute ingestion of milk Pl by ileostomy patients shows that milk Pl decreased cholesterol absorption and increased cholesterol- ileal efflux, which can be explained by the observed co- excretion with milk sphingomyelin in the gut.
Conclusion The present data demonstrate for the
first time in humans that milk Pl can improve the cardiometabolic health by decreasing several lipid cardiovascular markers, notably through a reduced intestinal cholesterol absorption involving specific interactions in the gut, without disturbing the major bacterial phyla of gut microbiota.
Trial registration number ncT02099032 and
ncT02146339; results.
INTrODuCTION
Dietary synthetic emulsifiers were reported to alter drastically gut microbiota, thereby promoting both systemic and gut inflammation and metabolic syndrome in rodents.1 2 Dietary polar lipids (PL) are widely used as natural emulsifiers and texture- promoters in food formulation and represent 1%–10% of daily lipid intake (about 2–8 g/day),3 mainly provided by soybean lecithin (90% of world PL market). However, dietary lecithin recently raised concerns of sustainable development. On the other hand, milk and dairy products are consumed by >6 billion people worldwide4 and represent another natural source of emulsifiers. Indeed, milk
significance of this study
What is already known on this subject?
► Dietary synthetic emulsifiers alter drastically
gut microbiota and promote inflammation and metabolic syndrome in rodent models.
► Polar lipids are natural emulsifiers widely
used in food formulation, mainly from vegetal sources.
► Milk fat globules naturally contain polar lipids
rich in sphingomyelin, which was shown in preclinical studies to reduce intestinal cholesterol absorption and improve lipid metabolism because of the natural affinity of sphingomyelin to form complexes with cholesterol.
► Available clinical studies on dietary
supplementation with milk polar lipids were rather inconclusive regarding their beneficial impact on human lipid metabolism, whereas egg polar lipids or fat devoid of polar lipids were reported to increase lipid markers of cardiovascular risk in these studies.
on April 1, 2021 by guest. Protected by copyright.
http://gut.bmj.com/
488 Vors c, et al. Gut 2020;69:487–501. doi:10.1136/gutjnl-2018-318155
significance of this study
What are the new findings?
► Four- week supplementation with milk polar lipids decreases
significantly several fasting and postprandial lipid markers of cardiometabolic risk in overweight postmenopausal women at risk of cardiovascular disease (CVD).
► Mechanisms of action of milk polar lipids in humans are
related to their metabolic fate and impact in the gut, by reducing intestine- derived chylomicrons, intestinal cholesterol absorption via co- excretion with the unabsorbed sphingomyelin fraction, and by increasing cholesterol- to- coprostanol conversion by the gut microbiota.
► Milk polar lipid consumption alters neither the major
bacterial phyla of gut microbiota nor the profile of short- chain fatty acids.
How might it impact on clinical practice in the foreseeable future?
► Considering their lowering effect on lipid cardiovascular
markers in overweight adults at risk for developing metabolic syndrome, milk polar lipids should be part of new dietary strategies for primary and secondary prevention of CVDs.
► The complementary mechanistic study in ileostomy patients
suggests the enhancement by milk polar lipids of the transintestinal cholesterol excretion, known as the new target of clinical strategies to improve the cardiometabolic profile.
► Present findings demonstrate the need to further
investigate the impact of milk polar lipids on inflammatory cardiovascular risk markers and also their potential effect on coprostanoligenic bacteria and their potential role in restoring gut microbiota eubiosis in disease.
fat globules comprise a core of triacylglycerols (TAG) surrounded by a specific biological membrane called the milk fat globule membrane (MFGM) that is rich in PL and cholesterol.5 MFGM extracts have gained much interest as a potential nutraceutical, notably for their natural PL composition6 with a large propor-tion of sphingomyelin (SM) (>25% of milk PL)7 compared with other animal sourced PL with <5% of SM or to vegetal PL devoid of SM.3 With longer and more saturated fatty acids than egg or soy PL, milk PL have also been shown to be more efficacious in reducing intestinal absorption of cholesterol in both preclinical and in vitro models.8 9 Up to date, several rodent studies have shown that milk PL impact postprandial lipid metabolism, lower intestinal absorption and hepatic accumulation of cholesterol and increase faecal excretion of cholesterol,10–12 leading to speculate that dietary supplementation with milk PL might be of thera-peutic value in humans. However, strong evidence in humans is still lacking since most of the available clinical studies have been performed in healthy subjects with increased energy intake due to PL supplementation and were rather inconclusive regarding the beneficial impact on lipid metabolism.13–16 Considering the intestinal microbial conversion of cholesterol to coprostanol and increasing evidence that the gut microbiota is influenced by dietary factors and may impact host lipid metabolism,17–19 a putative effect of milk PL on human gut microbiome may exist but was so far not investigated. A clinical study shows recently that the efficiency of cholesterol conversion would be related to microbial density, as a coprostanol/cholesterol ratio >15 was associated with high level of coprostanoligenic bacteria (108 cells/g) in postmenopausal
women.20 However, no human intervention has yet thoroughly explored the dynamic postprandial response of blood lipid cardio-vascular risk factors to milk PL intervention or even their dose- response as part of benefits/risk assessment to foresee their wider use as a natural ingredient or dietary supplement. Furthermore, women are at higher risk of developing cardiovascular disease (CVD) as age advances and the loss of oestrogen during meno-pause leads to an alteration of the blood lipid profile with an increase of total and low- density lipoprotein (LDL)- cholesterol (LDL- C) levels.21 22 Metabolic syndrome of which dyslipidaemia is a core component is also more prevalent among postmenopausal women than among premenopausal women.23 Menopause is thus a major risk factor for CVD that is the leading cause of morbidity and mortality in postmenopausal women.24
In this context, we set up two first- in- human randomised controlled trials: the first was a 4- week dietary intervention based on daily consumption of PL- enriched cheeses in postmenopausal women at risk for CVD and the second was a proof- of- principle investigation of acute consumption of PL- enriched cheeses in ileostomy patients. To fit with everyday life diet and ensure prac-tical consistency of such clinical results, we used a common type of dairy product, namely cream cheese, enriched with a milk PL- rich fraction derived from buttermilk. The original strategy here was to formulate cheeses with identical total lipid content with partial substitution of TAG by milk PL to avoid increased energy intake. A unique dose- response design up to 5 g/day was made possible by incorporating a buttermilk concentrate from a PL concentration process specifically designed for the present clinical investigations.25 The objective of the intervention trial was to determine: 1) whether dietary milk PL consumption (0, 3 or 5 g- PL/day) was able to impact differentially fasting and postprandial lipid metabolism, including intestine- derived chylomicrons and 2) the extent to which these potential milk PL effects were concomitant with changes in gut microbiota and gut- derived metabolites (coprostanol, short- chain fatty acids (SCFA)). The aim of the complementary study in ileostomy patients was to investigate intestinal mechanisms underpinning the impact of milk PL on cholesterol absorption and metabolism using 2H- cholesterol and 13C- TAG tracers.
MeTHODs
Two clinical studies were performed involving multiple meta-bolic explorations and analyses; see more details in online supplementary materials and methods.
Clinical studies
The dietary intervention trial (VALOBAB- C study) was a multi-centre double- blind randomised trial with a parallel group design in overweight postmenopausal women. The acute milk PL consumption study (VALOBAB- D study) was a multi-centre double- blind randomised trial with a crossover design in ileostomy subjects. All participants provided prior informed written consent. Trials were approved by the ethics committee and legal authorities (see online supplementary materials and methods), registered on www. clinicaltrials. gov (NCT02099032, NCT02146339) and conducted at the Human Nutrition Research Centres of Rhône- Alpes (CRNH- RA; Lyon) and of Auvergne (CRNH- A; Clermont- Ferrand, France) according to French law.
study designs
VALOBAB-C trial
After a 1- week run- in period (100 g control cheese/day), the volunteers were randomly assigned to three different groups
on April 1, 2021 by guest. Protected by copyright.
http://gut.bmj.com/
489 Vors c, et al. Gut 2020;69:487–501. doi:10.1136/gutjnl-2018-318155
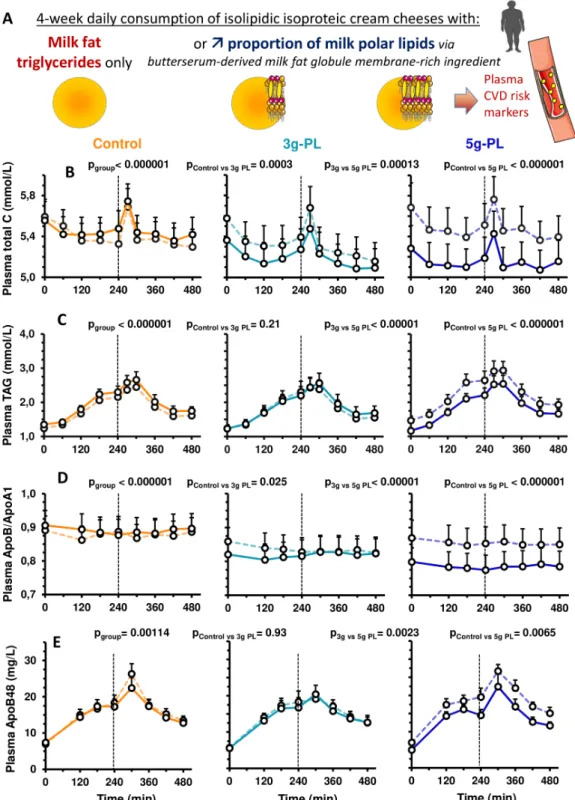
Figure 1 Impact of 4- week intervention with up to 5 g milk PL in cream cheese on postprandial concentrations of lipid CV risk markers (VALOBAB- C
trial). Panel explanation (A) and kinetics of serum total C (B), serum TAG (C), plasma ApoB/ApoA1 ratio (D) and plasma ApoB48 (E) before (V1, dotted line) and after (V2, full line) the daily consumption of 100 g of cheese with or without PL during 4 weeks. Data are represented as mean±SEM. The pgroup and pposthoc are shown for the 8- hour postprandial period (linear mixed model followed by post hoc analyses on ΔV2−V1); ptimexgroup was not
significant. Group size: control n=18, 3 g- PL n=18, 5 g- PL n=20. See also online supplementary figure S1 for study design. Apo, apolipoprotein; C, cholesterol; CVD, cardiovascular disease; CV, cardiovascular; PL, polar lipids; TAG, triacylglycerols.
for a 4- week intervention period (figure 1A, online supple-mentary figure S1A) with either cream cheese devoid of PL (control group) or enriched with PL (3 g- PL group or 5 g- PL group) (100 g/day; composition: online supplementary table S1). This increased dietary intake of PL (0.5- fold to 2- fold; SM: 2- fold to 6- fold) versus reported average daily intake in Western countries.3 Cream cheeses were packaged under partial
vacuum of −0.4 bar in order to enhance product stability. The PL content of the cream cheeses was measured beyond the 5- month shelf life: PL content=3.05±0.11 g/100 g in 3 g- PL cheeses and PL content=5.02±0.22 g/100 g in 5 g- PL cheeses. The potential appearance of PL degradation products (ie, lyso- phospholipids due to potential phospholipase activity) in PL- en-riched cheeses was also evaluated after shelf life, and values of
on April 1, 2021 by guest. Protected by copyright.
http://gut.bmj.com/
490 Vors c, et al. Gut 2020;69:487–501. doi:10.1136/gutjnl-2018-318155 lyso- phosphatidylcholine (a major lipolytic product) were found
to be below the analytical detection limit (<1.3 mg/100 g cheese), confirming no major lipolysis in the cream cheese products.
We stratified the group allocation on centre and randomised. Two visits of metabolic explorations (fasting and postprandial) were performed at the beginning (V1) and at the end (V2) of each dietary intervention (meal composition: online supplemen-tary table S2). The primary outcome was the effect over 4 weeks of the daily consumption of milk PL (one control group and two increasing doses) on fasting serum concentration of total choles-terol (C), defined as the difference between V1 and V2. The 4- week period of intervention has been chosen in line with the previous trials reporting the health effects of milk PL or butter-milk14 15 26 and to study adequately the potential changes in gut microbiota composition, which is mostly investigated in dietary interventions >3 weeks.27 28
Hypotheses, sample size and power calculations (based on fasting cholesterol) are presented in online supplementary mate-rials and methods. Regarding 8- hour longitudinal serum concen-tration of total C, we estimated actual power for a total sample size of 58 individuals to be >0.999 based on the actual mean concentrations and common SD of 0.42 mM. All data were analysed.
VALOBAB-D trial
Volunteers performed three distinct days of metabolic testing separated by a washout period (online supplementary figure S2A). During each visit, a different breakfast was served including one of the three test cheeses (100 g/meal) according to randomised sequences, and stable isotope tracers (13C- triolein, 2H- cholesterol; online supplementary table S2). The primary
hypothesis was that milk PL in the meal would increase ileal efflux of SM (primary outcome). The secondary hypothesis was that this would be associated with both increased ileal efflux and decreased absorption of cholesterol (see predefined exploratory hypotheses and sample size calculation in online supplementary materials and methods). Sample size was estimated after reported ileostomy SM concentrations of six subjects,29 assuming unfa-vourable situation of a parallel group design and the highest variability and expecting crossover design to decrease outcomes’ variability thereby enhancing power analysis.
study participants
In the VALOBAB- C trial, 58 eligible volunteers were included: 19 in the control group, 19 in the 3 g- PL group and 20 in the 5 g- PL group. They followed the entire trial and their data were analysed (online supplementary figure S1B). In the VALOBAB- D trial, candidates’ prescreening by digestive surgeons and gastro-enterologists of local university hospitals allowed to contact 40 individuals. Only four volunteers could ultimately be recruited (recruitment difficulties of this population; non- extendable inclusion period considering PL- ingredient shelf life). Volunteers performed the entire protocol, were followed- up and had their data analysed (online supplementary figure S2B). Online supple-mentary materials and methods indicate more details (screening, inclusion/non- inclusion criteria).
Nutritional composition of cream cheese
Three full- fat cream cheeses (0, 3 and 5 g- PL) were formulated with identical macronutrient proportions, substituting TAG by milk PL in enriched products (see online supplementary table S1) without modifying the amount of total lipids, proteins and carbohydrates. The milk SM content was 0.8 wt% in 3 g- PL
cheese and 1.3 wt% in 5 g- PL cheese. The cholesterol content was higher in milk PL- enriched cheeses because SM is naturally associated with cholesterol within lipid rafts in the MFGM.30 Conversely, the TAG content was higher in the control cheese compared with 3 g- PL and 5 g- PL cheeses due to TAG substitu-tion in enriched cheeses. Because dietary PL (including butter-milk PL)5 contain naturally more monounsaturated fatty acids and polyunsaturated fatty acids (PUFA) and less saturated fatty acids (SFA), the partial TAG substitution by milk PL in cream cheese induced a relative increase of the PUFA amount in milk PL- enriched products associated with a relative decrease of SFA amount (online supplementary table S1).
Metabolic explorations and laboratory analyses
Details are provided in the online supplementary materials and methods about the metabolic explorations performed at each visit (online supplementary figures S1C and S2C) by the VALOBAB- C (before/after intervention) and the VALOBAB- D volunteers; the VALOBAB- C analysis of (i) circulating clinical parameters (total C, LDL- C, high- density lipoprotein (HDL)- cholesterol (HDL- C), TAG and glucose concentrations in serum, apolipoprotein (Apo)B and ApoA1 in plasma, serum insulin, plasma ApoB48 and PCSK9; area under the curve (AUC) calcu-lation), (ii) intestine- derived chylomicron- rich fractions (CMRF) (lipids, hydrodynamic diameter), (iii) stools (faecal lipids, popu-lation levels of the main phylogenetic groups and bacterial species of gut microbiota, SCFA in faecal water) and the VALOBAB- D analysis of (i) ileal efflux of SM and cholesterol, (ii) amount and isotopic enrichment of oleic acid in plasma, of CO2 in expired air and of free cholesterol in plasma and CMRF, (iii) exogenous lipid oxidation calculation.
statistical analyses
In the VALOBAB- C trial, we described continuous variables as mean±SEM (for distribution deviating from normality, median and IQR). The difference between visits (V2−V1) was used as response variable. Our study design planned to measure each parameter longitudinally at each visit (1–10 time points). Apart from single time point parameters that were analysed through general linear model and subsequent post hoc tests following Tukey's test, we performed mixed linear modelling to account for within- subject repeated measures, seeking for main effects, that is, at least ‘group’ effect, time effect and interaction. Post hoc analyses were performed following Tukey- Kramer test to both detail main effects and control for familywise type I error. In case of residual distribution departing from normality, analyses were performed on ranks. In addition, we performed all these analyses considering global ‘milk PL’ effect as binary factor, that is, lumping together 3 g- PL and 5 g- PL doses in one group versus control. Analyses were performed on SAS V.9.4 (SAS Institute, Cary, North Carolina, USA) with a type I error set at 0.05. Online supplementary table S3 summarises the number of sampled units for each analysis.
In the VALOBAB- D trial, data are presented as means±SEM and were analysed with GraphPad Prism 7 software. For normally distributed data, repeated measures one- way analysis of variance (ANOVA) (according to meal) or two- way ANOVA (according to meal and time) were performed followed by Tukey’s post hoc test. For non- normal data, a Friedman test was performed followed by Dunn’s post hoc test. For each parameter, a Mann- Whitney U test was performed to compare control meal with PL meals lumped together. Nominal two- sided p values are reported.
on April 1, 2021 by guest. Protected by copyright.
http://gut.bmj.com/
491 Vors c, et al. Gut 2020;69:487–501. doi:10.1136/gutjnl-2018-318155
Table 1 Anthropometric and fasting metabolic characteristics of the VALOBAB- C study population at screening
Control 3 g- PL 5 g- PL Healthy range/value (n=19) (n=19) (n=20) Age (years) 58±2 60±2 58±1 – Body weight (kg) 78.5±2.5 75.3±1.9 75.6±1.1 – BMI (kg/m²) 30.5±0.8 29.3±0.6 29.3±0.5 20–25* Waist circumference (cm) 96.5±2.4 97.0±1.5 97.9±1.4 ≤80† Hip circumference (cm) 110.4±1.7 106.9±1.8 106.5±1.7 –
Waist/hip circumference ratio 0.87±0.02 0.91±0.01 0.92±0.01 ≤0.85*
Systolic BP (mm Hg) 132.1±2.9 129.2±3.1 133.7±2.6 <130† Diastolic BP (mm Hg) 79.8±1.6 82.0±1.4 80.5±1.8 <85† Total C (mmol/L) 6.0±0.2 5.7±0.2 5.8±0.2 <5.2‡ LDL- C (mmol/L) 3.9±0.2 3.7±0.2 3.8±0.2 ≤3.3‡ HDL- C (mmol/L) 1.3±0.0 1.4±0.0 1.3±0.0 >1.3† TAG (mmol/L) 1.6±0.1 1.4±0.2 1.4±0.1 <1.7† Glucose (mmol/L) 4.9±0.1 4.9±0.1 4.7±0.1 <5.6† CRP (mg/L) 5.3±1.0 5.3±1.1 3.7±0.6 <1–3§ AST (IU/L) 21.9±1.0 25.2±2.1 24.2±1.7 <34¶ ALT (IU/L) 27.5±2.4 29.2±3.1 30.6±3.1 <55¶
Data are presented as mean±SEM. Subjects were randomised therefore no statistical analysis was performed on subject characteristics at screening. *According to WHO.66
†Based on the International Diabetes Federation metabolic syndrome worldwide definition.67
‡According to the National Cholesterol Education Program Adult Treatment Panel III.68
§Recommendations of the American Heart Association and Centers for Disease Control and Prevention established levels of cardiovascular risk by assigning CRP values as follows: low risk: <1.0 mg/L; average risk: 1.0–3.0 mg/L; high risk: >3.0 mg/L.31
¶According to reference ranges provided by the hospital laboratory in charge of the measurement of transaminases.
ALT, alanine amino transferase; AST, alanine aspartate transferase; BP, blood pressure; BMI, body mass index; C, cholesterol; CRP, C reactive protein; HDL, high- density lipoprotein; LDL, low- density lipoprotein; PL, polar lipids, TAG, triacylglycerol.
resuLTs
subjects’ characteristics
In the VALOBAB- C study, volunteers were overweight post-menopausal women of comparable mean age, without fasting hypertriglyceridemia nor diabetes but at risk for CVD with abdominal obesity, borderline high value of fasting LDL- C and borderline low value of fasting HDL- C (table 1). Volunteers had also a low- grade inflammation with a mean C reactive protein level >3 mg/L, which is considered high risk.31 Participants of the VALOBAB- D study were non- obese and normolipaemic ileostomy patients (online supplementary table S4). This specific population was chosen to collect the residual unabsorbed lipids at the end of the small intestine (ileum), before they reach the colon.
Compliance and dietary intake in the VALObAb-C study
The mean compliance to dietary intervention was high (>98%) and similar between groups (p>0.3). Dietary records excluding the study- cream cheese showed that volunteers of the three groups did not differentially modify their energy and macronu-trient intakes, nor fibres, alcohol, cholesterol and fatty acid (FA) intakes between V1 and V2 (online supplementary table S5).
Milk PL decrease fasting blood lipids and associated cardiometabolic risk markers
We compared the effects of the 4- week intervention between groups on the change (Δ) of values between visits V2 and V1 (ie, ΔV2−V1). Several fasting markers of cardiometabolic risk were significantly modified by the intervention (table 2). Fasting total C decreased significantly in the 5 g- PL group (pgroup<0.05, pposthoc<0.05 vs control; −0.40 mM, −6.8%; table 2). We also observed concomitant decrease in LDL- C in the 5 g- PL group (pposthoc<0.05 vs control; −0.34 mM, −8.7%) and increase in
HDL- C in 5 g- PL vs 3 g- PL group (pposthoc<0.05; +0.06 mM, ie, +5.0%). In the 5 g- PL group, these changes resulted in a decreased ratio total C/HDL- C (pposthoc<0.01 vs control and vs 3 g- PL), a better predictor of CVD than LDL- C.32 Total C/ HDL- C ratio in the 5 g- PL group decreased to 4.53, which is close to the target value of 4.4 indicated by the American Heart Association for women to lower CV risk from high to moderate. The 5 g- PL group showed significant decrease in fasting serum TAG versus control and versus 3 g- PL groups (pposthoc<0.05), plasma ApoB (contained in chylomicrons, VLDL and LDL) versus control (pposthoc<0.05) and plasma ApoB48 versus control and versus 3 g- PL (pposthoc<0.01) (table 2). In addition, ApoB/ ApoA1 (pposthoc<0.05 vs control; −0.07, –6.8%) and ApoB48/ ApoB ratios (pposthoc<0.05 vs control and vs 3 g- PL) were signifi-cantly reduced in the 5 g- PL group.
Regardless of dose, groups with PL decreased significantly fasting plasma PCSK9 compared with control (binary analysis, pPL=0.047; while pgroup=0.12). In each group with PL, change in total C was positively correlated with ΔApoB (r=0.83 and r=0.80, respectively; p<0.05). Moreover, in the 5 g- PL group only, positive correlations were observed: (i) Δtotal C with ΔTAG (r=0.61, p<0.05) and ΔApoB48 (r=0.50, p<0.05); (ii) ΔTAG with ΔLDL- C (r=0.58, p<0.05) and ΔApoB (r=0.45, p<0.05).
Milk PL lower postprandial lipid cardiovascular risk markers
Dietary intervention (figure 1A) effect was highly significant between groups on the postprandial kinetics of total C, TAG and ApoB/ApoA1 (figure 1B- D; pgroup≤0.001; remaining signif-icant after adjustment). The 4- week intervention with milk PL decreased postprandial cholesterol- related parameters: the higher the dose of milk PL, the greater the reduction in total C and ApoB/ApoA1 ratio (5 g- PL>3 g- PL>0 g- PL, figure 1B,D). Only the 5 g- PL group presented a decrease of postprandial TAG
on April 1, 2021 by guest. Protected by copyright.
http://gut.bmj.com/
492 Vors c, et al. Gut 2020;69:487–501. doi:10.1136/gutjnl-2018-318155
Table 2 Differences in the effects of 4- week intervention with milk PL in cream cheese on fasting circulating metabolic risk markers in the
VALOBAB- C trial
Control (n=19) 3 g- PL (n=19) 5 g- PL (n=20)
pgroup
V1 ΔV2−V1 V1 ΔV2−V1 V1 ΔV2−V1
Body weight (kg) 77.86±2.36 0.03±0.19 74.67±1.76 0.01±0.22 75.22±1.16 −0.33±0.25 0.43
Fat body mass (%) 43.85±1.03 0.03±0.37 43.43±0.78 0.30±0.55 42.48±0.79 −0.3±0.21 0.56
Lean body mass (%) 56.15±1.03 −0.03±0.37 56.57±0.78 −0.30±0.55 57.52±0.79 0.3±0.21 0.56
BMI (kg/m²) 30.22±0.76 0.01±0.07 29.05±0.58 −0.02±0.09 29.18±0.56 −0.12±0.1 0.53
Systolic BP (mm Hg) 124.32±2.74 −4.79±2.28 124.68±4.17 −1.63±2.00 124.47±3.94 −4.21±2.88 0.62
Diastolic BP (mm Hg) 71.68±2.28 0.84±1.69 76.21±2.07 −1.84±1.87 75.84±1.94 −2.89±1.24 0.25
Total C (mmol/L) 5.59±0.17 −0.04±0.1a 5.58±0.20 −0.21±0.10a,b 5.68±0.24 −0.4±0.09b 0.04
LDL- C (mmol/L) 3.70±0.15 −0.04±0.08a 3.54±0.17 −0.17±0.08a,b 3.63±0.19 −0.34±0.08b 0.04 HDL- C (mmol/L) 1.16±0.05 −0.02±0.03a,b 1.23±0.05 −0.04±0.03a 1.17±0.06 0.06±0.02b 0.03 Total C/HDL- C ratio 5.01±0.27 0.11±0.16a 4.67±0.26 −0.01±0.12a 5.16±0.36 −0.63±0.13b 0.0005† TAG (mmol/L) 1.24±0.08 0.11±0.06a 1.24±0.11 −0.01±0.09a 1.47±0.13 −0.30±0.10b 0.003† PCSK9 (ng/mL) 271.30±27.10 12.30±13.50 276.00±25.00 −28.30±17.30 259.20±18.40 −16.60±10.50 0.12 ApoA1 (g/L)‡ 1.16±0.02 −0.01±0.02 1.17±0.02 0.00±0.02 1.19±0.03 −0.01±0.02 0.86 ApoB (g/L)† 1.03±0.05 0.01±0.02a 1.01±0.05 −0.04±0.02a,b 1.02±0.06 −0.09±0.03b 0.03 ApoB48 (10−3 g/L)‡ 6.98±0.77 0.41±0.36a 5.70±0.53 −0.13±0.39a 7.01±0.62 −2.04±0.50b 0.0004† ApoB/ApoA1‡ 0.89±0.04 0.01±0.02a 0.86±0.04 −0.04±0.02a,b 0.87±0.05 −0.07±0.02b 0.02 ApoB48/ApoB‡ 6.75±0.48 0.38±0.45a 5.79±0.53 0.14±0.47a 7.48±0.70 −1.64±0.45b 0.005† Glucose (mmol/L) 5.23±0.10 −0.03±0.07 5.11±0.11 0.02±0.06 5.15±0.1 −0.11±0.06 0.37 Insulin (mIU/L) 7.29±0.99 0.43±0.72 7.11±0.72 −0.06±0.61 8.07±1.36 −0.41±0.90 0.74 HOMA- IR 1.74±0.26 0.17±0.18 1.67±0.19 −0.03±0.14 1.82±0.28 −0.10±0.18 0.52
P values presented in bold highlight significant intervention effect.
Data are presented as mean±SEM. pgroup represents p value associated with group effect as calculated by generalised linear model.
a bDifferent superscript letters indicate statistically different intervention effects between groups as calculated by post hoc analyses controlling for familywise type I error
(i.e., means sharing a common letter are not significantly different).
†P value remains significant (<0.05) after adjustment for clinical centre, quartiles of volunteer age and waist circumference; the other significant p values only describe a tendency after adjustment (p<0.1).
‡Control n=17, 3 g- PL n=17 and 5 g- PL n=18 due to missing values.
Apo, apolipoprotein; BMI, body mass index; BP, blood pressure; C, cholesterol; CRP, C reactive protein; HDL, high- density lipoprotein; HOMA- IR, homeostasic model assessment of insulin resistance; LDL, low- density lipoprotein; PCSK9: proprotein convertase subtilisin/kexin type 9; PL, polar lipids; TAG, triacylglycerol; V1, visit 1; V2, visit 2.
(−10.4%; pposthoc<0.01 vs control and vs 3 g- PL; figure 1C). Consistently, the metabolic effects of milk PL were significant on the postprandial cumulative response (AUC) and peaks of concentration (cmax) of several risk markers. Consumption of 5 g- PL reduced postprandial AUCs of total C by 5.7%, TAG of 10.4% and ApoB/ApoA1 ratio of 7.3% (all p<0.05, V2 vs V1). Compared with control, 5 g- PL induced significant reduc-tions in the change of postprandial AUCs of total C (−156±40 vs 22±46 mM. min), TAG (−170±77 vs 72±42 mM. min) and ApoB/ApoA1 ratio (−33±9 vs 6±9 mM. min) (all pgroup and pposthoc<0.05 for 0–480 min). The cmax of total C and TAG were also decreased after 5 g- PL vs control: −0.34±0.1 mM vs 0.04±0.1 mM for total C (p<0.05), –0.45±0.2 mM vs 0.27±0.1 mM for TAG (p<0.05).
Milk PL do not induce body weight/fat mass gain but increase total lipid β-oxidation
Indirect calorimetry analysis in one centre revealed a significant effect of intervention on postlunch total lipid β-oxidation (240– 480 min, pgroup=0.042; pposthoc<0.075 for each PL group versus
control: +1.03±1.18 g in 3 g- PL group and +1.02±0.99 g in 5 g- PL group vs −2.54±1.06 g in control). Regardless of dose, milk PL increased cumulated lipid β-oxidation after lunch (240–480 min; pPL=0.011) and over 8 hours (pPL=0.034) versus control. Changes in participants’ body weight (pgroup=0.43) and fat mass (pgroup=0.56) did not differ among groups (table 2).
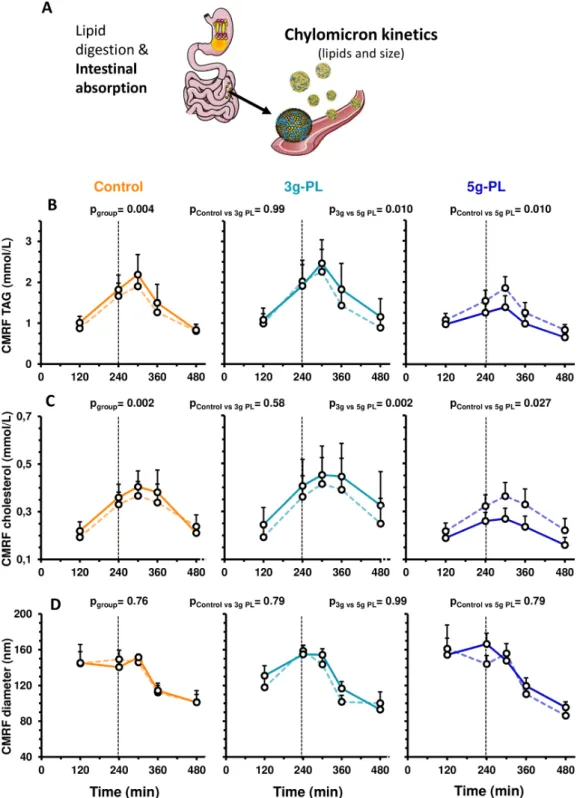
Milk PL favourably modulate intestine-derived chylomicrons
Regarding plasma concentrations of intestinal chylomicron lipids (figure 2A), both cholesterol (CMRF- C) and TAG (CMRF- TAG) of CMRF were decreased in plasma of the 5 g- PL group versus control and 3 g- PL groups (figure 2B,C, pgroup<0.01; remaining significant after adjustment). Postprandial concentrations of plasma ApoB48 were reduced only in the 5 g- PL group (figure 1E; pgroup≤0.001; pposthoc<0.01 vs control and vs 3 g- PL). CMRF particle size was unaffected by intervention (figure 2D).
Milk PL increase faecal coprostanol without altering major phylogenetic groups of gut microbiota
Variations of faecal losses of total lipids and cholesterol were not different among groups (figure 3A,B, pgroup=0.91 and 0.52, respectively). Variation of faecal concentrations of coprostanol tended to differ among groups (figure 3C, pgroup=0.07) and increased significantly after interventions with milk PL regard-less of dose versus control (pPL=0.03). Moreover, the faecal coprostanol/cholesterol ratio was significantly increased by milk PL (figure 3D; pPL=0.04). More specifically, around 65% of volunteers in both milk PL groups had a faecal coprostanol/ cholesterol ratio exceeding 15 after intervention (ratios from 23 to 28 and 20 to 114 in the 3 g- PL and 5 g- PL subsets, respec-tively; figure 3E). LDL- C and total cholesterol are negatively correlated with faecal coprostanol/cholesterol ratio after dietary intervention (all groups; figure 3F,G, r=−0.492, p=0.016 and r=−0.466, p=0.023, respectively), while no correlation was
on April 1, 2021 by guest. Protected by copyright.
http://gut.bmj.com/
493 Vors c, et al. Gut 2020;69:487–501. doi:10.1136/gutjnl-2018-318155
Figure 2 Modulation of postprandial chylomicron parameters after 4- week intervention with control, 3 g- PL or 5 g- PL cream cheese (VALOBAB- C
trial). Panel explanation (A) and plasma kinetics of CMRF TAG (B), CMRF C (C) and CMRF size (D) before (V1, dotted line) and after (V2, full line) the daily consumption of 100 g of cheese with or without PL during 4 weeks. Data are represented as mean±SEM. pgroup and pposthoc are shown for postprandial period from 120 to 480 min (linear mixed model followed by post hoc analyses on ΔV2−V1). ptimexgroup was not significant. (B, C): after adjustment on quartiles of volunteer age and waist circumference: pgroup<0.05. For technical reason, analyses performed in centre 1 only, sample size: control n=9, 3 g- PL n=9, 5 g- PL n=10. CMRF, chylomicron- rich fraction; PL, polar lipids; TAG, triacylglycerols.
observed before intervention. Such correlations are emphasised in the 5 g- PL group after intervention (figure 3H,I). The daily consumption of up to 5 g of milk PL during 4 weeks modulated neither the major phylogenetic groups and bacterial species of gut microbiota (figure 4) nor the measured faecal SCFA profile (figure 5).
Milk PL decrease intestinal cholesterol absorption and increase cholesterol-ileal efflux in ileostomy subjects
In ileostomy subjects (figure 6A), the incremental AUC (iAUC) over 8 hour of [13C]-oleic acid in plasma lipids
and the exogenous FA β-oxidation (13CO
2 breath test)
were similar between meals (online supplementary figure
on April 1, 2021 by guest. Protected by copyright.
http://gut.bmj.com/
494 Vors c, et al. Gut 2020;69:487–501. doi:10.1136/gutjnl-2018-318155
Figure 3 Impact of 4- week intervention with milk polar lipids (PL)- enriched cream cheese on faecal lipids in the VALOBAB- C trial. Faecal loss
variations (ΔV2−V1) of total lipids (A), cholesterol (B), coprostanol (C) and coprostanol/cholesterol ratio (D) after daily consumption of 100 g of cheese with or without PL during 4 weeks. Coprostanol/cholesterol ratio before (V1) and after (V2) the 4- week consumption of 100 g of cheese with or without PL (E). Spearman's correlation between faecal coprostanol/cholesterol ratio and serum low- density lipoprotein- cholesterol (LDL- C) (F) and total cholesterol (C) (G) after (V2) daily consumption of 100 g of cheese with or without PL during 4 weeks (orange: control group, light blue: 3 g- PL group, dark blue: 5 g- PL group). Spearman's correlation between faecal coprostanol/cholesterol ratio and serum total C (H) and LDL- C (I) at V2 in the 5 g- PL group. Data are indicated as median with IQR. The pgroup is shown to compare intervention effect between the three groups (analysis on ranks on ΔV2−V1); PPL is shown to compare intervention effect between the control group and both PL groups regardless of dose. For technical reasons, analyses performed in centre 1 only, sample size: (A) n=9 (control) to 10 (PL); (B–C) n=4 (control) to 7 (PL); (D–I) n=7 (control) to 9 (PL). NB: regardless of group and visit, the observed faecal losses of cholesterol (range 0.2–1 mg/g faeces) and coprostanol (range 0.45–5.2 mg/g faeces) were consistent with previous published data (cholesterol: 1.88±0.53 to 5.8±1.56 mg/g dry faeces47; coprostanol: 3–27.4 mg/g lyophilised faeces,48 considering that dry matter is ~25% of total faeces weight).
S3A–F). However, the iAUC of plasma [2H]-cholesterol
was significantly lowered by the 5 g- PL versus control meal (pmeal<0.05, figure 6B). Regardless of PL dose, a significantly
lower iAUC of [2H]-cholesterol was observed after PL meals
in both plasma (pPL=0.047) and chylomicrons (pPL=0.004) (figure 6B,C). Furthermore, each PL meal resulted in higher
on April 1, 2021 by guest. Protected by copyright.
http://gut.bmj.com/
495 Vors c, et al. Gut 2020;69:487–501. doi:10.1136/gutjnl-2018-318155
Figure 4 Major phylogenetic groups and bacterial species of gut microbiota after 4- week intervention with up to 5 g milk polar lipids (PL) in cream
cheese in the VALOBAB- C trial. Variations (log- fold change V2/V1) of the abundance of the main bacterial groups and species that were measured as log 16S rDNA gene copies per g of faeces: (A) total bacteria, (B) Firmicutes, (C) Bacteroides- Prevotella group, (D) Akkermancia muciniphila, (E) Bifidobacterium spp, (F) Lactobacillus- Leuconostoc- Pediococcus group, (G) Clostridium coccoides group, (H) Clostridium leptum group, (I)
Faecalibacterium prausnitzii, (J) Roseburia- Eubacterium rectale group, (K) Veillonella spp, (L) Enterobacteriaceae family, (M) Escherichia coli and (N) Bilophila wadworthia. Data are indicated as median with IQR; pgroup is shown. Group size: control n=18, 3 g- PL n=18, 5 g- PL n=20.
on April 1, 2021 by guest. Protected by copyright.
http://gut.bmj.com/
496 Vors c, et al. Gut 2020;69:487–501. doi:10.1136/gutjnl-2018-318155
Figure 5 Faecal profile of short- chain fatty acids before (V1) and after (V2) 4- week intervention with up to 5 g/day milk polar lipids (PL) in
cream cheese in the VALOBAB- C trial. (A) Acetate, propionate and butyrate, (B) isobutyrate, formate, succinate and lactate. Data are represented as mean±SEM, pgroup are shown. NB: regarding the total amount of major short- chain fatty acids in (A), acetate+propionate+butyrate: pgroup=0.35. For technical reasons, analyses performed in centre 2 only, sample size: control n=8, 3 g- PL n=7, 5 g- PL n=8.
ileal efflux of total cholesterol versus control during the first 4 hour (pmeal=0.04, pposthoc<0.05, figure 6D; pPL<0.05). Milk PL in the meal increased SM losses in ileal effluent versus control (pmeal=0.03, pPL<0.05 vs control, figure 6E). SM efflux corresponded to 20%–25% of ingested amount over 8 hour, and was composed of typical milk- SM molec-ular species,7 that is, mostly isoforms with acyl chains over C20 (online supplementary figure S3G).
DIsCussION
Present results first demonstrate that 4- week dietary interven-tion based on cream cheese naturally enriched with 3 or 5 g/day
of milk PL, as part of a balanced diet, markedly lower an array of lipid markers of CVD risk in postmenopausal women. Particu-larly, we reveal in humans that 5 g/day milk PL achieves a reduc-tion of 8.7% of LDL- C (−0.34 mM) with an addireduc-tional reducreduc-tion of 15.6% of serum TAG. This is a clinically meaningful change considering that a LDL- C reduction of 1 mM is associated with a 19% lower risk of coronary mortality in clinical trial33 and even −52% CV risk in case of early intervention.34 Clinical interest has recently focused on emerging lipid parameters including PCSK9,35 which binds to the LDL- receptor. Here, fasting plasma level of PCSK9 significantly decreased after milk PL intervention regardless of dose, suggesting that the lowering effect of milk
on April 1, 2021 by guest. Protected by copyright.
http://gut.bmj.com/
497 Vors c, et al. Gut 2020;69:487–501. doi:10.1136/gutjnl-2018-318155
Figure 6 Milk polar lipids (PL) impact on intestinal cholesterol absorption in the VALOBAB- D pilot study in ileostomy volunteers. Panel explanation
(A), cumulated enrichment over 0–480 min of [2H]-cholesterol in plasma (B) and chylomicron- rich fraction (CMRF) (C), ileal losses of total cholesterol
(D) and sphingomyelin (SM) (E), during the 0–240 min and 240–480 min postprandial periods (see also online supplementary figure S3G for SM composition in ileal efflux). Data are expressed as mean±SEM; n=4 per group. (B) Friedman test (pmeal) followed by Dunn’s post hoc tests for control and 5 g- PL groups. (C) Repeated measures one- way analysis of variance (ANOVA) (pmeal) followed by Tukey’s post hoc tests. (D, E) Repeated measures
two- way ANOVA (pmeal, ptime, pmeal×time) followed by Tukey’s post hoc tests. *Pposthoc<0.05 vs control group. The pPL compares the effect of control meal with both PL meals regardless of dose. Sample size: n=4 subjects, crossover design (see online supplementary figure S2). NB: The 8- hour total cholesterol efflux (tracer+tracee in both free and esterified forms) after the control meal (642±57 mg) was consistent with previous reports56; here after 3 g- PL meal the 8- hour total cholesterol efflux was 1510±417 and 1752±354 mg after 5 g- PL meal. NB: The proportion vs ingested milk SM of the 8- hour ileal efflux of milk SM after cheese matrix (20%–25% of ingested dose) was similar with 19% reported after pure milk SM in six ileostomy subjects.29
PL on serum LDL- C may be mediated at least in part by PCSK9 despite the lack of group effect. Previous studies in healthy men and women reported no reduction of fasting total C, LDL- C, TAG and/or ApoB after 2–12 weeks interventions with 1 g/day of milk SM36 or up to 2.8 g/day supplementation with milk PL/ MFGM,15 16 37 38 despite control (other PL or devoid of PL) increased such risk markers. Only one 4- week crossover trial with low- fat buttermilk- based drink showed decreased fasting serum total C (−3.1%), LDL- C (−3.1%) and TAG (−10.7%), although with no effect on HDL- C or ApoB48.26 The present strategy based on triglyceride substitution by milk PL in a full- fat
dairy product was successful to reduce lipid markers of CVD risk, probably partly because of products being isolipidic (energy intake not increased) and comprising a butterserum- derived ingredient allowing up to 5 g of milk PL.
We cannot rule out that differences in cheese TAG content may account for triglyceridemia reduction. To the best of our knowledge, there is no available data or model in the literature allowing to estimate the impact of substituting TAG with PL on triglyceridemia. Interestingly, we showed that plasma- TAG, chylomicron- TAG and plasma ApoB48 decreased significantly after 4- week intervention but only in the 5 g- PL group (not in
on April 1, 2021 by guest. Protected by copyright.
http://gut.bmj.com/
498 Vors c, et al. Gut 2020;69:487–501. doi:10.1136/gutjnl-2018-318155 3 g- PL and control groups). In ileostomy subjects, postprandial
accumulations of plasma- TAG and chylomicron- TAG were not different after consumption of the 0, 3 and 5 g- PL enriched cheeses. We showed previously that in mice gavaged with lipid emulsions of equal dietary TAG content but differing in PL type (milk vs soy PL), emulsions with milk PL resulted in faster clearance of postprandial TAG and ApoB48, and lower intes-tinal APOB gene expression 4 hours after gavage.10 Regarding intestinal lipid absorption, other authors however described that lymphatic TAG were similar after gavage with an emulsion containing 200 mg TAG and an emulsion with 177 mg TAG and 27 mg of milk PL.39 Therefore, preclinical and clinical studies are still needed to elucidate (i) whether a threshold amount of dietary TAG substitution by PL exists in order to impact significantly triglyceridemia and (ii) whether milk PL can impact directly the intestinal chylomicron secretion and/or hepatic clearance, and thereby triglyceridemia. Furthermore, milk PL cheeses contained higher PUFA amounts than the control cheese that could trigger the potential reduction of lipid markers of CV risk, especially LDL- C. We thus examined if the different PUFA contents of cream cheeses could have significantly impacted the observed LDL- C reduction in the VALOBAB- C trial according to the linear predictive model established by Mensink and Katan.40 Assuming the worst effect of SFA and the most beneficial effect of PUFA on LDL- C, the model predicts a LDL- C reduction of −18 µM (ie, −0.5%) in the 5 g- PL group, which remains marginal compared with the observed reduction in the present study (−8.7%). This strengthens our conclusion that the lowering effect of milk PL on lipid markers of CVD risk may be due to mechanisms associ-ated with cholesterol fate in the intestine due to milk SM.
Because people spend the most time in a postprandial state and postprandial lipemia is now recognised as an important indepen-dent marker of CVD risk,41 volunteers were submitted to test meal challenges to analyse intestine- derived chylomicrons,42 chylomicron- bound Apo48,32 ApoB/ApoA1 and ApoB48/ApoB ratios during 8 hours. ApoB/ApoA1 ratio reflects the balance between pro- atherogenic LDL particles and anti- atherogenic HDL particles,43 whereas ApoB48/ApoB ratio depicts the contri-bution of chylomicrons and chylomicron remnants to total atherogenic particles in triglyceride- rich (TRL) lipoprotein fractions.44 The studies in healthy humans performing single postprandial tests showed hitherto no effect of milk PL on post-prandial lipids and ApoB/ApoA1 ratio45 or decreased postpran-dial total C and LDL- C but increased TAG13 versus no PL. The present intervention had a beneficial cardiometabolic impact by reducing significantly postprandial CV risk markers. We also underline the concomitance of sustained changes in postprandial lipids by milk PL. Mechanistically, the 5 g- PL dose specifically reduced the postprandial intestine- derived TRL lipids, consis-tently with the decreased postprandial TAG. CMRF particle size was unaffected, indicating decreased particle number by the 5 g- PL dose. The collected CMRF includes intestine- derived chylomicrons and other partially delipidated remnant particles. Hence, 5 g/day of milk PL could beneficially limit chylomi-cron- TAG synthesis/accretion and/or improve hepatic clearance. Regarding gut- associated mechanisms, we showed in a subgroup that milk PL interventions increased faecal copros-tanol, a non- absorbable molecule.46–48 This suggests a contri-bution of this increased intestinal cholesterol- to- coprostanol conversion in the serum total C- lowering effect of milk PL. As they naturally contained more cholesterol than the control cheese, milk PL- cheeses may have fuelled some specific bacte-rial strains known to convert cholesterol into coprostanol.46 Gut microbiota is now considered as an ‘essential organ’ in numerous
metabolic functions,49 including regulation of lipid homeostasis and cholesterol metabolism,50 and can be altered by synthetic emulsifiers.1 2 Therefore, we quantified in faecal samples the two main phyla (Bacteroides- Prevotella groups (gp.) and
Firmic-utes) and the dominant bacterial gp., families or genera that may
exhibit interesting inflammatory or metabolic functions.51 In high- fat- fed mice, milk SM and milk PL increase the abundance in gut microbiota of Bifidobacterium spp52 53 (associated with benefits regarding metabolic disorders54): this was not observed here in humans. However, milk PL could have modulated other bacterial genera/species, which deserves further studies using high- throughput techniques. More particularly, the recent find-ings by Cuevas- Tena et al suggest that the efficiency of choles-terol conversion would be related to microbial density, as a coprostanol/cholesterol ratio >15 was associated with high level of coprostanoligenic bacteria (108 cells/g).20 In our VALOBAB- C study, 8.5% of volunteer subset had a coprostanol/cholesterol ratio >15 before intervention vs 50% after intervention, and this observation was related to the milk PL effect. In line with these observations, we cannot rule out that the present dietary inter-vention with milk PL could have modulated the level of coprosta-noligenic bacteria in the gut. Regarding microbiota functionality, we showed in a subgroup of volunteers that faecal SCFA were not differentially impacted by interventions. Thus, the present results suggest that short- term increased intake of milk PL did not have a drastic effect on the main bacterial communities of the gut microbiota, although it does not imply that specific bacterial species not targeted in the present approach could have been modulated by the milk PL supplementation. Moreover, the present negative correlations between the faecal copros-tanol/cholesterol ratio and LDL- C and total cholesterol are in line with a recent review describing such an inverse relationship and suggesting that produced coprostanol can modulate choles-terolaemia.55 A high efficiency of cholesterol- to- coprostanol metabolism was also suggested to reduce the risk of CVDs.55 The quantification and functional analysis of coprostanoligenic bacteria thus deserve further investigation for future research in the context of milk PL supplementation.
Considering the lack of human mechanistic studies on dietary PL impact on intestinal cholesterol absorption,3 we performed a pilot postprandial trial on ileostomy subjects using tracers, a gold- standard approach.56 The similar iAUC of serum- lipids and chylomicron- lipids between meals rules out differences in hepatic chylomicron clearance. The lower [2H]-cholesterol in
CMRF shows that milk PL can decrease the postprandial incor-poration of dietary cholesterol into chylomicrons in humans. Moreover, the 8- hour total ileal cholesterol efflux ((ingested cholesterol fraction remaining unabsorbed by the small intes-tine)+(endogenous cholesterol that was not reabsorbed)) was significantly increased after milk PL meals, which can explain the lower plasma postprandial concentrations of [2H]-cholesterol
with milk PL. Previous rodent and in vitro studies reported that dietary SM could decrease cholesterol absorption by forming unabsorbed complexes with cholesterol.8 9 57 As here 20%–25% of ingested milk SM was found intact in ileal efflux, the lower cholesterol absorption can be partly explained by its interactions with unabsorbed milk SM in the gut. However, total cholesterol ileal efflux after PL meals (~1510–1750 mg) was even twice greater than expected by summing (control cholesterol efflux) +(PL- meal cholesterol content) (~750 mg). ‘Apparent negative absorption’ of cholesterol was also reported after intraduodenal infusion of lecithin (30 g/day) in humans.58 This suggests that (i) the undigested milk SM could also decrease the degree of reabsorption of endogenous intestinal- mucosa cholesterol and
on April 1, 2021 by guest. Protected by copyright.
http://gut.bmj.com/
499 Vors c, et al. Gut 2020;69:487–501. doi:10.1136/gutjnl-2018-318155
(ii) milk PL and/or SM could also enhance the transintestinal cholesterol excretion (TICE), that is, an increased reverse absorption of endogenous cholesterol in the small intestine.59 Under basal conditions in mildly hypercholesterolaemic men, TICE contributes for 35% of faecal neutral sterol excretion.60 Therefore in the overweight women of VALOBAB- C trial, an increased ileal efflux of cholesterol could have contributed to the observed hypocholesterolaemic effects, as supported by VALOBAB- D trial. The hypothesis of the potential involvement of TICE enhancement deserves further mechanistic investiga-tions in humans.
Several nuances have to be made: VALOBAB- C results cannot be extrapolated to individuals with other metabolic disorders/ diseases (primary dyslipidaemia, normal weight subjects). Some specific and/or cumbersome analyses have only been carried out on a limited number of subjects. Further studies in men and in premenopausal women and using long- term interventions may now be of particular interest. Parallel to PL, the specific impact of the MFGM proteins, which can generate bioactive peptides in the gut, has not been assessed in the present studies and should be investigated in future research. Finally, characterisation of the gut microbiota in the present work was performed using a targeted metagenomic approach (16S rDNA sequencing) and future mechanistic studies should include shotgun metagenome approaches.
Altogether, these studies provide the first evidence that addi-tion of up to 5 g of milk PL/day can be safely used as part of a balanced diet, with no apparent short- term adverse effect on neither lipid metabolism nor major bacterial phyla of gut microbiota, and with significant favourable effects on choles-terol homeostasis and markers of CVD risk despite a higher cholesterol content in milk PL- enriched cheeses. Moreover, the present dietary strategy is applicable in everyday life as cheese is a widely consumed dairy worldwide.4 Today in addition to lifestyle modifications as first- line therapy,61 many strategies efficiently reduce LDL- C, for example, pharmaceutical treat-ments (statins, ezetimibe, PCSK9 inhibitors), however costly or with undesirable side effects.62 The present dietary intervention with milk PL reduced LDL- C as effectively as dietary strategy based on phytosterol supplementation (2 g/day inducing −8% to −10% LDL- C but with doubts about undesirable side effects).63 The present results may thus offer a promising alternative for health professionals to improving dietary advice and provides competitive future prospects regarding nutritional formula-tions. If the present clinical results are further confirmed, they could provide a new open avenue for health claims on labels and new types of enriched foods with milk PL regarding their cholesterol- lowering effects. Moreover, the present findings provide a molecular explanation of possible mechanisms by which MFGM- rich full- fat dairy like cheese are associated with metabolic benefits.64 65 They support a specific role of milk SM that lowers intestinal cholesterol absorption and delivers unab-sorbed lipids to the colon. This work thus offers important perspectives for a larger use of milk PL- rich fractions as natural functional food ingredients to substitute the synthetic ones suspected to promote metabolic disorders, representing a poten-tial novel route to improve cardiometabolic health at the popu-lation level. Finally, the present findings demonstrate the need to further investigate the impact of milk PL on inflammatory cardiovascular risk markers and also their potential effect on coprostanoligenic bacteria and their potential role in restoring gut microbiota eubiosis in disease.
Author affiliations
1Univ lyon, carMen laboratory, inserM, inra, insa lyon, Université claude Bernard lyon 1, charles Mérieux Medical school, 69600, Oullins, France 2crnh rhône- alpes, hospices civils de lyon, cens, centre de recherche en nutrition humaine rhône- alpes, 69310, Pierre- Bénite, France
3Université clermont auvergne, inra, Unh, Unité de nutrition humaine, crnh auvergne, 63000, clermont- Ferrand, France
4Université clermont auvergne, cnrs, sigMa clermont, institut Pascal, 63000, clermont- Ferrand, France
5chU clermont- Ferrand, Unité de Biostatistique- informatique Médicale, 63000, clermont- Ferrand, France
6Unité de nutrition endocrinologie Métabolisme, service de Biochimie, centre de Biologie et de Pathologie sud, hospices civils de lyon, 69310, Pierre- Bénite, France 7acTalia Dairy Products and Technologies, 17700, surgères, France
8iTerg, 33610, canéjan, France
9chU clermont- Ferrand, crnh auvergne, 63000, clermont- Ferrand, France 10Université clermont auvergne, inra, UMr 454, MeDis, 63000, clermont- Ferrand, France
11sTlO, science et Technologie du lait et de l’Œuf, inra, agrOcaMPUs OUesT, 35000, rennes, France
12enilia- ensMic, 17700, surgères, France
13Fédération d’endocrinologie, Maladies Métaboliques, Diabète et nutrition, hôpital louis Pradel, hospices civils de lyon, 69500, Bron, France
14Unité Maladies héréditaires du Métabolisme, service de Biochimie et Biologie Moléculaire grand est, centre de Biologie et de Pathologie est, hospices civils de lyon, 69500, Bron, France
15Université claude Bernard lyon 1, Faculté de médecine lyon- sud- charles Mérieux, eMr 3738, 69600, Oullins, France
16centre hospitalier lyon sud, service de chirurgie Digestive, hospices civils de lyon, 69310, Pierre- Bénite, France
17hospices civils de lyon, 69000, lyon, France
Twitter @Michalski_Mc, @cecile_vors
Acknowledgements The authors would like to thank the volunteers of ValOBaB- c and ValOBaB- D trials, Dr n Feugier (crnh- ra) and a Prulière (crnh- a) for volunteer recruitment/follow- up; c Maitrepierre, J Peyrat, e Bain (crnh- ra), D Provenchère, h Parrot, n lyon and n Meunier (crnh- a) for clinical/ technical help; n lyon- Belgy (crnh- a) for help in dietary analysis; K Bertrand (iTerg), a Faure, M cervantes and s gonin (Unh), P calmard and J rivière (hcl) for help in lipid analyses, c louche- Pélissier (crnh- ra) for help in tracer analysis; c cuerq (hcl cBs) for stool lipid analyses; c Jouve (Unh) for technical assistance in blood lipid analysis; s robert (Uca) for her contribution to the statistical analyses; D Kalnin (Philolao) for help in the management of cream cheese randomisation; Professor Y François (hcl lyon sud), Professor D Pezet and B gillet (clermont hospital) for screening ileostomy patients list; Dr s charrière for useful discussions; n leconte, JY gassi and F gaucheron (sTlO, Plateforme lait) for assistance in transferring Pl enrichment process to enilia and c Bourlieu (sTlO) for contribution in buttermilk Pl analysis; V Plattner (hcl) and the clinical research department for trials’ monitoring; c Oudin for her skillful assistance in anr ValOBaB project coordination. Members of the steering committee of anr ValOBaB project (partners carMen/inra, Unh/Uca, sTlO/inra, enilia- ensMic, iTerg, MeDis, cniel) are acknowledged for useful discussions. The authors would like to thank cniel (French Dairy interbranch Organisation) for financial support. c Vors and l Joumard- cubizolles acknowledge anr for postdoctoral fellowship. M lecomte thanks région rhône- alpes arc1 for PhD grant. The authors acknowledge that part of this work has been presented in congresses (conference abstracts): nutrition 2018 (Boston, Usa, June 2018), euroFedlipid (Belfast, UK, september 2018), Journées Francophones de nutrition (nice, France, november 2018), nutrition 2019 (Baltimore, Usa, June 2019). Figures 1a, 2a and 6a contain pieces of artwork that are derivatives of artworks kindly provided by the servier Medical art database licensed under a creative commons attribution 3.0 Unported license. Contributors M- cM, cM- B, cV, Mle, BM, Mla, sl- P: conception of the studies. M- cM, cM- B, lO, cV, lJ- c, sl- P, BM, emco, JD, FJ: methodology. cV, lJ- c, Mle, lM, FJ, sl- P, JD, aBD: validation of data. lO, cV, lJ- c, emco, Mle, lM, FJ, aBD: formal analysis of data. cV, lJ- c, Mle, JD, eB, lM, FJ, sl- P, aBD, cD- F, Ms, ac, aB, aW, Vs, FM- l, Dc, Kr, Pg: performed clinical and analytical investigations. edco, Kr, Pg, J- PB, gg- g: provided essential resources. cV, lO, emco, lJ- c, Mle: performed data curation. cV, lJ- c, M- cM, emco, Mle, lO, MlB, cM- B: wrote original draft. all: reviewed and edited the original draft. cV, lJ- c, emco, Mle, MlB, M- cM: performed data visualisation. PM, Mla, hV: contributed to results interpretation and revised manuscript. M- cM: coordinated the project and has primary responsibility for final article content. all authors read, revised and approved the final manuscript. Funding This work was supported by (i) the agence nationale de la recherche under reference anr-11- aliD-007-01 (ValOBaB project "sustainable ValOrization of Buttermilk: nutritional Benefits, functional value in food products and consumer perception", coordinated by Mc Michalski; endorsed by competitiveness cluster
on April 1, 2021 by guest. Protected by copyright.
http://gut.bmj.com/