HAL Id: hal-01666355
https://hal.inria.fr/hal-01666355
Submitted on 18 Dec 2017
HAL is a multi-disciplinary open access
archive for the deposit and dissemination of sci-entific research documents, whether they are pub-lished or not. The documents may come from teaching and research institutions in France or abroad, or from public or private research centers.
L’archive ouverte pluridisciplinaire HAL, est destinée au dépôt et à la diffusion de documents scientifiques de niveau recherche, publiés ou non, émanant des établissements d’enseignement et de recherche français ou étrangers, des laboratoires publics ou privés.
Velocity–pressure loops for continuous assessment of
ventricular afterload: influence of pressure measurement
site
Jona Joachim, Fabrice Vallée, Joaquim Mateo, Arthur Le Gall, Stéphanie
Lenck, Sandrine Millasseau, Emmanuel Houdart, Alexandre Mebazaa, Etienne
Gayat
To cite this version:
Jona Joachim, Fabrice Vallée, Joaquim Mateo, Arthur Le Gall, Stéphanie Lenck, et al.. Velocity– pressure loops for continuous assessment of ventricular afterload: influence of pressure measure-ment site. Journal of Clinical Monitoring and Computing, Springer Verlag, In press, pp.1-8. �10.1007/s10877-017-0082-3�. �hal-01666355�
1
Velocity-Pressure Loops for continuous assessment of
ventricular afterload: Influence of pressure
measurement site
Jona Joachim1,2,3,4*, MD; Fabrice Vallée1,2,3,4, MD; Arthur Le Gall1,2,3, MD; Joaquim Matéo1,3,
MD; Stéphanie Lenck5, MD ;Sandrine Millasseau6, PhD; Emmanuel Houdart5, PhD ;Alexandre
Mebazaa 1,2,3, PhD; Etienne Gayat1,2,3, PhD
1 Department of Anesthesiology and Critical Care, St-Louis-Lariboisière-Fernand Widal University Hospitals, Assistance
Publique - Hôpitaux de Paris, Paris, France;
2 INSERM UMR-942, Paris, France; 3 Paris Diderot University, Paris, France ;
4 LMS Polytechnique and M3DISIM, Inria, Saclay, France;
5 Department of Neuroradiology, St-Louis-Lariboisière-Fernand Widal University Hospitals, Assistance Publique - Hôpitaux
de Paris, Paris, France;
6 Pulse Wave Consulting, St Leu la Foret,France;
* J.J and F.V equally contributed to this present study
Running title:
Corresponding author :Jona Joachim, jona@joachim.cc, Tel : +33 1 49 95 80 71
Anesthesiology – Intensive care – SMUR department, Saint Louis – Lariboisière- Fernand Widal University hospitals, 2 rue Ambroise Paré, 75010 Paris
2
If available the 16-digit ORCID of the authors Jona Joachim : 0000-0002-2945-4554 Fabrice Vallée : 0000-0001-8204-3626
Authors’ contribution
JJ, F.V., A.L.G., E.G., and A.Me. conception and design of research; F.V., A.L.G., O.P., J.M. and J.J. performed experiments; E.G. and A.L.G. analyzed data; A.L.G. and E.G. interpreted results of experiments; E.G., A.LG. and SM prepared figures; F.V., A.L.G., E.G. and A.Me. drafted manuscript; F.V., A.L.G, E.G., and S.M edited and revised manuscript; F.V., A.L.G., J.J., O.P., J.M., S.M., A.Me. and E.G. approved final version of manuscript. JJ and FV equally contributed to this present study.
Acknowledgments
We thank anesthetic nurses and the staff of neuroradiology for their support in the conduct of the present study.
3
Abstract
Purpose
VPloop, the graphical representation of pressure versus velocity, and its characteristics angles, GALA and β, can be used to monitor cardiac afterload during anesthesia. Ideally VPloop should be measured from pressure and velocity obtained at the same arterial location but standard of care usually provide either radial or femoral pressure waveforms. The purpose of this study was to look at the influence of arterial sites and the use of a transfer function (TF) on VPloop and its related angles.
Methods
Invasive pressure signals were recorded in 25 patients undergoing neuroradiology intervention under general anesthesia with transesophageal flow velocity monitoring. Pressures were recorded in the descending thoracic aorta, abdominal aorta, femoral and radial arteries. We compared GALA and β from VPloops generated from each location and in high and low risk patients.
Results
GALA was similar in the central locations (55°[49-63], 52°[47-61] and 54°[45-62] from descending thoracic to femoral artery, median[interquartile], p=0.10), while there was a difference in β angle (16°[4-27] to 8°[3-15], p<0.0001). GALA and β obtained from radial waveforms were different (39°[31-47] compared to 46°[36-54] and 6°[2-14] compared to 16°[4-27] for GALA and β angles respectively, p<0.001) which was corrected by the use of a TF (45°[32-55] and 17°[5-28], p=ns). Conclusion
GALA and β are underestimated when measured with a radial catheter. Using pressure waveforms from femoral locations alters VPloops, GALA and β in a smaller extend. The use of a TF on radial pressure allows to correctly plot VPloops and their characteristic angles for routine clinical use.
Keywords: flow velocity, arterial pressure, left ventricular function, afterload, anesthesia, cardiac output,
4
Introduction
During general anesthesia, hypotension episodes are common events and have multiple, sometimes intricate causes like hypovolemia, hemorrhage, acute cardiac dysfunction or vasodilation. The latter is often due to anesthetic drugs. These events result in reduced organ perfusion and may affect the heart, the brain or the kidneys, increasing therefore peri-operative morbidity and mortality (1,2).
Consequently, current guidelines (3,4) emphasize a global approach to assess and treat hemodynamic risks including : (I) Preoperative evaluation of individual risk factors (preoperative consultation, use of prognostic scores, evaluation of surgical risk), (II) Hemodynamic optimization during surgery, and (III) fast post-operative recovery. To achieve this, scientific societies recommend, for high-risk patients, the use of continuous hemodynamic monitoring of invasive arterial pressure and cardiac output for a personalized patient approach and better care during surgery.
With an invasive arterial line associated with a trans-esophageal Doppler, our team was able to develop Velocity-Pressure (VP) loops which allow integrative analysis of aortic flow velocity (V) and pressure (P) (5,6). The VP Loops are the graphical representation of the pressure and velocity during one heart beat and are directly related to ventricular afterload and its different components : resistance, compliance and stiffness (6). Two remarkable angles, called β and GALA (Global AfterLoad Angle), were defined from the VP Loops and are described in figure 1. Following the concept of arterial reflection waves, the β angle corresponds to the beginning of the backward aortic wave and could be considered a marker of arterial stiffness (19). The GALA angle characterizes pressure-velocity relationship at peak systolic pressure and should be considered a global and integrative estimation of afterload. These two angles can be used to identify patients with cardiovascular risk factors and are greatly modified by vasopressors (5,6).
5
In this previous study, arterial pressure was measured in the descending abdominal aorta just above the iliac bifurcation from the standard of care 20cm-long femoral catheter. It has been however largely shown that arterial pressure waveforms and values can be considerably different depending on arterial measurement sites (7). Due to wave propagation, reflection and Windkessel effect, there is a wave amplification phenomenon as the pressure waveform travels further away from the heart (8–10), resulting in higher systolic blood pressure (SBP) as well as very slightly reduced diastolic (DBP) and mean blood pressure (MBP) at the periphery. Systolic pressure amplification is not negligible and has varying magnitude across patient population (8). Several studies have shown that central aortic pressure is a stronger predictor of cardiovascular morbidity and mortality than peripheral pressure (11). This phenomenon is also likely to influence the shape and angles of VP Loops, especially if the pressure is measured at the peripheral level such as at the radial artery.
Ideally, VP Loops should be built from velocity and pressure waveforms measured at the same arterial site. However invasive measurements of thoracic aortic pressure are not possible in everyday
procedures. During routine anesthesia, the most used invasive pressure site is the radial artery. Femoral access is also common to a lesser extent. The aim of this study was to assess the influence of pressure measurement site on VP Loops, β and GALA angles by comparing VP Loops obtained from invasive radial pressure, from invasive aortic pressure and from reconstructed aortic pressure obtained by applying a transfer function on peripheral pressure.
Material and Methods
Population
Between January 2015 and March 2016, patients scheduled for elective or emergency neuroradiology intervention under general anesthesia in our department were screened for this
6
prospective observational study. Patients were included if their perioperative risk required an invasive arterial line as well as cardiac output monitoring. Patients less than 18 years old, pregnant women and patients who refused to provide informed consent were not included. The study protocol was approved by the research ethics committee (CE SRLF 11-356).
Data collection
Patient demographic data was collected during the preoperative consultation. Hydroxyzine (1 mg/kg) was administered orally, one hour before the interventional neuroradiology procedure. General anesthesia was induced and maintained with Propofol (75-150 μg/kg/min) and Remifentanil (0,2-0,5 μg/kg/min). All patients were intubated after paralysis with Atracurium (0,5 mg/kg) and mechanically ventilated with a tidal volume of 6 ml/kg. Respiratory rate was adjusted in order to obtain an EtCO2
between 35 and 38 mmHg. Radial artery was then cannulated and esophageal Doppler probe CardioQ-ODM+ (Deltex Medical, Chichester, UK) was inserted through the mouth. Position and gain of the Doppler probe were adjusted according to manufacturer instructions to obtain maximal peak velocity and best Doppler spectrum definition respectively. During their interventional neuroradiology
procedure, all patients had standard of care monitoring consisting of ECG, heart rate, pulsated oxygen saturation (SpO2), non-invasive cuff blood pressure, as well as end tidal CO2, respiratory rate, tidal
volume. Administration of fluids and vasoconstrictors was decided by the physician in charge based on patient needs and independently of the study.
Cardiac output monitoring
Cardiac output was measured using the transesophageal Doppler CardioQ-ODM+ (Deltex Medical, Chichester, UK) which measures instant blood velocity in the descending thoracic aorta from a continuous Doppler probe inserted inside the esophagus. Blood velocity is closely related to blood
7
flow via the formula where Q(t) is blood flow as a function of time, V(t) is blood velocity as a function of time and A(t) is the aorta cross section as a function of time. Stroke volume (SV) and cardiac output (CO) are then calculated from the beat to beat measure of blood flow and an approximation of A(t) proprietary to Deltex incorporating patient demographics. In this study, we used digitalized continuous raw velocity V(t) data.
Radial and aortic pressure measurements
A radial intra-arterial catheter (SAC 00520 20GA, Arrow International, Reading, PA, UA) was used to record SBP, DBP, MBP values and to collect raw continuous pressure waveforms during the entire procedure. As required by the standard of care of the interventional neuroradiology procedure, the neuroradiologist also cannulated the femoral artery using the Seldinger technique and inserted a catheter (Mach1 5F, Boston Scientific, Marlborough, MA, USA) through an 5 cm-introducer
(Radiofocus Introducer II 6F, Terumo Europe, Leuven, Belgium). The radial and aortic catheters were connected to the same type of pressure transducer (TruWave, Edwards Lifesciences, Irvine, CA, USA). Both transducers were placed at the same medio-thoracic level. The femoral catheter was advanced through the aorta up to the intracranial arteries in order to complete the programmed intervention. At the end of the procedure, during catheter withdrawal, pressure waveforms were recorded at 3
predefined aortic locations: in the descending thoracic aorta just in front of the esophageal Doppler probe, in the abdominal aorta at the level of the renal arteries (as in our previous study (6)) and in the femoral artery just outside the introducer. At each location, we obtained 15 to 20 seconds of
simultaneous invasive aortic pressure, esophageal Doppler flow velocity and invasive radial pressure signals. During signal acquisition, no surgical stimulation occurred, no change of anesthetic drug regiments was performed, no vasoconstrictor was administered and no ventilatory maneuver was conducted in order to have hemodynamic stability.
8 VP Loop Construction
Digitalization of pressure and esophageal Doppler signals was performed with the IntelliVue MP60 monitor (Philips, Eindhoven, The Netherlands) at a sampling frequency of 125 Hz and saved using ixTrend software (ixellence, Wildau, Germany) on a computer. Due to electronic within the equipment, there was a variable time delay between pressure and flow velocity signals. To plot VP Loops, pressure and velocity need to be synchronized so we developed a method to automatically detect the beginning of the cardiac cycle based on the local maxima of the second pressure derivative (
max) (13) and inspired by ECG cycle detection algorithm (14). After re-alignment, VP Loops
were plotted for each time point of the whole cardiac cycle. β and GALA angles were calculated as explained previously (6) and shown on figure 1. In short, β angle represents the angle between the lines from the onset of pressure and flow (point A on figure 1) to the point of maximal flow (point B) and the point of maximal pressure (point C). GALA is defined from the angle formed by the line from the beginning of the heartbeat (point A) to the peak pressure (point C) with the horizontal line. It represents a global estimation of ventricular afterload (6).
VP Loops constructed from descending thoracic aorta (and noted VP Loopref) were chosen as the
reference as they were plotted from pressure waveforms recorded at the same arterial location than velocity recording. VP Loops obtained from radial, abdominal or femoral pressure waveforms were respectively called VP Looprad , VP Loopabd andVP Loopfem.
Radial to thoracic transfer function
From the data of the 22 patients with simultaneous radial and descending thoracic pressures signals, we generated a transfer function (TF) using a similar method as described previously (7,14,15). We used an auto-regressive filter to mathematically transform the invasive radial waveform into descending
9
thoracic waveforms. Calculations relative to the transfer function were done using Matlab 8.5 (The MathWorks, Inc., Natick, MA, USA). VP Loops obtained from radial waveforms with transfer function were called VP LoopTF.
Statistical Analysis
Patients included in the study were separated into two groups according to their cardiovascular risk factors (CVRF): low risk (LR) patients presented no or only 1 CVRF. High risk (HR) patients were patients with at least 2 CVRF. The following CVRF were considered: age > 55 years, active smoking, hypertension, dyslipidemia, diabetes mellitus, history of myocardial infarction [16,17].
Statistical analysis was performed using GNU R(19). Continuous variables were expressed as median [interquartile range]. Qualitative variables were expressed as n (%). P-value less than 5% was considered significant. Angles of VP Looprad , VP Loopabd andVP Loopfem and VP LoopTF were
compared to angles obtained from VP Loopref using a paired Wilcoxon signed-rank test.
Results
Population
Forty-five consecutive patients were included in this study. Ten patients were excluded because monitoring of the invasive aortic pressure could not be obtained due to technical difficulties. Three patients were excluded because they were subject to significant hemodynamic modifications during the procedure as defined by a mean blood pressure variation greater than 10%. Four patients were excluded because the quality of the esophageal Doppler signal was insufficient. Three patients waived consent. The characteristics of the remaining 25 patients are shown in table 1. Ten belonged to the low
10
cardiovascular risk (LR) group and 15 belonged to the HR group. Two patients from the LR group and one patient from the HR group did not have an invasive radial artery line.
VP Loopref Angles
The VP Loops obtained with pressure and flow measured in the descending thoracic aorta were used as reference in our study. In the entire population of 25 patients, GALA angle was of 46° [36-54] and β angle was of 16° [4-27]. HR patients had GALA and β angles significantly higher than those of LR patients: 55° [49-63] vs 38° [23-45] and 27° [20-36] vs 5° [1-14], p < 0.0001 for GALA and β respectively.
VP Loopref versusVP Loopabd andVP Loopfem comparison
In the whole population, GALA was similar on VP Loops constructed from descending thoracic aorta, abdominal aorta or femoral artery (55° [49-63], 52° [47-61] and 54° [45-62] for descending thoracic, abdominal and femoral artery respectively, p = 0.10, table 2). There was however a significant difference on β angle which was getting smaller as we progressed from descending thoracic to femoral artery (16° [4-27] to 8° [3-15], p < 0.0001). When decomposing into LR and HR groups, GALA was similar wherever the location of central pressure line used for VP Loops construction (table 2). β angle was significantly smaller when measured from VP Loopfem than from VP Loopref and this difference
was greater in the HR group than in the LR group (Table 2).
VP Loopref versusVP Looprad comparison
In the whole population, GALA and β angles were significantly smaller when VP Loops were plotted using radial artery pressure rather than descending thoracic pressure (39° [31-47] vs 46° [36-54], p < 0.0001 for GALA and 6° [2-14] vs 16° [4-27], p < 0.0001 for β). These differences hold true
11
when HR and LR group were taken separately. However, the difference was greater in the HR group compared to the LR group (Table 3). Graphical representation of the changes in VP Loops due to the use of descending thoracic aortic or radial pressure are shown on Figure 2 and 3.
VP Loopref versusVP LoopTF comparison
As the use of radial waveforms was not suitable to correctly render VP Loopref, we calculated a
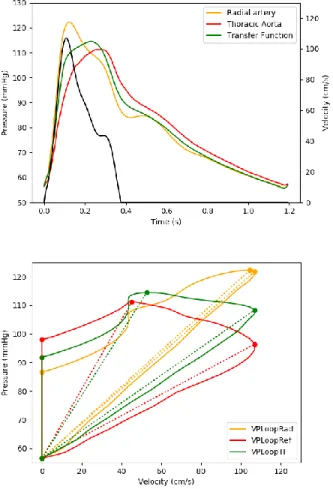
transfer function to “transform” radial pressure waveforms into descending thoracic pressure waveforms. Radial line was unavailable in 3 of the patients of the cohort, so the TF was calculated from the remaining 22 subjects with simultaneous recording of descending thoracic and radial pressures.. Upper panels of figure 2 and 3 show examples of reconstructed descending thoracic
waveform in a LR and in a HR patient. Reconstructed waveform provided good estimation of the reference descending aorta waveform leading to similar VP Loopref and VP LoopTF (figure 2 and 3,
lower panel). While there are significant differences between GALA and β angles from VP Loopref and
VP Looprad (7 [4 ‒ 11]° and 10 [3 ‒ 14]°, p < 0.001 for GALA and β respectively), using the TF
provided GALA and β angles similar to the descending aorta reference (1 [-2 ‒ 1]° and 1 [0 ‒ 3]°, p = NS for GALA and β respectively). This observation holds true whatever patient risk (Table 3).
12
Discussion
The results of this study show there are differences in GALA and β angles values whether the VP Loop is built using a radial pressure waveform rather than a pressure waveform measured in the descending thoracic aorta. Conversely, the changes in GALA and β angles along the aorta were smaller with significantly no changes for GALA. Construction of VP Loop from radial artery pressure results in an under-estimation of both GALA and β angles. This under-estimation is greater in patients with higher cardiovascular risks.
Cardiac afterload depends on arterial compliance, wave reflections and vascular tone (7) but it is difficult to monitor each of these parameters in real time during procedures. To simultaneously interpret both of pressure and flow velocity waveforms, we propose to plot them on the same graph across the cardiac cycle (5,6). The resulting VP Loops provides graphical representation of afterload. To numerically describe these loops, we defined the β and GALA angles (6). These angles are related to arterial stiffness, peripheral vascular compliance and to parameters such as the augmentation index which represents the contribution of reflected waves on pressure waveforms (6). In our previous study we observed different VP Loops in patients with low and high cardiovascular risks. Our present results confirm the previous ones, as both GALA and β angles were increased in the HR risk group. In other terms, high risk population leads to a counterclockwise rotation of the VP Loop axis as well as a widening of the loop.
Previously (6), we plotted VP Loops using pressure waveforms acquired from the standard central monitoring line i.e. from fluid filled catheter positioned in the abdominal aorta, just above the iliac bifurcation using a 20cm long femoral line. As pressure waveforms are greatly influenced by measurement site, there were concerns that these VP Loops might not reflected “gold standard” VP Loops: VP Loops plotted from flow velocity and pressure signals acquired both at the same location point. In the present study, we measured arterial pressure from the central line on 3 aortic points: at the
13
descending thoracic aorta (= the reference point), at the abdominal aorta (as in our previous study) and at the femoral artery. We did not observe any significant differences VP Loop for GALA angles at the abdominal aorta and at the descending thoracic aorta. These results confirmed that GALA can be measured and used from VP Loops obtained from standard of care aortic line, without the need to properly align the esophageal Doppler probe and the pressure catheter. However, β angle varied to a greater extend along the aorta. Further studies are required to fully conclude if these differences are clinically relevant.
The second objective of our study was to see if radial pressure waveforms could also be directly used to plot VP Loop. Such setting have been used by Thiele and coworkers (20). However waveforms as well as systolic pressure can vary a lot between the aortic root and the radial artery (7,21). As the pressure pulse propagates from the heart to the periphery, its peak (i.e. systolic pressure) increases while the waveform becomes “narrower”. This phenomenon is called pressure amplification and varies across age, gender and diseases(22). Reference ranges have been published and the average pressure amplification being about 10mmHg (8). In the present study, we simultaneously measured radial pressure, descending thoracic pressure and descending thoracic flow velocity. The mean pressure amplification between thoracic and radial systolic pressure was 2 ± 11 mmHg (data not shown). This relatively low amplification value can be explained by our population characteristics which mainly included patients with 2 or more cardiovascular risk (60% were high risk patients), The measurement site, descending thoracic instead of ascending aortic pressure used in previous papers (23,24), could also play a part. When we compare VP Loops constructed from radial pressure to VP Loops
constructed from the “reference” descending aortic pressure, we observed marked difference with a clockwise tilt of the waveform. This is reflected on β and GALA angles which are underestimated when using radial waveforms. The difference on VP Loop morphology was even greater in patients in
14
the higher cardiovascular group while this is the group in whom we particularly wish to closely monitor cardiac afterload (25,26).
For over two decades, a methodology called general transfer function has been used to estimates central pressure from peripheral pressure (7,14,15). It has been first commercialized into the SphygmoCor device (AtCor Medical, Australia) followed by other manufacturers. The general TF approach has been extensively validated in coronary patients and can correctly estimate central systolic pressure value (23,24) . There has been however some reserve about the accuracy of the general TF approach to render some high fidelity details such as the augmentation index (27). Existing TF are proprietary to the commercial device and depend on the input sensor. What is more they are all designed to estimate ascending aortic pressure. We hence calculate our own TF to be able to estimate descending aortic pressures from invasive radial waveform. As all signals were measured invasively, calibration was not an issue. Our results showed it is possible to apply a transfer function to reasonable accuracy for the construction of VP Loops and calculation of GALA and β angles. GALA and β angles obtained using the TF were similar to the ones obtained from the reference descending thoracic aorta.
Limits
The main limits of this study are related to the studied population and measurement techniques. Invasive pressure waveforms were measured using a fluid filled catheter as opposed to
micro-manometer sensors which are considered gold standard. Artifacts from the fluid filled line are possible and have been described (28). Using high fidelity transducers might modify the VP Loop definition but we feel that would be negligible as long as great care is taken while handling fluid-filled catheters.
Patients included in this study had invasive measurements because their peri-operative risk required it. However, none presented acute decompensated heart failure or shock. It would be interesting to study VP Loops from the various aortic locations in this particular population where accurate hemodynamic monitoring is particularly useful.
15
We defined a TF from our cohort, Additional studies are required to refine it and test the TF approach during anesthesia on a larger population.
As opposed to our previous work, we did not measure VP Loop changes induced by vasopressor and fluid challenges (6). Indeed, we focused on stable hemodynamics to obtain comparable measure points along the aorta. Additional studies are needed to confirm our findings during vasopressors challenges.
And finally, as no sample size calculation was performed, the non-significance of certain results could be due to lack of power. Our results need to be confirmed in a larger cohort study.
Conclusion
VP Loop. Using pressures waveforms from various arterial sites alters VP Loops and its characteristics angles β and GALA. These differences seem small and might be clinically irrelevant along the aorta but using radial pressure waveforms greatly modify VP Loops, β and GALA angles. Using a radial artery to build VP Loops lead to underestimation of arterial stiffness and cardiac afterload parameters
especially in high cardiovascular risk patients. This underestimation seems to be corrected with a transfer function estimation of aortic pressures from the radial catheter signal.
Conflict of Interest:
Fabrice Vallée, Arthur Le Gall, Etienne Gayat and Alexandre Mebazaa co-own the patent describing the PU Loop (WO 2015173785 A1 "Method for the continuous evaluation of the ventriculo-aortic coupling of at-risk patients by analysis of pressure-flow loops")
Alexandre Mebazaa has received speaker honoraria from Abbott, Novartis, Orion, Roche and Servier and fee as member of advisory board and/or steering committee from Cardiorentis, Adrenomed, MyCartis, ZS Pharma and Critical Diagnostics
Etienne Gayat has received consulting fees from Magnisense, research support from Sphingotec, Deltex Medical and Retia Medical.
16
Fabrice Vallée has received research support from Radiometer, Deltex Medical and Retia Medical.
Sandrine Millasseau has received consulting fees from Alam Medical, AtCor Medical, Mesi Medical and Omron.
Bibliographie
1. Monk TG, Saini V, Weldon BC, Sigl JC. Anesthetic Management and One-Year Mortality After Noncardiac Surgery: Anesth Analg. 2005 Jan;100(1):4–10.
2. Sessler DI, Sigl JC, Kelley SD, Chamoun NG, Manberg PJ, Saager L, et al. Hospital Stay and Mortality Are Increased in Patients Having a “Triple Low” of Low Blood Pressure, Low Bispectral Index, and Low Minimum Alveolar Concentration of Volatile Anesthesia: Anesthesiology. 2012 Jun;116(6):1195–203.
3. Fleisher LA, Beckman JA, Brown KA, Calkins H, Chaikof EL, Fleischmann KE, et al. ACC/AHA 2007 Guidelines on Perioperative Cardiovascular Evaluation and Care for Noncardiac Surgery. J Am Coll Cardiol. 2007 Oct 23;50(17):1707–32.
4. Vallet B, Blanloeil Y, Cholley B, Orliaguet G, Pierre S, Tavernier B. Guidelines for perioperative haemodynamic optimization. Ann Fr Anesth Reanim. 2013 Oct;32(10):e151–8.
5. Le Gall A, Passouant O, Bucciero M, Mebazaa A, Gayat E, Vallée F. Boucle pression/débit pour l’évaluation continue du couplage ventriculo-aortique. Ann Fr Anesth Réanimation. 2014 Sep;33, Supple:A243.
6. Vallée F, Le gall A, Joachim J, Passouant O, Matéo J, Mari A, et al. Beat-by-beat assessment of cardiac afterload using descending aortic velocity-pressure loop during general anesthesia: a pilot study. J Clin Monit Comput. 2017;epub ahead of print.
7. Nichols WW, Nichols WW, McDonald DA, editors. McDonald’s blood flow in arteries: theoretic, experimental, and clinical principles. 6th ed. London: Hodder Arnold; 2011. 755 p.
8. Herbert A, Cruickshank JK, Laurent S, Boutouyrie P. Establishing reference values for central blood pressure and its amplification in a general healthy population and according to
cardiovascular risk factors. EurHeart J. 2014;35(44):3122–33.
9. Caro CG, Pedley TJ, Schroter RC, Seed WA, Parker KH. The Mechanics of the Circulation. 2 edition. Cambridge, UK ; New York: Cambridge University Press; 2012. 550 p.
10. Wilmer W. Nichols. McDonald’s blood flow in arteries : theoretical, experimental and clinical principles. 6th ed. London: Hodder Arnold; 2010.
17
11. Vlachopoulos C, Aznaouridis K, O’Rourke MF, Safar ME, Baou K, Stefanadis C. Prediction of cardiovascular events and all-cause mortality with central haemodynamics: a systematic review and meta-analysis. EurHeart J. 2010 Mar 2;31(1522-9645 (Electronic)):1865–71.
12. Kazanavicius E, Gircys R, Vrubliauskas A, Lugin S. Mathematical methods for determining the foot point of the arterial pulse wave and evaluation of proposed methods. Inf Technol Control. 2005;34(1):29–36.
13. Pan J, Tompkins WJ. A Real-Time QRS Detection Algorithm. IEEE Trans Biomed Eng. 1985 Mar;BME-32(3):230–6.
14. Karamanoglu M, O’Rourke MF, Avolio AP, Kelly RP. An analysis of the relationship between central aortic and peripheral upper limb pressure waves in man. EurHeart J. 1993 Feb;14(0195-668X (Print)):160–7.
15. Pauca AL, O’Rourke MF, Kon ND. Prospective evaluation of a method for estimating ascending aortic pressure from the radial artery pressure waveform. Hypertension. 2001 Oct;38(1524-4563 (Electronic)):932–7.
16. Perk J, De Backer G, Gohlke H, Graham I, Reiner Z, Verschuren M, et al. European Guidelines on cardiovascular disease prevention in clinical practice (version 2012): The Fifth Joint Task Force of the European Society of Cardiology and Other Societies on Cardiovascular Disease Prevention in Clinical Practice (constituted by re. Eur Heart J. 2012 Jul;33(13):1635–701.
17. Goff DC, Lloyd-Jones DM, Bennett G, Coady S, D’Agostino RB, Gibbons R, et al. 2013 ACC/AHA Guideline on the Assessment of Cardiovascular Risk: A Report of the American College of Cardiology/American Heart Association Task Force on Practice Guidelines. Circulation. 2014 Jun;129(25 suppl 2):S49–73.
18. R: A Language and Environment for Statistical Computing. Vienna, Austria: R Foundation for Statistical Computing; 2016.
19. Salvi P. Pulse Waves: How Vascular Hemodynamics Affects Blood Pressure. Springer; 2016. 227 p.
20. Thiele RH, Bartels K, Esper S, Ikeda K, Gan TJ. Real-time doppler-based arterial vascular impedance and peripheral pressure-flow loops: A pilot study. J Cardiothorac Vasc Anesth. 2014;28(1):36–41.
21. Pauca AL, Wallenhaupt SL, Kon ND, Tucker WY. Does radial artery pressure accurately reflect aortic pressure? Vol. 102, Chest. 1992. p. 1193–8.
22. McEniery CM, Yasmin, Hall IR, Qasem A, Wilkinson IB, Cockcroft JR. Normal vascular aging: differential effects on wave reflection and aortic pulse wave velocity: the Anglo-Cardiff
Collaborative Trial (ACCT). JAmCollCardiol. 2005 Nov 1;46(1558-3597 (Electronic)):1753–60. 23. Pauca AL, O’Rourke MF, Kon ND. Prospective evaluation of a method for estimating ascending
aortic pressure from the radial artery pressure waveform. Hypertension. 2001 Oct;38(1524-4563 (Electronic)):932–7.
18
24. Millasseau S, Agnoletti D. Non-invasive estimation of aortic blood pressures: a close look at current devices and methods. Curr Pharm Des. 2015;21(6):709–18.
25. Monk TG, Saini V, Weldon BC, Sigl JC. Anesthetic Management and One-Year Mortality After Noncardiac Surgery: Anesth Analg. 2005 Jan;100(1):4–10.
26. Sessler DI, Sigl JC, Kelley SD, Chamoun NG, Manberg PJ, Saager L, et al. Hospital Stay and Mortality Are Increased in Patients Having a “Triple Low” of Low Blood Pressure, Low Bispectral Index, and Low Minimum Alveolar Concentration of Volatile Anesthesia: Anesthesiology. 2012 Jun;116(6):1195–203.
27. Millasseau SC, Patel SJ, Redwood SR, Ritter JM, Chowienczyk PJ. Pressure wave reflection assessed from the peripheral pulse: Is a transfer function necessary? Hypertension.
2003;41(5):1016–20.
28. Shinozaki T, Deane RS, Mazuzan JE. The dynamic responses of liquid-filled catheter systems for direct measurements of blood pressure. Anesthesiology. 1980 Dec;53(6):498–504.
19 Table 1; Patients characteristics (median [IQR] or n(%)
all (n=25) LR (n=15) HR (n=10) Age (years) 52 [36 – 60] 43 [35 – 53] 57 [55 – 69]* Male 13 (52%) 9 (60%) 4 (40%)* Weight (kg) 69 [62 – 77] 70 [63 – 75] 69 [65 – 88] Height (cm) 167 [160 – 173] 166 [160 – 175] 169 [160 – 170] BMI (kg/m2) 23.7 [22.8 – 28.3] 23.4 [22.9 – 25.9] 24.2 [22.7 – 29.5] ASA score 2 [1 – 3] 2 [1 – 2] 2 [2 – 3] MBP (mmHg) 80 [78 – 89] 83 [74 – 91] 80 [80 – 84] HR (min-1) 66 [58 – 74] 66 [56 – 85] 65 [59 – 72] SV (mL) 74 [62 – 88] 80 [67 – 89] 69 [60 – 83]* CO (l/min) 4.6 [4.1 – 5.8] 4.9 [4.3 – 6.0] 4.3 [4.1 – 5.5]* EtCO2 (mmHg) 33 [32 – 34] 33 [32 – 36] 33 [33 – 34]
Cardiovascular risk prevalence
Age > 55 years 10 (40%) 3 (20%) 7 (70%)*
Hypertension 7 (28%) 3 (20%) 4 (40%)
Diabetes mellitus 2 (8%) 0 (0%) 2 (20%)*
Dyslipidemia 4 (16%) 1 (7%) 3 (30%)*
Smokers 4 (16%) 2 (13%) 2 (20%)
Ischemic heart disease 2 (8%) 1 (7%) 1 (7%)
LR: low cardiovascular risk group HR: high cardiovascular risk group *: p < 0.05 compared to LR groups.
20
Table 2: comparison of angles from VP Loopref ,VP Loopabd andVP Loopfem, in all, low risk (LR) and high risk (HR) patients.
GALA β
VP Loopref VP Loopabd VP Loopfem VP Loopref VP Loopabd VP Loopfem All patients (n=25) 46° [36 - 54] 43° [34 - 49] 45° [34 - 53] 16° [4 - 27]) 11° [2 - 20]* 8° [3 ‒ 15]* LR (n=10) 38° [23 - 45] 38° [27 - 45] 38° [28 - 46] 5° [1 - 14] 5° [2 ‒ 10] 3° [1 ‒ 11]* HR (n=15) 55° [49 - 63] 52° [47 - 61] 54° [45 - 62] 27° [20 - 36] 21° [15 - 28]* 13° [9 ‒ 16]*
21
Table 3: comparison of angles from VP Loopref, VP Looprad and VP LoopTF, in all, low risk patients
(LR) and high risk patient (HR).
GALA β
VP Loopref VP Looprad VP LoopTF VP Loopref VP Looprad VP LoopTF
All (n=22) 46° [36 - 54] 39° [31 - 47]* 45° [32 - 55] 16° [4 - 27] 6° [2 - 14] * 17° [5 - 28] LR (n=8) 38° [23 - 45] 36° [25 - 46] 36° [21 - 44] 5° [1 - 14] 3° [1 - 6] * 7° [2 - 15] HR (n=14) 55° [49 - 63] 45° [40 - 53] * 56° [50 - 62] 27° [20 - 36] 18° [8 - 23] * 29° [23 - 38]
22 Figure 1: 0 20 40 60 80 60 70 80 90 100 110 Velocity (cm/s) Pressure (mmHg) A B C D GALA β
23
Figure 2 : Example of velocity, radial, thoracic and transformed radial waveforms in upper panel and their respective VP Loops in lower in an high risk patient
24
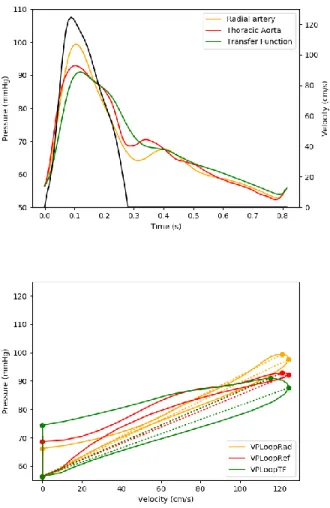
Figure 3 : Example of velocity, radial, thoracic and transformed radial waveforms in upper panel and their respective VP Loops in lower in an low risk patient