HAL Id: hal-01978990
https://hal.archives-ouvertes.fr/hal-01978990
Submitted on 12 Jan 2019
HAL is a multi-disciplinary open access archive for the deposit and dissemination of sci-entific research documents, whether they are pub-lished or not. The documents may come from teaching and research institutions in France or abroad, or from public or private research centers.
L’archive ouverte pluridisciplinaire HAL, est destinée au dépôt et à la diffusion de documents scientifiques de niveau recherche, publiés ou non, émanant des établissements d’enseignement et de recherche français ou étrangers, des laboratoires publics ou privés.
Comparison of recent models for the Mullins effect:
formulation and finite element implementation
Grégory Chagnon, Erwan Verron, Gilles Marckmann, Laurent Gornet, Pierre
Charrier
To cite this version:
Grégory Chagnon, Erwan Verron, Gilles Marckmann, Laurent Gornet, Pierre Charrier. Comparison of recent models for the Mullins effect: formulation and finite element implementation. 3rd European Conference on Constitutive Models for Rubber, Sep 2003, London, United Kingdom. �hal-01978990�
1 INTRODUCTION
Elastomers present a loss of stiffness after the first loading cycle of a fatigue experiment (Mullins, 1969). It has been proved that this phenomenon is only dependent on the maximum deformation previ-ously reached in the history of the material. It is quite important to model it because the mechanical behaviour of rubber products is highly modified by this softening phenomenon. Moreover, as the Mul-lins effect depends on the maximum deformation endured previously, material points of the product are not identically affected. As a consequence, it is not acceptable to determine experimentally an ac-commodated hyperelastic constitutive equation for the material; then stress-softening should be explicit-ly included in the model.
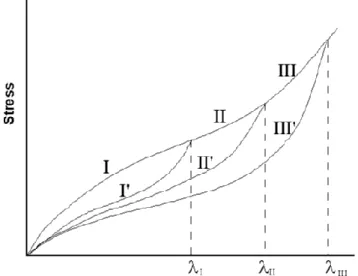
The present paper only focuses on the Mullins ef-fect, others phenomena exhibited by elastomers, such as creep and hysteresis, are not taken into ac-count. The behaviour is then considered time-independent and can be schematically represented by Figure 1 that corresponds to a tensile cyclic test. The virgin undamaged material is first stretched as the extension ratio reaches I and the stress follows the
path I. Then the unloading from I to 0 follows the
path I'. The second loading from 0 to II >I first
fol-lows the path I' until =I then it follows the path II.
The second unloading from stretch ratio II to 0
fol-lows the path II' which is different than the path I'. At a given stretch, the stress on II' is lower than the stress on I'. Repeating this process, the loading path corresponding to the increase of stretch from 0 to II
is the path that joins II' and the part III of the virgin curve. Finally, the corresponding unloading follows the path III'.
Figure 1. Schematic behaviour of a hyperelastic material with stress-softening.
Different constitutive equations for the Mullins effect will be presented and compared using both uniaxial analytical results and finite element simula-tions. Limitations of each model will be highlighted.
2 MODELS FOR THE MULLINS EFFECT
Different approaches have been used for many years to simulate the stress-softening phenomenon in elas-tomers: the physical approach that attempts to de-scribe the evolution of the polymer network under deformation, the phenomenological two-phase net-work theory which considers that the material is constituted of a soft and a hard phases, and the con-tinuum damage mechanics that assimilates stress-softening to damage.
Bueche (1960,1961) developed an uniaxial model by assuming that the Mullins effect is due to the breakdown of links between filler particles and
Comparison of recent models for the Mullins effect: formulation and
finite element implementation
G. Chagnon, E. Verron , G. Marckmann & L. Gornet
Ecole Centrale de Nantes, Institut de Recherche en Génie Civil et Mécanique, 1 rue de la Noë, BP 92101, 44321 Nantes Cedex 3.
P. Charrier
Modyn-Trelleborg, Zone industrielle de Carquefou, BP 419, 44474 Carquefou Cedex
ABSTRACT: The present paper focuses on the modelling of the Mullins effect in elastomers. Different ap-proaches respectively based on physics, damage mechanics and the two-network theory are presented. The pros and the cons to their formulation and finite element implementation are discussed. It appears that all these approaches are complementary and present different limitations due to their formulations.
chains, and that it depends on the maximum stretch history. Harwood et al. (1966) suggested that the softening of the material occurs entirely in the rubber matrix, because stress-softening is also observed in unfilled rubbers. Nevertheless, no efficient, i.e. pre-cise and numerically simple, physical-based consti-tutive equation exits. Recently, Marckmann et al. (2002) proposed a new constitutive equation (denot-ed M model through the rest of the paper) that de-scribes the evolution of the network considering the rupture of links between polymer chains. The in-crease of chain length and the dein-crease of the num-ber of chains reflect this evolution by volume unit as functions of the maximum deformation previously endured by the material. This approach is introduced in the eight-chain model of Arruda and Boyce (1993): sinh ln N N C W chain r (1) with
chain/ N
1 L (2) where L is the Langevin function. Cr and N are thematerial parameters which respectively represents the density of chains per unit of volume and the number of monomers per chain. To describe stress-softening, material parameters depends on the max-imum deformation. Using experimental results, au-thors show that the evolution of material parameters can be driven by exponential functions: a decreasing one for the number of chains per unit of volume and an increasing one for the number of monomers per chains.
Mullins and Tobin (1957) have proposed a model based on the two-phase theory. They consider that the material contains soft and hard rubber phases. Under loading, hard rubber is transformed into soft rubber. The evolution of the ratio between phases is supposed to depend on the maximum deformation. Johnson and Beatty (1993) used this approach to model uniaxial tensile tests, by using an accommo-dation function to reproduce loss of stiffness. The form of this function evolved during years and the last proposal is due to Zuñiga and Beatty (2002) who proposed the following strain energy function W (denoted ZB model in the following):
m,M
W0F
W (3)
where W0 is a classical hyperelastic strain energy
function and the accommodation function F is given by:
m M
b M m
F , exp (4)
where b is a material parameter, and m and M repre-sent measures of deformation, expressed thanks to the strain invariants :
2 2 1 2I I m and M m
s t s 0 max (5)Stress-softening is here described by the difference between the current state and the maximum de-formed state previously endured by the material.
The continuum damage mechanics has often been used to model the Mullins effect even if this phe-nomenon is not a strictly speaking damage phenom-enon. For example, it can be recovered with time and annealing accelerates this recovery. A thermodynam-ic variable D is introduced to represent stress-softening. The general theory of damage mechanics was introduced by Lemaitre and Chaboche (1990). As applied to hyperelasticity, it yields to:
1 D
W0W (6)
Recently, Chagnon et al. (2003, subm.) developed a damage mechanics approach (denoted C model in the following) and established the evolution equation of the damage variable thanks to second loading curves. It is expressed thanks to the first strain invar-iant and presents an exponential form:
max 1 exp 1 I D D (7)
where D and are material parameters. This model
is similar to the discontinuous damage part of the constitutive equation proposed by Miehe (1995). The major difference is the choice of the damage criteri-on. Here this criterion is given as a function of the deformation state whereas Miehe used the strain en-ergy density as a measure.
The three models described above, were devel-oped using different approaches. They are now com-pared in the two next sections of the paper.
3 SIMPLE LOADING SOLUTIONS
The three previous models are studied using experi-mental data that correspond with a carbon-black filled rubber. Their material parameters will be de-termined by fitting uniaxial tensile and pure shear experiments.
First, it is to note that there is a major difference between the two-phase approach (ZB model) and the two other ones. The M and C models accumulate softening during the loading process, and the ZB stress-softening function evolves during unloading. This approach simplifies the identification task, be-cause the two parts of the model, the hyperelastic strain energy and the stress-softening function, are independent and can be fitted separately. Neverthe-less, it is difficult to explain physically the evolution of the stress-softening function during the unloading part of cycles.
The C and ZB models impose the choice of a strain energy function because it is not explicitly in-corporated in the models. It is important to choose a density that can describe the whole behaviour of the material (small and large strain) but with few param-eters (to simplify the identification task).
For the ZB model, every strain energy functions can be chosen, due to the formulation simplicity em-phasised above. The model proposed by Hart-Smith (1966) has only three parameters and is able to de-scribe the whole behaviour:
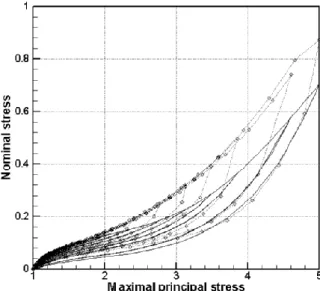
exp 3 1 2 2 3 2 1 3 1 C I dI C I C W (8)The first term of Equation 8 describes the whole be-haviour of the rubber, and the second term improves the results at moderate strain. Thus, it can be omitted to simulate the whole behaviour. A simulation of uniaxial tests is presented in Figures 2 and 3.
The problem is quite different for the C model as the damage variable evolves during the loading part
Figure 2. Uniaxial tensile results: () ZB model, (…) experi-mental data.
Figure 3. Pure shear results: () ZB model, (…) experimental data.
of the first cycle. Then, the first loading curve is de-scribed by both the hyperelastic behaviour and the damage function. It is important to choose a strain energy function that is compatible with the damage evolution law. Energy densities with important hard-ening cause abnormal curvatures of the model; then, a regular form of W0 must be selected. The energy
density proposed by Yeoh (1990) is chosen:
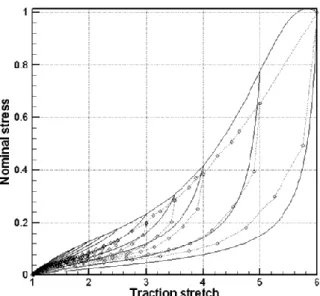
3 1 30 2 1 20 1 10 0 C I 3 C I 3 C I 3 W (8)The corresponding simple results are presented in Figures 4 and 5.
The M model basically includes a given strain en-ergy function. Due to network changes, material pa-rameters evolve during the loading part of the first cycle. As a consequence, this first loading curve cannot be fitted independently. In fact, the evolution of material parameters of this model with defor-mation leads to a better simulation of the first load-ing curve (Meissner, 2000). Simulation results ob-tained with the M model are presented in Figures 6 and 7.
Figure 4. Uniaxial tensile results: () C model, (…) experi-mental data.
Figure 5. Pure shear results: () C model, (…) experimental data.
Figure 6. Uniaxial tensile results: () M model, (…) experi-mental data.
Figure 7. Pure shear results: () M model, (…) experimental data.
Figures 2 to 6 show that models have different characteristics. Due to its multiplicative form, the C model second loading curves are proportional. This makes difficult the description of the curvature of the second loading paths. In fact, this kind of model-ling cannot take into account the strain-hardening phenomenon that takes place as secondary curves in-tersect the first loading curve. Second loading curves corresponding with the C model are too smooth. The two others models do not present this difficulty. The M model being based on the eight-chain model hy-perelastic constitutive equation, it simulates correct-ly the strain-hardening. The ZB approach (associated with the Hart-Smith strain energy function) can sat-isfactorily describe strain-hardening thanks to the exponential function. However, it appears that the initial stiffness of loading curves decreases as the strain-hardening is more important. As a conse-quence, a good description of hardening reduces too
importantly the initial slope of second loading curves.
The M model is revealed to be the most efficient to describe the Mullins effect. Nevertheless, it is lim-ited by its formulation: it is written in terms of prin-cipal strain instead of strain invariants. The fifth or-der Taylor development of the eight-chains model can be used to overcome this difficulty, but it is not well-adapted to the description of the Mullins effect, the use of the Langevin function being fundamental in the approach proposed by Marckmann et al. (2002).
4 NUMERICAL IMPLEMENTATION
The three previous constitutive equations were im-plemented in the finite element software Abaqus, thanks to the UMAT facility. The implementation necessitates the computation of both Eulerian stress-es and the updated Lagrangian elasticity tensor.
The Arruda-Boyce eight-chain model is already implemented in Abaqus, under its Taylor develop-ment of the first strain invariant. This avoids diffi-culties induced by the use of principal strains instead of strain invariants. Nevertheless, as shown above, the M model necessitates the use of the original eight-chain model, because the strain-hardening must be well-described. The inverse of the Langevin function generates numerical instabilities and con-vergence difficulties at large strain. Finally, this model is very efficient in for analytical problems un-der simple strain states, but it cannot be used in fi-nite element applications.
The C and ZB models being written in terms of strain invariants, their numerical implementations are easy and the convergence is easier to ensure. Due to its form, the C model can be used for very large range of calculations. The ZB model exhibits some difficulties mainly due to the choice of the strain measure (Equation 5). The square function leads to the occurrence of a vertical tangent. It is similar to the difficulties evoked above for the Langevin func-tion. A simple method to overcome this difficulty is the change of the strain measure.
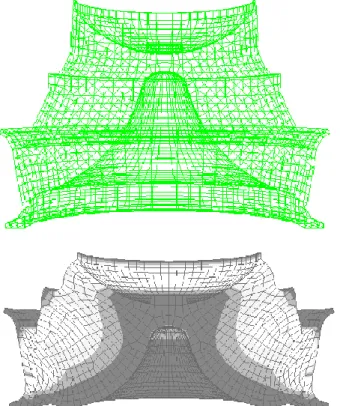
Results qualities of these models are similar to those obtained for simple problems. Let us recall that the M and ZB models cannot converge for very large strain. In the convergence range of the three models, they are able to describe the local loss of stiffness of the material and the non-homogeneity of the struc-ture after a first stretching. An example is given in Figure 8 for an engine mount submitted to compres-sive loading. Results are given for the C model. It appears that the stress-softening level is quite differ-ent in the part, i.e. some zones are not damaged
Figure 8. Damage level in an engine mount after a compressive loading (maximum damage zone : 25%).
Figure 9. Force-displacement response of the engine mount.
and others zones are 25% damaged. However, the global response of the mount was not changed after this loading (see Figure 9). This example highlights the importance of considering the Mullins effect in the constitutive equation: even it is overall unim-portant, it is fundamental to consider it in high-stressed parts of structures.
5 CONCLUSION
The three models studied in this paper have both ad-vantages and limitations. For simple loading prob-lems, the M model is the more efficient since it per-mits correct description of the form of the second
loading curves, especially strain-hardening. Howev-er, in order to use a finite element code, formulations in terms of strain invariants with regular functions leads to a better convergence. In this way, even if the damage C model exhibits worse results for simple problems than the two other models, its formulation is well-adapted to numerical applications. At our opinion, the ZB model could give such good results by using another strain measure. Its advantage com-pared with the C model is its ability to describe an important loss of stiffness. Then, it can be used to evaluate the energy dissipated between the two first loading cycles, but it cannot satisfactorily describe initial slopes of secondary stress-strain curves.
REFERENCES
Arruda, E. M. & Boyce, M.C. 1993. A three dimensional con-stitutive model for the large stretch behavior of rubber elas-tic materials. J. Mech. Phys. Solids 41, 389-412.
Bueche, F. 1960. Molecular basis for the Mullins effect. J. Appl. Polym. Sci. 3, 107-114.
Bueche, F. 1961. Mullins effect and rubber filler interaction. J. Appl. Polym. Sci. 5, 271-281.
Chagnon, G. Verron, E. Gornet, L. Marckmann, G. & Charrier, P. 2003. On the relevance of continuum damage mechanics as applied to the Mullins. J. Mech. Phys. Solids (submitted). Hart-Smith, L. J. 1966. Elasticity parameters for finite defor-mations of rubber-like materials. Z. angew. Math. Phys. 17, 608-626.
Harwood, J.A.C. & Payne A. R., 1966. Stress softening in nat-ural rubber vulcanizates. Part 3. Carbon black filled vulcan-izates. J. Appl. Polym. Sci. 10, 315.
Harwood, J.A.C. & Payne A. R., 1966. Stress softening in nat-ural rubber vulcanizates. Part 4. Unfilled vulcanizates. J. Appl. Polym. Sci. 10, 1203-1211.
Johnson, M. A. & Beatty, M. F. 1993. The Mullins effect in uniaxial extension and its influence on transverse vibration of rubber string. Continuum Mech. Thermodyn.5, 83-115. Lemaitre, J. & Chaboche, J. L. 1990. Mechanics of solid
mate-rials, Cambridge University Press.
Marckmann, G. Verron, E. Gornet, L. Chagnon, G. Charrier, P. & Fort, P. 2002. A theory of network alteration for the Mullins effect. J. Mech. Phys. Solids 50, 2011-2028. Meissner, B. 2000. Tensile stress-strain behaviour of rubber
like networks up to break. Theory and experimental com-parison. Polymer 41, 7827-7841.
Miehe, C. 1995. Discontinuous and continuous damage evolu-tion in Ogden type large strain elastic materials. Eur. J. Mech., A/Solids 14, 697-720.
Mullins, L. 1969. Softening of rubber by deformation. Rubber Chem. Technol. 42, 339-362.
Mullins, L. & Tobin, N. R. 1957. Theoretical model for the elastic behavior of filler-reinforced vulcanized rubbers. Rubber Chem. Technol. 30, 551-571.
Yeoh, O.H. 1990. Characterization of elastic properties of car-bon black filled rubber vulcanizates. Rubber Chem. Tech-nol. 63, 792-805.
Zuniga, A. E. & Beatty, M. F. 2002. A new phenomenological model for stress-softening in elastomers. Z. angew. Math. Phys. 53, 794-814.