HAL Id: hal-01688412
https://hal.archives-ouvertes.fr/hal-01688412
Submitted on 20 Nov 2018
HAL is a multi-disciplinary open access
archive for the deposit and dissemination of
sci-entific research documents, whether they are
pub-lished or not. The documents may come from
teaching and research institutions in France or
abroad, or from public or private research centers.
L’archive ouverte pluridisciplinaire HAL, est
destinée au dépôt et à la diffusion de documents
scientifiques de niveau recherche, publiés ou non,
émanant des établissements d’enseignement et de
recherche français ou étrangers, des laboratoires
publics ou privés.
Study of the interaction polybutadiene/fillers using
inverse gas chromatography
Rachel Calvet, Sylvie del Confetto, Henri Balard, Eric Brendle, Jean-Baptiste
Donnet
To cite this version:
Rachel Calvet, Sylvie del Confetto, Henri Balard, Eric Brendle, Jean-Baptiste Donnet. Study of the
interaction polybutadiene/fillers using inverse gas chromatography. Journal of Chromatography A,
Elsevier, 2012, 1253, pp.164-170. �10.1016/j.chroma.2012.07.002�. �hal-01688412�
Study of the interaction polybutadiene/fillers using inverse gas chromatography
Rachel Calvet
a,∗, Sylvie Del Confetto
a, Henri Balard
b,c, Eric Brendlé
c, Jean-Baptiste Donnet
baUniversité de Toulouse, Mines Albi, CNRS, Centre RAPSODEE, Campus Jarlard, F-81013 Albi Cedex 09, France bENSCMu/ENSISA, 11 rue A. Werner, 68200 Mulhouse, France
cADSCIENTIS SARL, 10 rue A. Kastler, 68280 Wittelsheim, France
Keywords: Polybutadiene Carbon blacks Fillers
Inverse gas chromatography
a b s t r a c t
In this study, the coupling of IGC-ID analysis and carbon blacks impregnation with increasing ratios of polymer allow us to highlight the affinity of the polymer to the solid surface. The variations of the dispersive component of the surface energy and of the nanomorphology index are monitored versus the degree of carbon black impregnation. A clear correlation between the decrease in the dispersive component of the surface energy and the increase in the nanomorphological index is observed. The PBu macromolecules shield progressively the slot shaped sites on the carbon blacks surface. IGC reveals clear differences in surface properties between CB of different grades.
1. Introduction
The reinforcing properties of carbon blacks are closely related to the interaction polymer/carbon black surface but also to the fractal nature of the particulate filler aggregates[1,2]and filler network-ing[3,4]. So, a special attention was also given to gain insight into the relationship between disordered filler structures with different length scales and specific microscopic effects contributing to car-bon black reinforcement[5,6]. An improved understanding of the particulate mechanisms of reinforcement is relevant in material science[7].
Beside these well-investigated morphological effects, the sur-face activity of carbon blacks plays a key role in reinforcement of elastomers by controlling the polymer–filler phase bonding and the filler–filler interaction[2]. Despite this importance of the sur-face activity, reinforcing fillers are characterised mainly by their specific surface area related to the mean particle size and by their DBP number (adsorption of dibutyl phthalate) which is bound to the aggregate structure. Hence the surface activity of CBs cannot yet be assessed by any standard molecular parameter[2].
Many efforts were made to judge the level of the surface activ-ity of carbon blacks. The first one was made, in particular, on measurements done by IGC in infinite dilution conditions[8–12]. Lansiger and Donnet[8,12]have revealed a relationship between the dispersive component of surface energy assessed by IGC-ID and the reinforcing properties of some carbon blacks, the higher the
∗ Corresponding author. Tel.: +33 563493064; fax: +33 563493025. E-mail address:[email protected](R. Calvet).
dispersive component, the higher the reinforcing effect. But IGC-ID analysis mainly reflects the sites having the highest energies[13], and so, delivers no quantitative information concerning the number of these latter adsorption sites.
To gain a further understanding, many investigators have employed adsorption isotherm measurement using nitrogen[14] and ethene[15]or IGC at finite concentration conditions[10,16,17]. They have then assessed the carbon black surface heterogeneity in terms of distribution functions of the adsorption energies. How-ever, due to the variability of the type and origin of the carbon black samples, the nature of the adsorbate, but also of the com-puting method, it is difficult to extract a clear conclusion from this last data. Nevertheless, a trend is observed, the higher the specific surface area, the higher the number of sites with a high level of energy, as noted by Schröder et al. who observed that the N115 sample presents more energetic sites than samples exhibiting a lower specific surface area like the N550. Hence, adsorption analyt-ical methods suggest that carbon blacks presenting a high energetic surface are the most efficient as regards the reinforcing power.
Surface heterogeneity can be evaluated not only in terms of sur-face activity, but is also dependent on their sursur-face geometry as shown by Vilgis and Heinrich[18]and this plays an important role in the interaction of a macromolecule with a solid surface.
Upon adsorption on a surface, a polymer chain loses conforma-tional entropy and this loss will be more important on a smooth surface than on a rough one because on the former, the polymer chain has to stretch out and accordingly its entropy loss is high, whereas on the latter the polymer chain can curve into the rough surface leading to lower entropy loss. Numerous investigations of the surface roughness of carbon black have been carried out with
Fig. 1. Variation of the free energies of adsorption of the probes with their topological indexes, Xt[39]: relation with some experimental chromatograms and principle of
the determination of main IGC-ID parameters, !GCH2
a and !GMa.
different techniques like gas adsorption[19–25], small angle X-ray and neutron scattering (SAXS and SANS)[26–28]or atomic force or scanning tunnel microscopy (AFM and STM)[29,30]. Based on these last techniques, Donnet and Custodero have proposed that the carbon black surface is covered by “fish scale” like structures corresponding to surface graphitic domains. The results are con-tradictory and range from nearly smooth carbon black particle surfaces to very rough surfaces, even with the same techniques.
It is worth pointing out that all the adsorption measurements were performed using small molecular probes[8–12], which are far from an actual macromolecular chain as regards both the func-tionality and the conformation.
Recently, it was demonstrated for talc and silica that coupling of IGC-ID analysis and progressive polymer impregnation permits a titration of the sites to which the polymer chains have access and so quantifies the affinity of a polymer to the solid surface[31,35–37]. Using this new approach, the surface is probed with a macro-molecule and small macro-molecules (IGC probes: alkanes and branched or cyclic alkanes), which delivers information on the interaction level between the polymer and the surface through the dispersive com-ponent of the surface energy and the surface morphology (index of nanomorphology).
In the present work, the same approach was applied to examine the interaction between a polybutadiene (PBu) and a set of carbon black samples. The variations of the dispersive component of the surface energy and of the nanomorphology index were monitored versus the degree of impregnation.
2. IGC-ID theory
Inverse gas chromatography (IGC) is a useful method for study-ing the surface properties of finely divided solids[13,41]. It is based on the injection of molecules of a known nature, called probes, into a column packed with a solid to be tested. The present study has been carried out at infinite dilution (IGC-ID).
The net retention volume of the probe (Vn) is recorded which
reflects the level of interaction between the solid surface and the isolated probe[38]. The free energy of adsorption of the probe is directly related to the retention volume and to the net retention time by the following equation.
!Ga0= −RT Ln(Vn) + C = −RT Ln
!
J × Dm×TTc a× "(Tc) "(Ta) ×tr"
+ C (1)where J is the James Martin coefficient, which takes into account the compressibility of the carrier gas, Dmthe measured flow rate
with an electronic flow metre, Tcand Tathe column and the room
temperatures, "(T) the gas carrier viscosity, trthe net retention time
of the probe and C a constant depending on a reference state. Fig. 1 describes the principle of the determination of main parameters, !GCH2
a and !GMa that can be acquired through IGC-ID
technique and relates respectively to the non-specific interaction and the surface morphology of the solid surface.
The n-alkane line is obtained by plotting the free adsorption energy versus the number of carbon atoms of the injected alkane probes, its slope corresponds to the increment of free energy per methylene groups (!GCH2
a ) as depicted in Fig. 1. From this
parameter, the dispersive component of the surface energy was determined using the Dorris and Gray approach[40]. The disper-sive component of the surface energy (#d
s) can be readily calculated
according to the following equation.
#d s = (!GCH2 a ) 2 4N2a2 CH2#CH2 (2)
where N is Avogadro’s number, aCH2 is the area covered by one
methylene group (0.06 nm2), and #
CH2 is the surface energy of
pure methylene group surface, i.e., polyethylene, #CH2= 35.6 +
0.058(293 − T), in mJ/m2(T the temperature in K).
The parameter #d
s is directly related to the surface
polarisabil-ity of the solid surface[13]. Of course, probes other than the linear apolar n-alkanes may be used to assess the interaction potential of a solid surface. Among these probes, branched or cyclic isomers of the n-alkanes that can only exchange non-specific interaction like linear ones, are of a main interest for testing the surface mor-phology at a molecular scale. In particular, Brendle and Papirer[39] have shown that such isomers exhibit much lower retention times than the corresponding linear alkanes for solids having a lamellar structure such as crystalline silicas[41]or talc[42]. This difference of behaviour between linear and branched cyclic alkane probes was attributed to the fact that linear probes have access to the slot like adsorption sites present on the lateral surfaces of these lamellar solids whereas branched or cyclic alkanes are excluded for steric effect and so exhibit a much lower energy of interaction. These slot like sites are the result of a lack of one crystalline plane leading to a slot having a dimension of about twice the interplanar distance that means a nanometric or subnanometric dimension.
Of course, the size exclusion effect is closely related to both the molecular shape of the probe and the surface morphology. In order
Table 1
Main characteristics of the studied carbon blacks.
Carbon blacks BET N2area
(m2/g) Mean particlesize (nm) CTAB area(m2/g) Iodide adsorption(mg/g) DBP adsorption(ml/100 g)
N539 41 ∼50 41 42 112
N330 82 ∼30 83 84 100
N326 85 ∼27 81 84 69
N347 90 ∼30 88 91 125
N115 140 ∼18 128 145 113
to take into account the shape and structure influence, brendle and Papirer[39]have put forward some topology indexes Xt. The size
exclusion effect leads to a decrease in the free energy of adsorption when comparing it with that of a virtual linear alkane having the same topological index (Xt) as depicted inFig. 1and leads to a
decre-ment of free energy −!GM
a. Balard et al.[13]suggested an index of
surface nanomorphology, according to the following equation: IM(Xt) = exp
#
−!GMa RT$
(3)when IM(Xt) is equal to 1, that means −!GMa is equal or near zero,
the linear and branched or cyclic probes have access to the same surface, the solid surface can be considered flat at the molecular level, for example for some fumed silicas[41]. An IM(Xt) lower than
1 is the result of a size exclusion phenomena between linear and branched or cyclic probes due to a rough surface, it occurs with solids like talc. When the IMovercomes 1, a thick layer of polymer
is deposited on the solid surface and an absorption of the probe into this layer occurs[31].
3. Experimental part 3.1. Carbon blacks
For the present work, five carbon blacks from the Continental Carbon Company (Texas, USA), were selected. Their main char-acteristics are reported inTable 1. The specific surface area was measured with nitrogen gas using an ASAP 2000 instrument from Micromeritics according to the ASTM standard procedure (ASTM D 3037)[32]. The CTAB (cetyltrimethylammonium bromide) surface area, the iodide and the DBP (dibutyl phthalate) adsorption val-ues were determined according to the ASTM standard procedures (ASTM D 3765 and ASTM D 1510)[33,34].
3.2. Impregnation protocol
The impregnation of carbon black were mainly done using a polybutadiene from Sigma Aldrich (Mw = 40,000 g/mol).
A polybutadiene solution having a known concentration in dichloromethane was prepared. A given amount of carbon black was dispersed in 25 ml of the same solvent. By adding increasing volumes of the PBu solution to these carbon black dispersions, a large scale of impregnation ratios ($ expressed in mg/g) could be examined. After the complete evaporation of the solvent, IGC columns were filled with the PBu impregnated carbon black and conditioned at 120◦C. This impregnation protocol is well described
in previous studies[31,35–37].
From the $ values, the coverage ratios (nMU) of the surface in
terms of monomer units per square nanometer (MU/nm2) were
computed according to the following equation: nMU= $ N
1000 × MMUS × 1018 = $
602.3
MMUS (4)
where N is the Avogadro number, MMUthe Bu monomer unit
molec-ular weight (54 g/mol) and S the specific surface area of the studied solid measured with nitrogen, $ is given in mg/g or ‰.
The monomer unit molecular area (aMUin nm2) was assessed
according to Eq.(5)from the molecular volume of the monomer unit, computed from the polymer bulk density (d in g/cm3) and the
monomer unit molecular weight (MMUin g/mol), considering that
one monomer unit is a cube:
aMU= k
!
MMUd × 602.3
"
2/3(5)
where d is equal to 0.95 g/cm3for PBu.
Using this method, the molecular area (aMU) is generally
under-estimated of about 20%, so the value of k was fixed to 1.2.
Knowing the MU surface area (aMU) in nm2, the theoretical
number of monomer unit per square nanometer of carbon black necessary to form a “so called” monomer unit monolayer could be computed, according to the following equation:
NMU= a1
MU (6)
According to Eqs.(5) and (6), the values of both MU molecu-lar area (aMU) and the MU number per nm2 for the monolayer
formation (NMU) are equal respectively to 0.25 nm2 and 4.0 for
PBu. This approach delivers a rough approximation of the area occupied by a MU on the solid surface, because the MUs are linked in the macromolecule, they are not independent enti-ties like the nitrogen molecule in the case of BET specific area measurement.
3.3. Experimental IGC conditions
The agglomerated impregnated carbon black powder was gently crushed and sieved. Particles having diameter comprised between 200 and 400 !m were retained. The powder was poured into stainless steel columns, 10 cm long and 2 mm internal diameter, which were gently taped in order to obtain a regular filling. Hence, chromatographic beds were prepared, having a convenient perme-ability corresponding to a pressure drop lower than 50 kPa with a flow rate of the carrier gas of about 30 ml/min.
Two Agilent 6890 gas chromatographs, each fitted with two flame ionisation detectors (FIDs), were used with helium car-rier gas. The injector and detector were heated to 180◦C. All
the columns were conditioned overnight at 120◦C and the
analyses made at 150◦C. Net retention times were calculated
by subtracting the retention time of a non-retained molecule, methane, from the retention times of the probes. Selected IGC probes – n-alkanes and cycloalkane – are purum products from Aldrich–Sigma.
Fig. 2. Variation of the dispersive component (#d
s) of PBu impregnated carbon blacks
of N326, N330 and N347 grades, with the MU coverage ratio (nUM). The black arrow
indicates the theoretical value for the MU monolayer.
4. Results
4.1. Coupling of PBu controlled impregnation and IGC-ID analysis for N326, N330 and N347 carbon black grades
4.1.1. Variation of the dispersive component of the surface energy with the impregnation ratio
Firstly, three carbon black grades, N326, N330 and N347, were examined. These samples have the same mean particle size or spe-cific surface area but differ in their structure as measured by DBP adsorption.
The variation of the dispersive component of the surface energy (#d
s) of these PBu impregnated carbon blacks with the MU coverage
ratio expressed in number of MU per surface unit (nUM), is depicted
inFig. 2.
Three main conclusions have to be given on the variation of the dispersive component with the MU coverage ratio:
1) The #d
s values corresponding to the initial unmodified samples
differ only slightly between the 3 different carbon blacks, around 160 mJ/m2.
2) For the impregnated samples, the variation of #d
s follows
the same trend for the 3 studied samples and decreases monotonously until the MU deposited covers the whole of the carbon black surface, when nUM(equal to 5 MU/nm2) exceeds
20% of the theoretical value (4 MU/nm2). Hence it has been
showed that the PBu adsorbs at first on the more energetic sites. 3) Beyond this threshold, #d
s becomes constant and equal to about
30 mJ/m2, a value characteristic of an apolar polymer surface
formed by the PBu layer.
In other words, the deposited PBu shields progressively the sites of adsorption, in which alkane probes could be inserted. This effect could be also quantified using the index of nanomorphology. 4.1.2. Variation of the index of nanomorphology with the impregnation ratio
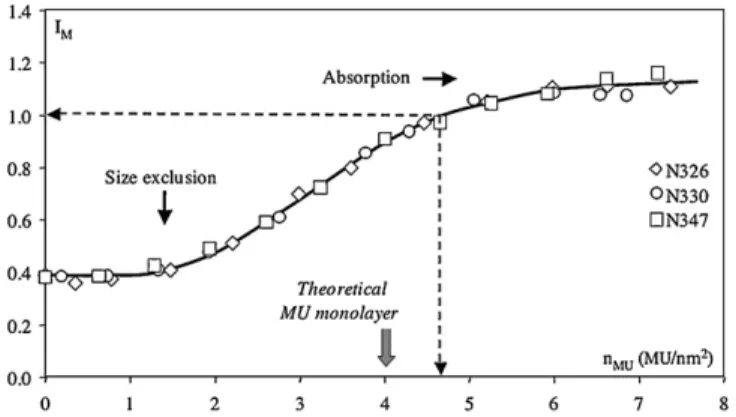
The variation of the index of nanomorphology (IM) measured
with cyclooctane probe, of PBu impregnated carbon blacks of N326, N330 and N347 grades, with the MU coverage ratio expressed in number of MU per surface unit (nUM), is depicted inFig. 3.
Here, four main conclusions have to be done on the variation of the index of nanomorphology with the MU coverage ratio: 1) The IMvalues, corresponding to the initial unmodified samples
are equal to 0.4, proving the presence of numerous insertion sites at the edge of the graphitic structures.
Fig. 3. Variation of the index of surface morphology (IM) of PBu impregnated carbon
blacks of N326, N330 and N347 grades, with the MU coverage ratio (nUM).
2) For the impregnated samples, a “S” shaped variation is observed for the 3 samples studied with the MU coverage ratio, proving again that these samples exhibit nearly identical surface struc-tures.
3) Two thresholds are registered, around 1.5 MU/nm2 and
5.5 MU/nm2. Obviously the second threshold is related to the
formation of the continuous PBu layer. The first threshold shows that about 27% of the total surface corresponds to similar strong interacting sites presenting the same geometry, responsible of the size exclusion effect. Below 1.5 MU/nm2, the IMremains very
low indicating that the linear alkanes have access to sites where the cyclooctane is excluded due to steric encumbrance. 4) The index of morphology IMovercomes a value of 1 MU/nm2
slightly before the number necessary to form a continuous PBu layer and reaches a value close to 1.2 for 7 MU/nm2, showing
preferential absorption of the cyclic probe, in comparison with linear ones. This preferential absorption starts to take place in the PBu film present at the surface.
Though the study of the variation of the index of morphol-ogy with the MU coverage ratio corroborates and completes the assumption deduced from the variation of the #d
s values, it also
shows that the PBu at first starts to adsorb and shield the sites hav-ing the highest energy, and in which linear alkane can be inserted, and thereafter covers progressively the less energetic sites until all of the carbon black surface will be covered by the MU.
We will now examine how the grade of the carbon black studied will influence the variations of these two parameters, #d
s and IM,
with the increase of the MU coverage ratio.
4.2. IGC-ID analysis of PBu impregnated N115, N330 and N539 carbon blacks
4.2.1. Variation of the dispersive component of the surface energy with the impregnation ratio
In the second part of the study, the carbon blacks examined, N115, N330 and N539, differ in mean particles size and specific sur-face area ranging for example with nitrogen from to 41 to 140 m2/g.
The variation of the dispersive component of the surface energy (#d
s) of these PBu impregnated carbon blacks, with the MU coverage
ratio, expressed in number of MU per surface unit (nUM), is depicted
inFig. 4.
It immediately appears that N539 sample behaves like the N330 one as regards to the variation of #d
swith the MU coverage ratio. On
the contrary, the initial N115 carbon black exhibits a much higher #d
s value than the others studied samples. Moreover the #sdof the
impregnated sample then decreases rapidly. Thereafter, it behaves like the other grades. Beyond 5 MU/nm2, the dispersive surface
168 R. Calvet et al. / J. Chromatogr. A 1253 (2012) 164–170
Fig. 4. Variation of the dispersive component of the surface energy (#d s) of PBu
impregnated carbon blacks of N115, N330 and N539 grades, with the MU coverage ratio (nUM).
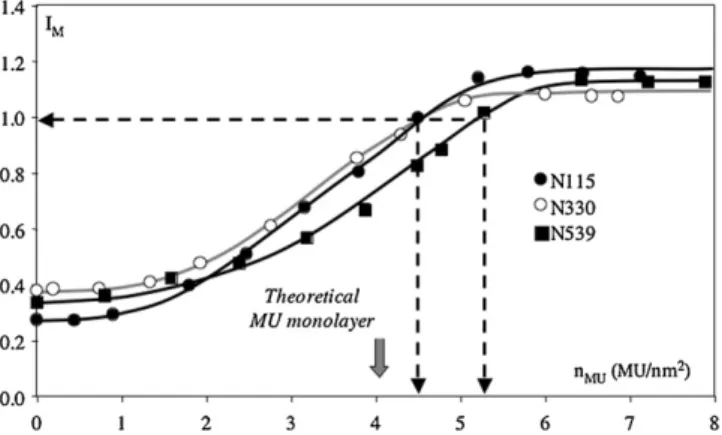
Fig. 5. Variation of the index of surface morphology (IM) of PBu impregnated carbon
blacks of N115, N330 and N539 grades, with the MU coverage ratio (nUM).
variation of the index of nanomorphology with the MU coverage ratio.
4.2.2. Variation of the index of nanomorphology with the impregnation ratio of N115, N330 and N539 samples
The variation of the index of nanomorphology (IM) measured
with a cyclooctane probe of PBu impregnated carbon blacks of N115, N330 and N539 grades, with the MU coverage ratio, expressed in number of MU per surface unit (nUM), is depicted in
Fig. 5.
Considering the initial samples, it is observed that N539 and N330 samples show very close IM values, whereas N115 sample
exhibits a lower value. PBu impregnation induces a similar “S” shaped variation for the three samples, but they do not follow the same trend.
Fig. 7. Variations of both #d
s and IM parameters with the impregnation ratio,
observed for the N115 sample.
We have observed that the N330 and N539 samples behaves almost identically so long the MU coverage is lower 2 MU/nm2,
thereafter they differ completely, the N539 showing a slower vari-ation whereas the N330 now follows the same trend as the N115 sample. For the latter, the IMvalue remains quite constant up to a
coverage ratio of 1 MU/nm2and then increases quickly joining the
curve of the N330 sample.
Hence both trends of the dispersive component of the surface energy and of the index of nanomorphology testify that the surface structure of these three samples differs by their capacity of interac-tion and their surface geometry. An interpretainterac-tion has to be found considering the surface model structures proposed for the carbon black surface and will be discussed now.
5. Discussion
We will first consider two models which were previously pro-posed in the literature and depicted inFig. 6A and B.
The Donnet and Custodero model (Fig. 6A), based on STM obser-vation, proposed a fish-like scale structure former by the graphitic domains, but gives no assumption about the structures existing at the edge of these “fish scales”.
On the other hand, the Schuster et al. model (Fig. 6B), mainly from the distribution functions of the adsorption energies of ethene, suggested the existence of four types of adsorption sites bound to, (1) graphitic planes, (2) amorphous carbon, (3) crystallite edges and (4) slit shaped cavities.
The three first types of adsorption sites cannot be at the origin of any important exclusion size phenomena of the cyclooctane probe. Only the slit shaped sites could be at the origin of any size exclusion effect, but such default could not be observed by the STM.
Moreover, neither the Donnet and Custodero’s nor the Schus-ter’s model allows us to predict the correlation existing between the variation of both #d
s and IM parameters with the PBu
Fig. 6. Schematic representations of the carbon black surface topology according to Donnet and Custodero[29,30], on left, and Schuster and al.[15], on right. (1) Graphitic planes, (2) amorphous carbon, (3) crystallite edges and (4) slit shaped cavities.
Fig. 8. Schematic representation of the insertion size of linear alkanes for layered solids (A) like talc or graphite and for a “fish scale” structure (B) present on the carbon black surface.
impregnation ratio as it is observed, for example, for example in the N115 sample, as shown inFig. 7.
In particular, the previous models do not allow us to explain the fact that there is a decrease in the value of #d
swhereas the IMvalue
remains weak and quite constant, increasing only slowly from 0.3 to 0.4 values.
We will come back to previous studies led on crystalline silicas [41], talcs[31,36,37]and graphites[42]. These solids exhibit high #d s
and low IMvalues. In order to explain such size exclusion effect of
cyclic alkanes, it was suggested that the linear alkanes might enter in the slot shaped sites present on the crystalline lateral surfaces due to gaps left by missing crystal plane, as drawn inFig. 8A, on the left.
Depositing PEG on the talc surface, Comard and al.[31,37]had observed a very similar variation of both #d
sand IMparameters with
the PEG impregnation ratio than that shown for the N115 sample for the PBU progressive impregnation.
Such variation could only be explained when one admits that the flexible and polar PEG chain will be absorbed at first on the lateral surfaces of the talc crystallite, shielding progressively the slot shaped site, hindering the insertion of linear alkane, inducing a rapid decrease of the #d
svalue, which starts immediately at the first
stage of impregnation process. Correspondingly, as long as the slot shaped insertion sites remain accessible, the IMparameter remains
almost equal to the initial value measured on the unmodified talc. Once, these sites are completely hidden, the IMparameter start to
increase until the entire surface is covered by a continuous polymer layer.
The same process will allow us to explain the variation of the carbon black surface under the controlled PBu impregnation due to the progressive shielding of the slot like sites present on the lateral surfaces of the graphitic structures.
Now a question is raised, how to explain that the N115 sample behaves very differently from the N330 and N539. The answer could be found when considering the variations in the surface roughness assessed by comparing surface areas obtained with CTAB (SCTAB),
nitrogen (SN2) or the iodide adsorption number NI2. It has been
observed that under a specific surface area[43], the SCTABand NI2
are very close, but over this threshold SCTABbecomes clearly lower
than NI2, indicating an increase of the surface roughness.
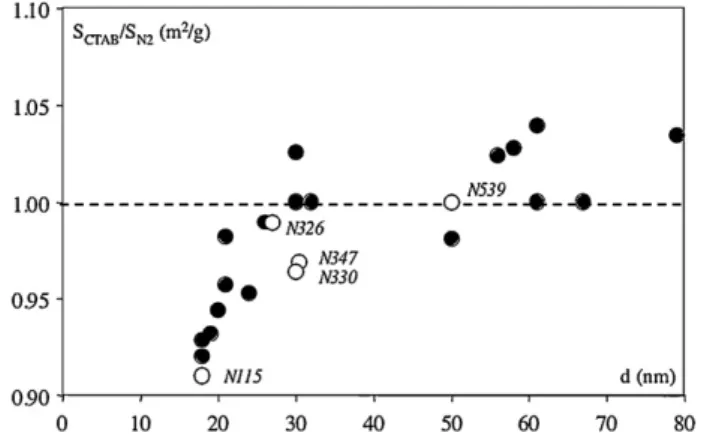
Moreover, when considering the variation in the SCTAB/SN2ratio,
versus the mean diameter of the primary particle assessed by TEM, one can see this ratio increases quickly for carbon blacks that have a particle diameter lower than 30 nm. Over this critical value, it remains quite constant and overcomes slightly 1 as depicted in Fig. 9.
Hence, the differences in behaviour observed between the N115 CB and the other samples have to be attributed to their differences in surface roughness. This surface roughness originates from the temperature of the formation of the CB. The N115 CB is formed at a higher temperature than the N330 and, of course the N539[43,44]. At this temperature, the graphitic domains present on the surface would be more organised leading to an increase of the number of slot shaped sites on the edges of the graphitic scales and so, leading
Fig. 9. Variation CTAB/nitrogen specific surface areas ratio with the mean diameter (d) of the carbon blacks primary particles. Open circles correspond to our carbon blacks samples, closed circles are extracted from literature data[43].
to high energetic adsorption sites of the n-alkanes and correspond-ingly a more intensive exclusion size phenomenon of cyclooctane as depicted inFig. 8B above. At a lower temperature of formation, the organisation degree of the graphitic crystallites becomes much lower, and both insertion and exclusion phenomena become less important.
This interpretation is also supported by the fact that the vari-ations of the IGC-ID parameters depend on the nature of both the polymer and the solid. Influence of the nature of the adsorbed poly-mer was clearly demonstrated by Comard et al.[36]in the case of talc as adsorbant.
6. Conclusion
In conclusion, monitoring the variation of the dispersive com-ponent of the surface energy (#d
s) and the index of nanomorphology
(IM), is an excellent method to follow the variations in the surface
properties of CB impregnated with increasing ratios of PBu. It has been observed that there is a clear correlation between the decrease in the #d
s and the increase in the IM.
This variation is due to the fact that the flexible, and not very polar, PBu chain will adsorb at first on the lateral surfaces of the graphitic domains present on the surface of the CB according to the models proposed in the literature. The PBu macromolecules will then shield progressively the slot shaped site, hindering the insertion of linear alkane, resulting in a rapid decrease of the #d s
value.
As long as the slot shaped insertion sites remain accessible, the IMparameter remains quite equal to the initial value measured on
the unmodified CB. Once these sites are completely covered, the IM
parameter starts to increase to one until the entire surface is cov-ered by a continuous polymer layer corresponding to the formation of a so called MU monolayer.
However, if the N539, the N326, the N330 and the N347 CB behave similarly, the variations of the surface properties of the
N115 sample are different. The literature data suggests that the N115 presents a rougher surface having a higher graphitic charac-ter due to a higher temperature of synthesis than the other studied samples.
Hence, the coupling of the IGC-ID with the controlled modifica-tion by PBu impregnamodifica-tion permits us:
- To get information on the surface morphology of a CB and espe-cially on its surface heterogeneity.
- To estimate quantitatively the number of sites having the highest interaction energy; sites that could not be quantified by either gas adsorption because surface roughness generates a negligible microporous volume, or by AFM that allows only to observe the sole structure of the graphitic domains.
- To highlight the specific interaction that the PBu exchanges with this type of site, which may be responsible of the reinforcing capacity of the CBs towards elastomers.
- To prove clearly the differences in surface properties between CBs of different grades.
References
[1] G. Kraus, Reinforcement of Elastomers by Carbon Black, Wiley Interscience, New York, 1965.
[2] J.B. Donnet, R.C. Bansal, M.-J. Wang, Carbon Black Science and Technology, Marcel Dekker Inc., New York, 1993.
[3] M. Gerspacher, C.P. O’Farrell, L. Nikiel, H.H. Yang, F. Le Méhauté, Rubber Chem. Technol. 69 (1996) 786.
[4] M. Klüppel, R.H. Schuster, G. Heinrich, Rubber Chem. Technol. 69 (1996) 786. [5] M. Klüppel, Adv. Polym. Sci. 164 (2003) 1.
[6] M. Klüppel, J. Meier, M. Dämgen, Modeling of stress softening and filler induced hysteresis of elastomer materials, in: P.-E. Austrell, L. Kari (Eds.), Constitutive Models for Rubber IV, A.A. Balkema Publishers, Lisse, Abingdon, Exton, Tokyo, 2005.
[7] M. Klüppel, G. Heinrich, Kautsch. Gummi Kunstst. 58 (2005) 217. [8] C. Lansinger, J.B. Donnet, Kautsch. Gummi Kunstst. 45 (1992) 459. [9] M.-J. Wang, S. Wolff, Rubber Chem. Technol. 65 (1992) 715. [10] E. Papirer, S. Li, H. Balard, J. Jagiello, Carbon 29 (1991) 1135. [11] E. Papirer, J.-B. Donnet, J. Heinkele, J. Chem. Phys. 68 (1971) 580. [12] J.-B. Donnet, Carbon 32 (1994) 1305.
[13] H. Balard, E. Brendlé, E. Papirer, Determination of acid–base properties of solids surfaces using inverse gas chromatography: advantages and limitations, in: K. Mittal (Ed.), Acid–Base Interactions: Relevance to Adhesion Science and Tech-nology, VSP, Utrecht (Nederlands), 2000, pp. 299–316.
[14] A. Lapra, E. Custodero, N. Simon, Kautsch. Gummi Kunstst. 57 (2004) 52. [15] A. Schröder, M. Klüppel, R.H. Schuster, Macromol. Mater. Eng. 292 (2007) 885. [16] H. Balard, E. Papirer, Polym. Mater. Sci. Eng. 70 (1994) 456.
[17] E. Papirer, E. Brendlé, H. Balard, F. Ozil, Carbon 37 (1999) 1265. [18] T.A. Vilgis, G. Heinrich, Macromolecules 27 (1994) 7896.
[19] T.W. Zerda, H. Yang, M. Gerspacher, Rubber Chem. Technol. 65 (1992) 130. [20] I.M.K. Ismail, P. Pfeifer, Langmuir 10 (1994) 1532.
[21] W. Xu, T.W. Zerda, H. Yang, M. Gerspacher, Carbon 34 (1996) 165. [22] F. Ehrburger-Dolle, M. Holz, J. Lahaye, Pure Appl. Chem. 65 (1993) 2223. [23] B. Sahouli, S. Blacher, F. Brouers, Langmuir 12 (1996) 2872.
[24] H. Darmstadt, C. Roy, S. Kallaguine, B. Sahouli, S. Blacher, R. Pirard, F. Brouers, Rubber Chem. Technol. 68 (1995) 32.
[25] W. Niedermeier, H. Raab, J. Stiersdorfer, S. Kreitmeier, D. Göritz, Kautsch. Gummi Kunstst. 47 (1994) 799.
[26] H. Raab, J. Fröhlich, D. Göritz, Kautsch. Gummi Kunstst. 3 (2000) 137. [27] M.H. Reich, S.P. Russo, J.K. Snook, H.K. Wagenfold, J. Colloid Interface Sci. 135
(1990) 353.
[28] J. Fröhlich, S. Kreitmeier, D. Göritz, Kautsch. Gummi Kunstst. 51 (1998) 370. [29] E. Custodéro, PhD Thesis, University of Haute Alsace, Mulhouse, France, 1992. [30] J.B. Donnet, E. Custodéro, Carbon 30 (1992) 813.
[31] M.P. Comard, R. Calvet, J.A. Dodds, H. Balard, Powder Technol. 128 (2002) 262. [32] ASTM D 3037, Annual Book of ASTM Standards, 9.01, 1990, p. 465.
[33] ASTM D 3765, Annual Book of ASTM Standards, 9.01, 1990, p. 614. [34] ASTM D 1510, Annual Book of ASTM Standards, 9.01, 1990, p. 269.
[35] S. Hamdi, B. Hamdi, Z. Kessaissia, H. Bathel, H. Balard, J.B. Donnet, J. Chromatogr. A 969 (2002) 143.
[36] M.P. Comard, R. Calvet, H. Balard, J.A. Dodds, Colloids Surf. A 232 (2004) 269. [37] M.P. Comard, R. Calvet, H. Balard, J.A. Dodds, Colloids Surf. A 238 (2004) 37. [38] J.R. Conder, C.L. Young, Physicochemical Measurements by Chromatography,
John S. Wiley & Sons, New York, 1979.
[39] E. Brendlé, E. Papirer, J. Colloid Interface Sci. 194 (1997) 207. [40] G.M. Dorris, D.G. Gray, J. Colloid Interface Sci. 77 (1980) 353.
[41] E. Papirer, H. Balard, Surface energy of silicas, in: A.P. Legrand (Ed.), The Surface Properties of Silicas, J. Wiley & Sons, NY, 1998, pp. 315–364 (Chapter 3). [42] H. Balard, D. Maafa, A. Santini, J.B. Donnet, J. Chromatogr. A 1198 (2008)
173.
[43] G. Kühner, M. Voll, Manufacture, in: J.B. Donnet, R.C. Bansal, M.-J. Wang (Eds.), Carbon Black Science and Technology, Marcel Dekker Inc., New York, 1993, p. 32.
[44] W.H. Hess, C.R. Herd, Physical properties, in: B. Donnet, R.C. Bansal, M.-J. Wang (Eds.), Carbon Black Science and Technology, Marcel Dekker Inc., New York, 1993, p. 113.
![Fig. 1. Variation of the free energies of adsorption of the probes with their topological indexes, X t [39]: relation with some experimental chromatograms and principle of the determination of main IGC-ID parameters, !G CH a 2 and !G Ma .](https://thumb-eu.123doks.com/thumbv2/123doknet/11588306.298538/3.892.184.727.119.385/variation-adsorption-topological-experimental-chromatograms-principle-determination-parameters.webp)