HAL Id: hal-01183344
https://hal.archives-ouvertes.fr/hal-01183344
Submitted on 7 Aug 2015
HAL is a multi-disciplinary open access
archive for the deposit and dissemination of
sci-entific research documents, whether they are
pub-lished or not. The documents may come from
teaching and research institutions in France or
abroad, or from public or private research centers.
L’archive ouverte pluridisciplinaire HAL, est
destinée au dépôt et à la diffusion de documents
scientifiques de niveau recherche, publiés ou non,
émanant des établissements d’enseignement et de
recherche français ou étrangers, des laboratoires
publics ou privés.
Collaboration Schemes Evaluation in Multi-domain
Networks
Aymen Belghith, Siwar Ben Hadj Said, Bernard Cousin, Samer Lahoud
To cite this version:
Aymen Belghith, Siwar Ben Hadj Said, Bernard Cousin, Samer Lahoud. Collaboration Schemes
Evaluation in Multi-domain Networks. International Journal of Computer Science Issues, IJCSI Press,
2012, 9 (4), pp.472 - 480. �hal-01183344�
Collaboration Schemes Evaluation in Multi-domain
Networks
Aymen Belghith, Siwar Ben Hadj Said, Bernard Cousin, and Samer Lahoud
Universit´e de Rennes 1 - IRISA, Campus de Beaulieu, 35042 Rennes Cedex, France
Email: [email protected], [email protected], [email protected], [email protected]
ABSTRACT
The monitoring of the quality of service in a multi-domain network supervises the multi-domain service performance. A multi-domain service is a service that crosses several domains which can be man-aged by different providers. Since each domain can be manman-aged with its own policies and may require confidentiality of its topology and its monitoring processes, we propose that the monitoring architecture has to be configurable. In this paper, we propose two collaboration schemes that are based on the reactive and the proactive modes. Both of collaboration schemes allow the multi-domain monitoring archi-tecture to select the measurement points that will participate in the multi-domain monitoring and to configure the selected measurement points. In this paper, we present our proposed collaboration schemes and then we evaluate their performance through extensive simulations using Network Simulator (NS-2).
Key words—Network monitoring, Selections schemes, Proactive
method, Reactive method.
1. INTRODUCTION
Network monitoring is necessary to guarantee precise and efficient management of a network communication system. It is required to control the Quality of Service (QoS) provided by the network. The performance requirements of the services are typically specified through a contract between a service user and a service provider, called Service Level Agreement (SLA). In order to guarantee the performance of the services, the network performance has to be verified by performing network monitoring. Many monitoring architectures were proposed for intra-domain networks such as in [1] and [2] or proposed for multi-domain networks. A monitoring architecture can use standard monitoring protocols such as Real-time Traffic Flow Measurement (RTFM) [3], IP Flow Information eXport (IPFIX) [4], and Packet Sampling (PSAMP) [5]. In this paper, we interest in multi-domain monitoring.
A multi-domain service is a service that crosses several domains which can be managed by different providers. Each domain can be managed with its own policies and may require confidentiality of its topology and its traffic param-eters. Thus, multi-domain monitoring process has to take into account the specific confidentiality requirement. Furthermore the heterogeneity aspect of the different domains (for instance,
the monitoring parameters) makes the multi-domain network monitoring an even more important and challenging issue. Many projects proposed multi-domain network monitoring architectures. For example, the monitoring architecture of INTERMON [6] is applied in each network domain and the communication between the different domains is performed using Authorization, Authentication, and Accounting (AAA) local servers. Each provider can request a distant provider to get intra-domain measurement results on one or some metrics. When receiving this measurement result request, the distant provider checks if the sender has the right to obtain such information, using the AAA server, and answers the request. In the MESCAL monitoring architecture [7], each provider performs monitoring in its domain. For privacy reasons, it is forbidden that a provider performs active monitoring with a distant domain. Each domain is administered locally. After per-forming intra-domain measurements, the measurement results are shared between all the domains using a results exchange method. This method is determined by a negotiation process between the providers. The negotiation process consists of the determination of the aggregation method in order to obtain end-to-end measurements and the determination of the summarization method in order to reduce the quantity of the exchanged measurement results.
The ENTHRONE monitoring architecture [8] consists of three levels: Node level Monitoring (NodeMon), Network level Monitoring (NetMon), and Service level Monitor (Serv-Mon). The NodeMon performs intra-domain active and passive application-level measurements at the edge nodes. These per-flow measurements are used to detect SLA violations such as QoS degradations. The NetMon processes and aggregates the measurements collected by the different NodeMons belonging to its domain. Then, it exports only the relevant measure-ment results to the ServMon. The ServMon is responsible for reporting the QoS measurements between the different domains using Extensible Markup Language (XML)-based measurement statistic.
In the EuQoS monitoring architecture [9], Net Meter [10] is selected as the intra-domain measurement tool. This active tool provides measurements on QoS metrics such as the delay, the
delay variation, and the packet loss ratio. Moreover, the Mon-itoring and Measurement System (MMS) of EuQoS provides real-time measurements using an on-line monitoring passive tool called Oreneta [11]. The MMS is limited to monitor a single class of service in a single domain. An active measure-ment tool, called Link Load Measuremeasure-ment Tool (LLMT), was developed by EuQoS to perform inter-domain measurements (on inter-domain links). The measurement results obtained by LLMT are then stored in the Resource Manager Database (RM DB).
The heterogeneity aspect of the different domains makes the multi-domain network monitoring an important and challeng-ing problem. However, we note that all the above monitorchalleng-ing architectures do not take into account the multi-domain hetero-geneous structure of the network. Moreover, as each domain wants to apply its own policy and keeps some monitoring processes or measurement results private, the multi-domain monitoring architecture has to resolve interoperability and confidentiality problems. In order to resolve the heterogeneity, interoperability, and confidentiality (of monitoring processes or measurement results) problems, the multi-domain monitor-ing has to be configurable. The proposal for the configuration of multi-domain monitoring has already been presented in [12]. This proposal consists of a multi-domain monitoring architecture that is based on three points: the localization of the configuration functionality, the requirements of the measurement points selection, and the requirements of the measurement points configuration. Furthermore, we propose to perform multi-domain monitoring only between measurement points located at the border of the domains in order to resolve the confidentiality of the domain topology. When the selected measurement points are configured and the multi-domain mon-itoring is established, they can detect contract violations using fault detection mechanisms. Note that we proposed detection mechanisms that are based on export methods in [13]. In this paper, we present two collaboration schemes that man-age the selection and configuration of the different measure-ment points that participate in the multi-domain monitoring. These collaboration schemes were introduced in [14]. A col-laboration scheme provides the basic preliminary functionality of the network monitoring as it prepares the measurement points that participate in the monitoring of a multi-domain service.
Our proposed collaboration schemes are based on the proactive and reactive selections. In this paper, we evaluate, through extensive simulations, the collaboration schemes by studying the blocking percentage of the services that request to be monitored, the throughput of the monitoring (for measurement points selection and configuration), and the delay of the mon-itoring establishment. We note that the existing multi-domain monitoring architectures do not define or use any collaboration scheme as the measurement points are pre-configured and are homogeneous. Furthermore, these monitoring architectures
do not consider that a measurement point has a monitoring capacity, i.e. a measurement point can monitor a limited number of services simultaneously.
This paper is organized as follows. We present our proposed collaboration schemes in section 2. Section 3 presents the performance criteria and performance evaluations and com-parisons of our proposed collaboration schemes using four simulation scenarios: a basic scenario, a scenario where we increase the monitoring capacity, a scenario where we increase the number of the measurement points, and a scenario where we increase the number of the domains. Conclusions are provided in section 4.
2. COLLABORATION SCHEMES
Our proposed collaboration schemes provide two main func-tionalities: the selection and the configuration of the measure-ment points that participate in the multi-domain network mon-itoring. Our proposal for the selection and the configuration of the measurement points should adapt to any compatible multi-domain network architecture like the architecture model defined by the IPSphere forum [15]. This model allows providers to overcome scalability and interoperability issues. The IPSphere forum has defined the role of each system entity: Administrative Owner (AO), Element Owner (EO), and customer. The AO is the entity that is responsible for providing and guaranteeing end-to-end services over a multi-domain network. These services are requested by customers. The EO is the entity that manages the resources of a network domain. Each service provided by the AO uses the resources of one or several EOs.
2.1 Measurement points selection
We suppose that the client launches a multi-domain monitoring of a service by sending a multi-domain network monitoring request. When receiving this request, the measurement points that participate in this monitoring have to be selected by the AO. The selection of the measurement points can be done during or after the service establishment. An EO can participate in the selection by preselecting a list of useful measurement points in its domain. The selection can be proac-tive or reacproac-tive. For both selection methods, the configuration entities of the concerned domains have to transmit the informa-tion about the useful measurement points (or the informainforma-tion about all the available measurement points in its domain). The information about a measurement point consists of its location (e.g. the Internet Protocol address of the measurement point), its configurable parameters, and its monitoring capacity (that represents the maximum number of services that can be monitored simultaneously).
2.1.1 Proactive selection: In the proactive selection, each
points. When the management data of all the network domains is available, the AO can efficiently select the measurement points to be used for the monitoring of a multi-domain service. However, the transmitted information can be quite large. The proactive selection has two major drawbacks. First, the providers cannot preselect the measurement points to be used. Second, the providers have to transmit update messages when they need to update the list of the measurement points as well as their parameters or their monitoring capacities.
In practice, the proactive selection mode is required when the monitoring establishment is performed simultaneously with the service path establishment. The major advantage of this selection mode is that the path routing can take into account the characteristics of the measurement points. For example, the routing algorithm selects compatible measurement points which can still monitor other services, i.e. having a monitoring capacity greater than zero.
2.1.2 Reactive selection: In the reactive selection, on the
AO request, each concerned domain transmits the information about the useful measurement points for a specific monitored service. Each EO preselects the measurement points and answers the request. The reactive selection allows the EOs to avoid measurement points update procedure and decreases, for a given service, the amount of exchanged data for the publication (only preselected measurement points are sent). However, the selection has to be performed with each new incoming multi-domain monitoring request. Furthermore, the AO can select the measurement points only when it receives all the responses from all the domains concerned by the multi-domain monitoring request. Therefore, the measurement points selection can produce extra delay.
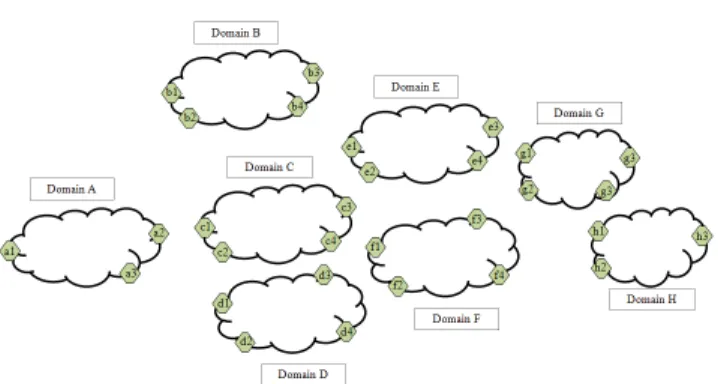
In practice, when the monitoring is established after the ser-vice path establishment, the reactive selection mode becomes more interesting while the proactive selection mode becomes useless. Indeed, there is no need to send all the measurement points characteristics of a domain to the AO when the path of the monitored service is already established. For example, if Domain B contains four measurement points (b1, b2, b3, and b4, see Fig. 1) and if the service is already established and it crosses measurement points b1 and b4. So, the EO of Domain B sends only the characteristics of b1 and b4 as b2 and b3 cannot participate in the monitoring of this service.
2.2 Measurement points configuration
We propose the following location of the configuration func-tions. First, we propose to locate the multi-domain configura-tion funcconfigura-tion at the AO since the global network resources are managed by this entity. Likewise, we propose that the intra-domain configuration function of a intra-domain is coupled with the EO of this domain as this entity manages the resources of its network domain. Therefore, the AO is responsible for the
Fig. 1. Multi-domain network monitoring scenario.
configuration of all the domains that participate in the multi-domain monitoring through their EOs.
After selecting the measurement points that will participate in the multi-domain monitoring of a given service, the AO config-ures the domains that belong to the path of this monitored ser-vice. In both of the selection methods above, we propose that the AO requests the configuration entity of each domain on the monitored path to activate the selected measurement points of each domain. Furthermore, we propose that each intra-domain configuration entity configures its measurement and export parameters. This configuration can be determined locally when performing network monitoring of a mono-domain service. However, this configuration has to be determined by the AO when performing multi-domain network monitoring for two reasons: the heterogeneity and the confidentiality. For example, when we perform active measurements between measurement point a0 belonging to domain A and measurement point d2
belonging to domain D (see Fig. 1), we have to configure these two measurement points in a coordinated way. For example, in a heterogeneous environment, in order to measure the delay, we have to select the same metric (for example One-Way Delay [16]), the same measurement protocol (for example One Way Active Measurement Protocol [17]), and the same export method (for example periodic, each 5 s). These monitoring
parameters are selected among the set of the metrics, the measurement protocols, and the export methods available at these two measurement points.
Even in a homogeneous environment (all the measurement points use the same parameters), the multi-domain monitoring configuration is still necessary as the values of these parame-ters have to be chosen properly. Moreover, even if the values of the different parameters are chosen in a coordinated and suit-able manner, the configuration is still necessary. Indeed, when the active monitoring is used, the location of the measurement points has to be configured. For example, for confidentiality reasons, when we need to perform active measurements be-tween measurement point a0 and measurement point d2 (see
Fig. 1) without unveiling the location of the measurement points located inside a domain to any distant domain, we can perform multiple segmented measurements. For example,
we can perform active measurements between measurement point a0 and a2 and between measurement point a2 and d2.
Therefore, the location of measurement point a0 is known
by measurement point a2 that belongs to the same domain.
Moreover, some confidentiality is assured: measurement point
d2 knows only the location of measurement point a2 that is
located at the border of the distant domain.
3. PERFORMANCE EVALUATION OF THE PROPOSED COLLABORATION SCHEMES
3.1 Performance criteria
We evaluate the following performance criteria:
• The blocking percentage due to the measurement points overload which represents the percentage of the monitoring requests that are blocked because there is at least one measurement point on the path that reaches its maximum monitoring capacity. We note that the blocking percentage due to the measurement points incompatibility is equal to zero when all the measurement points are compatible. • The monitoring throughput which represents the
through-put of messages used to publish the measurement points characteristics (called publication throughput) added to the throughput of messages used to configure the measurement points (called configuration throughput).
• The delay of the monitoring establishment which represents the difference between the time of configuration of all the measurement points that participating in the monitoring of a given service and the time of the reception of the mon-itoring request by the AO. We consider only the accepted monitoring requests (the blocked monitoring requests are not considered in the delay computations).
3.2 Basic scenario (S1)
3.2.1 Simulation model: In the basic scenario, we consider
a multi-domain network topology formed by four domains and fourteen measurement points (see Fig. 1). Each domain may contain numerous measurement points but we consider only measurement points that are located at the border of the domains for confidentiality reasons. Domain A, domain B, domain C, and domain D contain three measurement points called (a1, a2, and a3), four measurement points called (b1, b2, b3, and b4), four measurement points called (c1, c2, c3, and c4), and three measurement points called (d1, d2, and d3), respectively. We note that we study the influence of the increase of the number of measurement points and the increase of the number of domains in scenario S3 and scenario S4, respectively. We have implemented a new Network Simulator (NS-2) [18] module in order to implement the collaboration schemes as well as the simulation components such as the measurement points, the AO, and the EOs. The main sim-ulation parameters are presented in Table I. The link speed
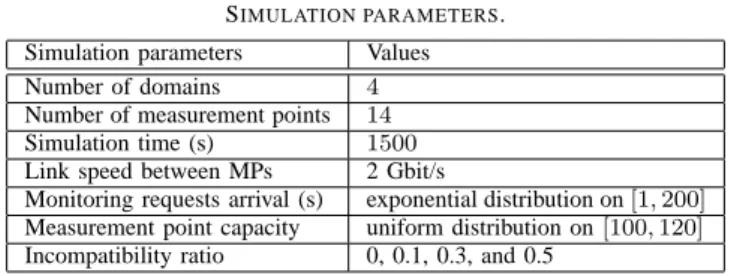
TABLE I SIMULATION PARAMETERS. Simulation parameters Values Number of domains 4
Number of measurement points 14
Simulation time (s) 1500
Link speed between MPs 2 Gbit/s
Monitoring requests arrival (s) exponential distribution on[1,200]
Measurement point capacity uniform distribution on[100,120]
Incompatibility ratio 0, 0.1, 0.3, and 0.5
between the different measurement points, the EOs, and the AO is equal to 2 Gbit/s. We associate a measurement point with each node, an EO with each domain, and a single AO with the whole scenario. We choose that the AO is located in domain B.
The monitoring requests arrival is randomly chosen accord-ingly to an exponential distribution law over [1, 200].
Evi-dently, this simulation parameter has a direct influence on the number of received monitoring request. For example, if the monitoring requests arrival is equal to 1 s, the AO will receive 1500 monitoring requests during the simulation (the simulation time is equal to 1500 s). The measurement point capacity is randomly chosen accordingly to a uniform distribution law over [100, 120]. The measurement point capacity represents
the maximum number of services that a measurement point can monitor simultaneously. We note that we study the in-fluence of the increase of the measurement point capacity in scenario S2. The incompatibility ratio represents the ratio of the measurement points that are not compatible with any other one. Two measurement points are compatible if and only if they can perform active measurement between them. For example, if the incompatibility ratio is equal to 0.1 and if we take ten measurement points, then we have, in average, one measurement point that is not compatible with all the other ones. In our scenario, the possible values of the incompatibility ratio are: 0 (all the MPs are compatible), 0.1, 0.3, and 0.5 (half of the measurement points are incompatible). We note that we use Network Simulator (NS-2) in order to implement and evaluate our proposed collaboration schemes.
3.2.2 Simulation results for compatible measurement points:
In this section, we consider the case where all the measurement points are compatible (incompatibility ratio is equal to zero).
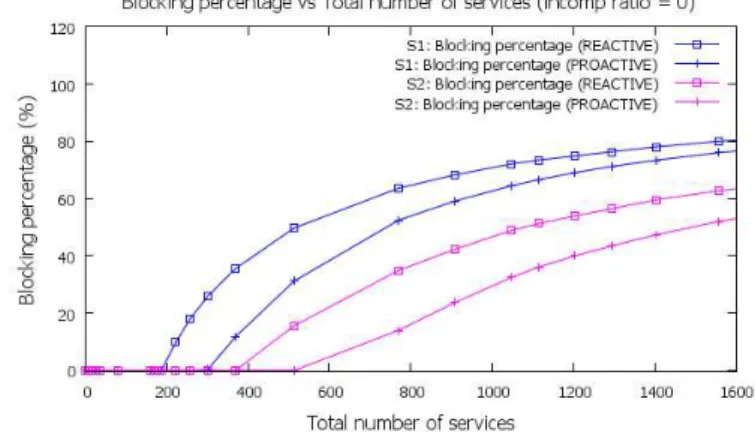
3.2.2.1 Blocking percentage evaluation: Fig. 2 represents
the blocking percentage as a function of the total number of the generated services during simulation. We note that, using the simulation parameters listed in subsection 3-B1, the blocking percentage is equal to zero for both collaboration schemes when the total number of services is lower than 200. Indeed, the measurement points do not reach their maximum monitoring capacity yet. From a total number of services approximately equal to 200, the blocking percentage of the reactive mode starts increasing while the blocking percentage of the proactive mode remains null for a total number of
Fig. 2. Blocking percentage vs total number of the generated services during simulation.
services equal to 300.
We notice that the proactive mode outperforms the reactive mode because when the proactive mode is applied, the AO has a global view on the capacity of all the measurement points. Therefore, the AO can select the measurement points that still have the capacity to monitor further services. However, when the reactive mode is applied, the path for a given service is already established and thus sometimes it must use a measurement point that has already reached its maximum monitoring capacity.
When the number of services becomes very important, the blocking percentage of the proactive mode and of the reactive mode becomes close as most of the measurement points cannot monitor further services.
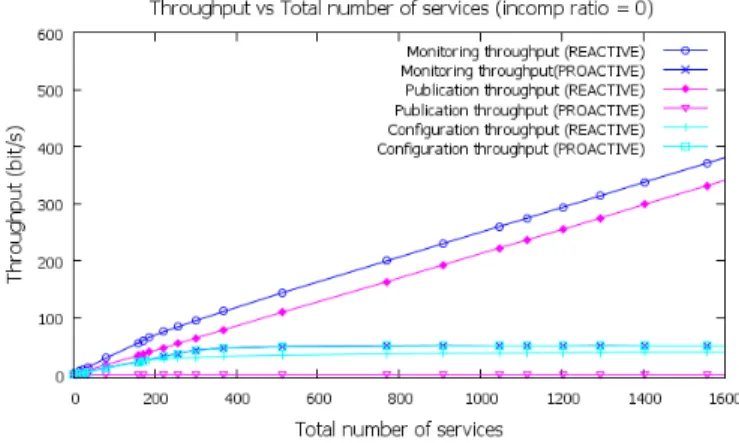
3.2.2.2 Throughput evaluation: Fig. 3 represents the
monitor-ing throughput, the publication throughput, and the configura-tion throughput as a funcconfigura-tion of the total number of services. The configuration throughput presented by the proactive mode is more important than that presented by the reactive mode. This is explained by the fact that the proactive mode allows our configurable monitoring architecture to monitor more services than the reactive mode (the proactive mode is flexible and thus it generates lower blocking percentage of the monitoring requests, see Fig. 2). Indeed, more monitoring requests are blocked, less throughput is generated.
Now, we consider the publication throughput. We note that the reactive mode generates higher publication throughput than the proactive mode. Indeed, we assumed that the publication period of the measurement points characteristics update is longer than the simulation time (i.e., the measurement points characteristics remains the same during 1500 s). Therefore, when the proactive mode is used, each EO publishes the characteristics of its measurement points once during the simulation. However, when the reactive mode is used, the EO sends the list of the preselected measurement points at each monitoring request. This is because the AO does not know
Fig. 3. Throughput vs total number of services. TABLE II
MEAN DELAY OF THE MONITORING ESTABLISHMENT. Collaboration mode Proactive Reactive Mean delay (s) 0.1 0.18
the measurement points that are on the service path. The AO knows only the source node, the destination node, and the domains on the path.
Recall that the monitoring throughput is equal to the con-figuration throughput plus the publication throughput. The publication throughput is more important than the configu-ration throughput and so it has more effect on the monitoring throughput. Consequently, we observe that the monitoring throughput of the reactive mode is higher than that of the proactive mode. Evidently, the monitoring throughput depends on the configuration and publication messages length as well as the number of accepted (non blocked) monitoring requests. Moreover, the number of accepted monitoring requests de-pends on the monitoring capacity of the different measurement points as well as on the total number of the generated monitoring requests.
3.2.2.3 Delay evaluation: The mean delay of the monitoring
establishment is presented in Table II. We note that the mean delay of the monitoring establishment when the reactive mode is used is greater than that when the proactive mode is used. This is because when the proactive mode is used, the AO has the characteristics of all the measurement points and does not need further information from the EOs to select the useful measurement points. However, when the reactive mode is used, the AO cannot locally select the useful measurement points. It has to send messages to the EOs concerned by the multi-domain monitoring in order to request the list of the preselected measurement points and then has to wait their responses before making decision.
3.2.3 Simulation results for measurement points having dif-ferent incompatibility ratios: Now, we study the blocking
Fig. 4. Blocking percentage due to the MPs incompatibility vs total number of services (for different incompatibility ratios).
points having incompatibility ratio equal to 0.1, 0.3, and 0.5. Fig. 4 represents the blocking percentage due to the MPs incompatibility as a function of the total number of services. Evidently, when all the MPs are compatible (incompatibility ratio is equal to zero), the blocking percentage due to the MPs incompatibility is equal to zero for the proactive and reactive modes.
When the incompatibility ratio is equal to 0.1, the blocking percentage due to the MPs incompatibility is the same for both collaboration modes. This is due to the small probability that two MPs are incompatible for a multi-domain service monitoring when the incompatibility ratio is low.
When the incompatibility ratio is equal to 0.3, the proactive mode outperforms the reactive mode. In fact, when the proac-tive mode is used, the AO endeavors to select compatible measurement points. However, when the reactive mode is used, the paths of the services are already established and then the measurement points that can participate in the multi-domain monitoring are limited.
For an incompatibility ratio equal to 0.5, both collaboration modes present the same blocking percentage due to the MPs incompatibility. Indeed, when the incompatibility ratio is important, even the proactive mode cannot find a path that contains only compatible measurement points (especially if the path has to cross many domains and thus many measurement points).
3.3 Scenario increasing the capacity of the measurement points (S2)
In this section, we present the evaluation of the blocking percentage and the configuration throughput when the mea-surement point capacity increases. For this purpose, we con-sider a scenario, called S2, where we keep the same topology described in the basic one (see Fig. 1). In this scenario, the measurement point capacity is chosen according to a uniform
Fig. 5. Blocking percentage vs total number of services (comparison between scenarios S1 and S2).
Fig. 6. Throughput vs total number of services (comparison between scenarios S1 and S2).
distribution on [200, 240] (the monitoring capacity is doubled compared to the basic scenario). All the measurement points are compatible (the incompatibility ratio is null). The other simulation parameters remain the same (see Table I).
Fig. 5 represents the blocking percentage as a function of the total number of the services generated during the simulations for the scenarios S2 and S1. We verify that the blocking percentage decreases when the measurement point capacity increases. We note that the distance between the proactive mode curve and the reactive mode curve is more important in scenario S2 than in scenario S1. Indeed, the measurement points can monitor more services when their capacity in-creases. Therefore, the AO has more flexibility in the selection of measurement points that can monitor further services when the proactive mode is used.
Fig. 6 represents the configuration throughput as a function of the total number of the services for the scenarios S1 and S2. We can verify that the configuration throughput increases when the measurement point capacity increases. We note that this increase is close to double.
Fig. 7. Topology of the scenario that increases the number of the measure-ment points (S3).
3.4 Scenario increasing the number of the measurement points (S3)
In this section, we present the evaluation of the blocking percentage and the configuration throughput when the number of the measurement points increases compared to the basic scenario (S1). For this purpose, we consider a scenario, called S3, composed of four domains and 28 measurement points (see Fig. 7).
In this scenario, the number of measurement points per domain was doubled compared to scenario S1. The measurement point capacity is chosen according uniform distribution on [100, 120] (like in scenario S1). As, in scenario S3, we investigate only the increase of the number of the measurement points, we assume that all the measurement points are compatible. The other simulation parameters remain the same (see Table I).
Fig. 8 represents the blocking percentage as a function of the total number of the services for scenarios S1 and S3. We verify that the blocking percentage decreases when the number of measurement point increases. We notice that, when the number of the measurement points increases, the proactive mode becomes more and more interesting since the distance between the proactive mode curve and the reactive mode curve is greater in scenario S3 than that in scenario S1. This is because when the number of the measurement points increases, the proactive mode becomes more flexible. Indeed, the AO has more choices in the selection of the measurement points to use for the multi-domain monitoring.
Fig. 9 represents the configuration throughput as a function of the total number of services for scenarios S1 and S3. We verify that the configuration throughput increases when the number of measurement points increases. This is due to the increase of the number of services to be configured (as a consequence of the decrease of the blocking ratio).
Fig. 8. Blocking percentage vs total number of services (comparison between scenarios S1 and S3).
Fig. 9. Throughput vs total number of services (comparison between scenarios S1 and S3).
3.5 Scenario increasing the number of the domains (S4)
In this section, we present the evaluation of the blocking percentage and the configuration throughput when the number of the domains increases compared to the basic scenario (see Fig. 10). For this purpose, we consider a scenario, called S4, composed of eight domains and 30 measurement points. In this scenario, the number of domains is doubled compared to the scenario S1. As we add domains containing four measurement points, the number of the measurement points increases from 14 to 30 measurement points. All the measurement points are compatible (the incompatibility ratio is null). The other simulation parameters remain the same (see Table I).
Fig. 11 represents the blocking percentage as a function of the total number of the services for scenarios S1 and S4. We verify that the blocking percentage decreases when the number of the domains increases. In fact, in scenario S4, when the number of the domains increases, the number of the measurement points increases and therefore the total monitoring capacity increases. Fig. 12 represents the blocking percentage as a function of the total number of the services for scenarios S3 and S4. Recall
Fig. 10. Topology of the scenario that increases the number of the domains (S4).
Fig. 11. Blocking percentage vs total number of services (comparison between scenarios S1 and S4).
that the topology of scenarios S3 and S4 are respectively formed by four domains and 28 measurement points and by eight domains and 30 measurement points. We notice that, when the proactive mode is used, the blocking percentage pre-sented by scenario S3 is lower than that prepre-sented by scenario S4. Indeed, in scenario S3, there are more measurement points that are located at the border of each domain than in scenario S4. Therefore, the AO has greater flexibility in the choice of the measurement points in a given domain border. When the proactive mode is used, although there are more measurement points in scenario S4 than in scenario S3, the blocking ratio in scenario S4 is greater than that in scenario S3.
However, we note that, when the reactive mode is used, the blocking percentage presented by scenario S3 is greater than that presented by scenario S4. In fact, when the reactive mode is used, the path of the service is already established. As the reactive mode is not path-flexible, the increase of the total number of measurement points has more effect than the location of these measurement points.
Fig. 13 represents the configuration throughput as a function of the total number of the services for scenarios S1 and S4. We notice that the configuration throughput increases when the number of the domains increases. This can be explained
Fig. 12. Blocking percentage vs total number of services (comparison between scenarios S3 and S4).
Fig. 13. Throughput vs total number of services (comparison between S1 and S4).
by the increase of the number of the monitored services (see Fig. 11).
4. CONCLUSION
In this paper, we have presented two collaboration schemes for the selection and the configuration of the measurement points. These schemes are based on the proactive and the reactive modes. We have shown, through extensive simulations, that the proactive mode outperforms the reactive mode in terms of blocking percentage, monitoring throughput, and delay of monitoring establishment. By increasing the measurement points capacity, the number of the measurement points, or the number of the domains, we have shown that the proactive mode becomes more and more interesting compared to the reactive mode.
In this paper, we do not consider the post-reaction monitoring mechanisms. However, these mechanisms can improve the performance of collaboration schemes. For example, the re-routing can improve the performance of the reactive mode because it gives flexibility to the AO to select other useful
measurement points and to subsequently move the service from these points. This flexibility of measurement points choice without changing domain is already offered by the proactive mode. The renegotiation of contracts can also im-prove performance and this is achieved by passing services from other domains capable of monitoring.
ACKNOWLEDGMENT
This work has been performed within a collaboration with Alcatel-Lucent Bell Labs France, under the grant n. 09CT310-01.
REFERENCES
[1] F. Strohmeier, H. D¨orken, and B. Hechenleitner, ”AQUILA distributed QoS measurement”, International Conference on Advances in Communi-cations and Control, Crete, Greece, 2001.
[2] C. Molina-Jimenez, S. Shrivastava, J. Crowcroft, and P. Gevros, ”On the monitoring of Contractual Service Level Agreements”, the first IEEE International Workshop on Electronic Contracting, WEC, San Diego , CA, USA, 2004.
[3] N. Brownlee, C. Mills, and G. Ruth, ”Traffic Flow Measurement: Archi-tecture”, RFC 2722, October 1999.
[4] G. Sadasivan, N. Brownlee, B. Claise, and J. Quittek, ”Architecture for IP Flow Information Export”, RFC 5470, May 2009.
[5] B. Claise, Ed. A. Johnson, and J. Quittek, ”Packet Sampling (PSAMP) Protocol Specifications”, RFC 5476, March 2009.
[6] E. Boschi, S. D’Antonio, P. Malone, and C. Schmoll, ”INTERMON: An architecture for inter-domain monitoring, modelling and simulation”, NETWORKING 2005, Pages 1397 - 1400, Springer Berlin / Heidelberg, 2005.
[7] P. Morand et al., ”Final specification of protocols and algorithms for inter-domain SLS management and traffic engineering for QoS-based IP service delivery”, Deliverable D1.3, MESCAL, June 2005.
[8] A. Mehaoua et al., ”Service-driven inter-domain QoS monitoring system for large-scale IP and DVB networks”, Computer Communications, Volume 29, 2006.
[9] M. Dabrowski, P. Owezarski, W. Burakowski, and A. Beben, ”Overview of monitoring and measurement system in EuQoS multi-domain net-work”, International Conference on Telecommunications and Multimedia (TEMU’06), Greece, 2006.
[10] Net Meter. http://www.hootech.com/NetMeter/ [6 October 2008]. [11] M. Dabrowski et al., ”EuQoS and measurements”, EEQoS Workshop,
Paris, France, June 2005.
[12] Aymen Belghith, B. Cousin, S. Lahoud, and S. Ben Hadj Said, ”Proposal for the configuration of multi-domain network monitoring architecture”, the 25th Iternational Conference on Information Networking (ICOIN 2011), Kuala Lumpur, Malaysia, January 2011.
[13] Aymen Belghith, Siwar Ben Hadj Said, Bernard Cousin, and Samer Lahoud, ”QoS Fault Detection and Localization Mechanisms (FDLM) in Multi-domain Networks Adapted to Export Methods”, the 14th Inter-national Conference on Advanced Communication Technology, ICACT 2012, pages 848 - 853, Pyeongchang, Korea, 19 - 22 February 2012. [14] Aymen Belghith, Siwar Ben Hadj Said, Bernard Cousin, and Samer
La-houd, ”Proactive and Reactive Collaboration Schemes for Multi-domain Networks Monitoring”, Computing, Communications & Applications Conference, ComComAp 2012, Hong Kong, China, 11 - 13 January 2012. [15] J.-M. Uz´e, ”IPSphere Forum: status on technical specifications”,
TER-ENA Networking Conference 2007, Copenhagen, Denmark, 2007. [16] G. Almes, S. Kalidindi, and M. Zekauskas, ”A One-way Delay Metric
for IPPM”, RFC 2679, September 1999.
[17] S. Shalunov, B. Teitelbaum, A. Karp, and J. Boote, and M. Zekauskas, ”A One Way Active Measurement Protocol (OWAMP)”, RFC 4656, September 2006.
[18] The Network Simulator - ns-2: http://www.isi.edu/nsnam/ns/, last visited July 2012.
Aymen BELGHITH received his Engineering and his Master of Science
degrees in Computer Science from the National School of Computer Science (ENSI), University of Manouba, Tunisia, in July 2005 and April 2006, respec-tively. He received his Ph.D. degree in Computer Science from TELECOM Bretagne, Cesson S ´evign ´e, France in March 2009. From April 2009, he was with IRISA, Rennes, France, as a Postdoctoral Follow for 18 months. From September 2010, he is an Assistant Professor in Univesity of Sfax, Tunisia. His research interests include wireless networks, network monitoring, simulation and performance evaluation.
Siwar BEN HADJ SAID received her Engineering degree in
Telecommunica-tion and Computer Networks in January 2010, from both of Telecom ParisTech, France and High School of communication (SupCom), University of Carthage, Tunis. From March 2010 to September 2010, she was with IRISA, Rennes, France, as a trainee. Actually, she is doing her Ph.D. study in the Network, Security and Multimedia (RSM) department, TELECOM Bretagne, Cesson S ´evign ´e, France. Her research interests include wireless networks, network monitoring, mobility management, and network security.
Bernard COUSIN is a Professor of Computer Science at the University of
Rennes 1. Bernard Cousin received in 1987 his PhD degree in computer science from the University of Paris 6. He is, currently, member of IRISA (a CNRS-University joint research laboratory located at Rennes). He is at the head of a research group on networking. He has co-authored more than one hundred of papers published in international journals and conferences. His main research interests include next generation Internet, all-optical networks, network monitoring, dependable networking, traffic engineering, multicast rout-ing, network QoS management, network security and multimedia distributed applications.
Samer LAHOUD graduated from the Faculty of Engineering, Saint Joseph
University, Beirut, in 2002. In 2006, he received the Ph.D degree in communi-cation networks from Telecom Bretagne, Rennes. After his Ph.D. he spent one year with Alcatel-Lucent Bell Labs Europe working as a research engineer. Since 2007, he is an assistant professor at the University of Rennes I and he is taking part in the research activities at the IRISA laboratory in Rennes. His research activities focus on network design, combinatorial optimization and engineering algorithms for communication networks. He has been involved in many research programs at the national and the European level.