HAL Id: hal-00903466
https://hal.archives-ouvertes.fr/hal-00903466
Submitted on 12 Nov 2013HAL is a multi-disciplinary open access archive for the deposit and dissemination of sci-entific research documents, whether they are pub-lished or not. The documents may come from teaching and research institutions in France or abroad, or from public or private research centers.
L’archive ouverte pluridisciplinaire HAL, est destinée au dépôt et à la diffusion de documents scientifiques de niveau recherche, publiés ou non, émanant des établissements d’enseignement et de recherche français ou étrangers, des laboratoires publics ou privés.
Modeling of damage in unidirectional ceramic matrix
composites and multi-scale experimental validation on
third generation SiC/SiC minicomposites
Camille Chateau, Lionel Gélébart, Michel Bornert, Jérôme Crépin, Daniel
Caldemaison, Cédric Sauder
To cite this version:
Camille Chateau, Lionel Gélébart, Michel Bornert, Jérôme Crépin, Daniel Caldemaison, et al.. Mod-eling of damage in unidirectional ceramic matrix composites and multi-scale experimental validation on third generation SiC/SiC minicomposites. Journal of the Mechanics and Physics of Solids, Elsevier, 2014, 63, pp.298-319. �10.1016/j.jmps.2013.09.001�. �hal-00903466�
Modeling of damage in unidirectional ceramic matrix composites and multi-scale experimental validation on third generation SiC/SiC minicomposites
C.Chateaua,b, L.Gélébarta*, M.Bornertb, J.Crépinc, D.Caldemaisond, C.Saudera
a
CEA, DEN, DMN, SRMA, 91191 Gif-sur-Yvette Cedex, France
b
Université Paris-Est, Laboratoire Navier (UMR 8205), CNRS, ENPC, IFSTTAR, F-77455 Marne-la-Vallée, France
c
Mines ParisTech, Centre des matériaux (CNRS UMR 7633), BP 87, 91003 Evry Cedex, France
d
Solid Mechanics Laboratory (CNRS UMR 7649), Ecole polytechnique, 91128 Palaiseau Cedex, France
* Corresponding author: lionel.gelebart@cea.fr tel: +33 1 69 08 16 78, fax: +33 1 69 08 71 67
Abstract
The purpose of this paper is to experimentally validate a 1D probabilistic model of damage evolution in unidirectional SiC/SiC composites. The key point of this approach lies in the identification and validation at both local and macroscopic scales. Thus, in addition to macroscopic tensile tests, the evolution of microscopic damage mechanisms - in the form of matrix cracks and fiber breaks - is experimentally analyzed and quantified through in-situ scanning electron microscope and computed tomography tensile tests. A complete model, including both matrix cracking and fiber breaking, is proposed on the basis of existing modeling tools separately addressing these mechanisms. It is based on matrix and fiber failure probability laws and a stress redistribution assumption in the vicinity of matrix cracks or fiber breaks. The identification of interfacial parameters is conducted to fit the experimental characterization, and shows that conventional assumptions of 1D probabilistic models can adequately describe matrix cracking at both macro- and microscopic scales. However, it is necessary to enrich them to get a proper prediction of ultimate failure and fiber break density for Hi-Nicalon type S fiber-reinforced SiC/SiC minicomposites.
Keywords : A. Fracture mechanisms ; B. Ceramic material ; B. Fiber-reinforced composite
material ; C. In-situ mechanical testing ; C. Numerical algorithms
NOTICE: This is the author’s version of a work that was accepted for publication in Journal of the Mechanics and Physics of Solids. Changes resulting from the publishing process, such as editing, corrections, structural formatting, and other quality control mechanisms may not be reflected in this document. Changes may have been made to this work since it was submitted for publication. A definitive version was subsequently published in J. Mech. Phys. Solids (2013), http://dx.doi.org/10.1016/j.jmps.2013.09.001.
Nomenclature
Young moduli of fibers and matrix cross-sectional area of fibers and matrix fiber volume fraction
number of fibers total length
fiber radius
̅ average axial stress overall load
axial stresses in fibers and matrix axial stress in intact fibers
number of intact fibers strains in fibers and matrix ̅ macroscopic strain
Weibull scale parameters of fibers and matrix Weibull moduli of fibers and matrix
strengths of segment unit of fibers and matrix Reference volume (1mm3)
axial stresses in fibers and matrix in the undamaged composite interfacial shear stress
interfacial shear stress related to fiber breaking fiber stress jump at the debond tip
damaged lengths in fibers and matrix interfacial energy release rate
macroscopic debond stress axial thermal stresses
matrix crack opening mean fiber pull-out length
1. Introduction
Because of their favorable mechanical properties at high temperatures and under irradiation, SiC/SiC composites are prospective candidates for functional uses in future nuclear reactors. The composites under investigation are made from the new near-stoechiometric SiC fibers, because of their favorable mechanical properties at high temperatures and after irradiation, using the Chemical Vapor Infiltration (CVI) process.
In addition to a complex and multi-scale microstructure, such materials exhibit a nonlinear behavior due to the accumulated damages occurring between and inside the woven tows, such as through matrix cracking, fiber/matrix debonding as well as fiber breaking. Thus, a multi-scale approach is under development to build a predictive model of their complex and damageable mechanical behavior taking into account their heterogeneous microstructure [Gélébart et al. (2010)]. In this context, this paper focuses on the study of damage process at the scale of the tow under a uniaxial tensile loading. Due to their simple geometry, so-called minicomposites, i.e. unidirectional composites containing a single bundle of fibers, are well suited to study damage mechanisms. They are also frequently used to optimize the fiber/matrix interphase which dictates the matrix crack deflection along the fibers and consequently the nonlinear behavior of the composite (e.g. [Morscher (1997), Bertrand et al. (2001)]).
In this multi-scale framework, one goal of the modeling efforts is to get a better understanding of interactions between the various microscopic damage mechanisms as well as their impact on the macroscopic behavior of the minicomposite. Thus, micromechanical approaches are appropriate to provide information about both the macroscopic response and the damage state of the minicomposite from basic characteristics of the constituents and their interfaces. In the case of Ceramic Matrix Composites (CMC), unidirectional probabilistic approaches have been mainly developed.
Damage modeling in CMC requires describing fiber sliding along the damaged fiber/matrix interface resulting from a crack deviation. This issue was addressed in many cases using shear-lag analysis, based on analytical description of stress profiles. Interface behavior in CMC is generally characterized through two parameters [Evans and Zok (1994)]: the interface fracture is supposed to involve a debond energy [He and Hutchinson (1989), Hutchinson and Jensen (1990)] and the sliding along the damaged interface is controlled through an interfacial shear stress that can be described at various degrees of approximation. For instance, some extended modeling, as proposed by [Shetty (1988)] and [Weihs and Nix (1991)], take into account effects of the fiber radial expansion using Coulomb friction laws. Though, the simplest model that assumes a constant shear stress τ is widely used to describe sliding along the debonded interface in CMC and in particular in SiC/SiC composites [Lissart and Lamon (1997), Curtin et al. (1998), Sauder et al. (2010), Castelier et al. (2010)]. Moreover, most 1D probabilistic models usually neglect the interfacial debond energy [Curtin (1993b), Guillaumat and Lamon (1996), Ahn and Curtin (1997), Morscher and Martinez-Fernandez (1999)].
Given damage chronology in CMC, involving most of matrix cracking at low stresses and fiber breaking at high stresses, most existing models separately consider these two fundamental damage regimes. Multiple cracking process is usually described by successive matrix breaks producing matrix fragments (delimited by two successive cracks) that become smaller and smaller as the matrix stress is rising. As usual in brittle material fracture, matrix breaks are based on a spatial distribution of flaws following a Weibull model [Weibull
(1951)]. Cracks population is also directly related to the damaged interface behavior through debond lengths. As recently analyzed by [Castelier et al. (2010)], models proposed in literature can be categorized within three approaches : continuous approaches (e.g. [Hui et al. (1995)]) which provide analytical results on infinitely long composites; and numerical random approaches that considers a fully discretized composite (e.g. [Baxevanakis et al. (1995)]), or a population of matrix fragments that become shorter and shorter (e.g. [Lissart and Lamon (1997)]). [Castelier et al. (2010)] showed that the three families of models tend to provide identical results as the composite become very long. All these modeling principles have been defined for the case of a microcomposite (containing a single fiber) and they are directly extended to minicomposites, neglecting the propagation of the matrix crack through the section of the minicomposite (despite experimentally observed [Chateau et al. (2011)]).
However, fiber breaking modeling is an issue specific to minicomposites because they contain a lot of fibers. So these breaks have consequences on the ultimate failure but also on the composite behavior. Similarly to matrix cracks, fiber breaks are driven by a distribution of flaws provided by Weibull’s model [Curtin (1991a), Neumeister (1993), Hui et al. (1995)]. Two main theories have been developed to model the mechanism of the stress redistribution from the broken fiber to others. First, some 1D models [Lissart and Lamon (1997), Lamon (2001)] used the classical fiber bundle assumptions (developed by [Daniels (1945)]) according to which once broken, a fiber does not participate anymore to the load transfer throughout the whole composite, and as a consequence breaks only once.
However, a fiber break characterization in SiC/SiC minicomposites (detailed in [Chateau et al. (2011)]) recently showed that a fiber can break several times. So observations are rather in line with other family of approaches taking into account a sliding length around a break necessary for the fiber to recover back its previously carried stress. Like multiple cracking process, those assumptions have been used both in random numerical models [Curtin (1993a), Baxevanakis et al. (1995), Ibnabdeljalil and Phoenix (1995), DiBenedetto and Gurvich (1997), Phoenix et al. (1997)] and analytical models [Curtin (1991b), Phoenix and Raj (1992), Phoenix (1993), Hild et al. (1994), Curtin et al. (1998)]. In such approaches, the main goal is, in general, to evaluate tensile strength of the composite, without describing the complete stress-strain response. So, simplifying assumptions are used, such as neglecting matrix stress, as cracking is supposed to be at saturation, and fiber stress oscillations due to the matrix cracks load sharing. Finally, [Curtin et al. (1998)] developed an analytical model to deal with interactions between matrix cracking and fiber breaking. While it gives access to a complete macroscopic behavior, this model does not provide data on distribution of damage mechanisms at local scale.
Therefore, to our knowledge, a complete model that provides both macroscopic behavior and statistical characterization of damage mechanisms at local scale, including both multiple cracking and fiber breaking, is not available. Here is developed such a 1D probabilistic modeling based on most classical assumptions detailed above. To do so, an improvement consists in establishing load transfer assumptions if matrix cracks and fiber breaks coexist. This stochastic numerical model is successfully compared to the analytical model proposed by [Curtin et al. (1998)] (section 4.3). However, the numerical model provides a more complete description of damage to be compared to experimental results. In addition, it is more flexible and allows an easy testing of some hypothesis modifications in order to improve the comparison at both macroscopic and local scales.
on average crack spacing at saturation, because of the lack of experimental characterization of damage phenomena. In fact, even if the qualitative damage evolution is accepted, observations reported in literature were limited to the sample surface and are mostly collected after the ultimate failure [Morscher (1997), Lissart and Lamon (1997), Bertrand et al. (1999), Martinez-Fernandez and Morscher (2000)]. Nevertheless, because it provides a microscopic description of damage (such as matrix cracks and fiber breaks spatial distributions or matrix crack opening), a characterization of damage mechanisms within the tow is essential to build and fully validate such a model, even at local scale. This is why two specific in-situ tensile tests, on Hi-Nicalon type S fiber-reinforced minicomposites, have been developed and used in this study, in addition to classical tensile tests on a macroscopic device. Scanning electron microscope (SEM) observations have been performed at several load levels in order to link cracking characteristics - such as initiation, opening and spacing of matrix cracks - to the macroscopic behavior. This test leads to statistical data about the cracking on a representative tow segment as a function of the applied load but it is not sufficient to fully characterize damage, in particular fiber breaking and matrix crack propagation. So it was complemented by an X-ray computed microtomography investigation to observe the propagation of matrix cracks [Chateau et al. (2011)]. In addition, radiographs observation provides statistical data on fiber breaking.
Thereby, this paper describes the whole approach from the experimental data collection (section 2) to the multi-scale identification and validation of the modeling (section 4), through the main features of the new complete model (section 3).
2. Experimental characterization
2.1. Minicomposites
All tested minicomposites came from the same batch. They were made out of a fibrous yarn composed of 500 Hi-Nicalon type S fibers [Sauder et al. (2010)], with an average diameter of 13 μm. The 100 nm pyrocarbon interphase and the SiC matrix were successively deposited on the fibers using the CVI process. Sections and fiber fraction were estimated for each tested minicomposite from polished cross-section SEM micrographs and are reported in Table 1. Because the effective section may vary from a specimen to another and even along one minicomposite (about 10% fluctuations), the macroscopic behavior of minicomposites will be characterized from force-strain measurements. Stress will be estimated from the mean section as an indication. There is also a residual porosity due to the CVI process within the minicomposite. Its mean volume fraction is estimated at 0.12. However, as shown by 3D images [Chateau et al. (2011)], the shape of porosity does not evolve that much along the fiber direction. So it does not significantly affect local strain in the composite under axial loading. Therefore porosity will not be taken into consideration in this study.
Table 1 : Microstructural and mechanical properties of studied SiC/SiC minicomposites
Sectiona (mm²) 0.097 0.007 Fiber volume fractiona 0.66 0.06 Young modulusb (GPa) 350 34 Strain to failureb (%) 0.7 0.07 Failure forceb (N) 115 6 Crack spacingc (µm) 315 70 Mean fiber pull-outd (µm) 560 100
a
Without porosity. b Estimated from four macroscopic tensile tests. c At saturation, estimated from four macroscopic, four SEM and one tomography tensile tests. d Estimated from macroscopic and tomography tensile tests.
2.2. Macroscopic tensile test
2.2.1. Procedure
Minicomposites have an elastic damageable behavior. The macroscopic response of the studied batch was characterized from uniaxial tensile tests, similar to tests detailed by [Sauder et al. (2010)]. Four tests were performed at room temperature under a constant displacement rate (0.03 mm/min). The load was measured using a 500 N load cell. Minicomposites global strain was calculated from grip displacement taking into account the system compliance. Both minicomposites ends were glued into metallic tubes – themselves gripped into the testing machine – so as to have a 25 mm gauge length.
2.2.2. Main results
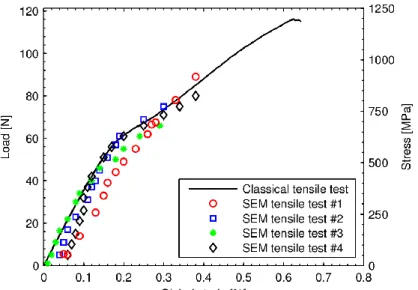
As observed on the force-strain curve given in Figure 1 obtained with one of the tested samples, the macroscopic behavior of minicomposites follows typical successive steps, which are consistent with former macroscopic observations [Bertrand et al. (1999), Sauder et al. (2010)]. They are usually associated with damage mechanisms. The first step is an elastic domain of the minicomposite behavior: no cracking occurs. A second nonlinear step is associated with the matrix cracking. Because of the debonding at the matrix/fiber interface, it is generally assumed that matrix cracks do not propagate to fibers. Once saturation of crack number density is reached (for a total strain of about 0.3%), a second linear domain associated with the additional elastic deformation of fibers is observed. The final step is characterized by a slight nonlinearity usually associated with fiber breaking just before the ultimate failure. Main mechanical characteristics measured on the studied batch are reported in Table 1.
Figure 1 : Macroscopic tensile behavior obtained with the macroscopic device and the SEM in-situ device (load levels at which the tensile tests were interrupted for the SEM observations
are reported)
Because most matrix cracks are closed after failure, a chemical attack using Murakami’s reagent was necessary to detect and locate them. Thus, matrix fragment lengths at saturation have been characterized (Table 1).
2.3. In-situ SEM tensile test
2.3.1. Procedure
In-situ tensile tests were carried out on minicomposites using a specific tensile testing machine available at the Solid Mechanics Laboratory (Ecole Polytechnique, France) and designed to load samples inside a Field Emission Gun Scanning Electron Microscope (FEG-SEM). Both sides of the sample were glued into aluminum tabs. Unlike macroscopic tests, the sample is loaded horizontally. So, the specimen was loaded through pins mounted in the grip regions and a guidance piece was added to the device in order to ensure a good alignment and make the mounting easier (Figure 2a). Specimens had a 25 mm gauge length and applied load was measured using a 100 N load cell.
The tensile test was interrupted at various loads until the ultimate failure. As shown in Figure 3a, cracks appear straight in the transverse direction and are easy to locate as the minicomposite is under tension. Thus, at each step, the location of each new crack was reported alongside the observed length. The study was focused on the central part, 16 mm in length, of the sample (Figure 2b), which allowed the observation of a significant number of matrix cracks. Matrix cracks opening was measured from high magnification FEG-SEM images using an automatic procedure. It is based on the detection of the crack width for each row of pixels of the image by thresholding the grey levels (see Figure 3b). The threshold is adjusted for each row of the image. The crack opening is defined as the average of the twenty highest measured widths. The only relevant errors using this procedure were a few overestimates of the opening in case of dark artifacts in the picture. These overestimates were so large that they could be easily identified and were manually corrected.
Figure 2 : (a) Picture of a sample in the SEM device (b) SEM image of the loaded minicomposite with the reference tube.
Figure 3 : (a) SEM micrograph of a cracked minicomposite under tension (75 N) (b) high magnification FEG-SEM image used to measure crack opening.
Global strain of the sample was estimated using SEM observations by measuring distance from minicomposite surface details to the ends of a rigid reference tube, at each side of the gauge length (Figure 3b). Note that, because of very small values of strain, measurements are very sensitive to displacement of the sample that self-aligned at lower loads. So strain measurements are only used indicatively to validate these in-situ tests at the macroscopic level.
2.3.2. Main results
In-situ tensile tests were conducted on four minicomposites. While macroscopic behaviors, reported in Figure 1, are in good agreement with the response obtained using the macroscopic device, they revealed slight premature failures (from 70 N to 100 N). This phenomenon has not been fully explained yet. It was already observed by [Michaux (2003)] during similar tests on C/SiC minicomposites and attributed to fibers fatigue during observation steps. Nevertheless, these tests are representative of the major part of SiC/SiC minicomposites behavior, especially the matrix cracking we are interested in.
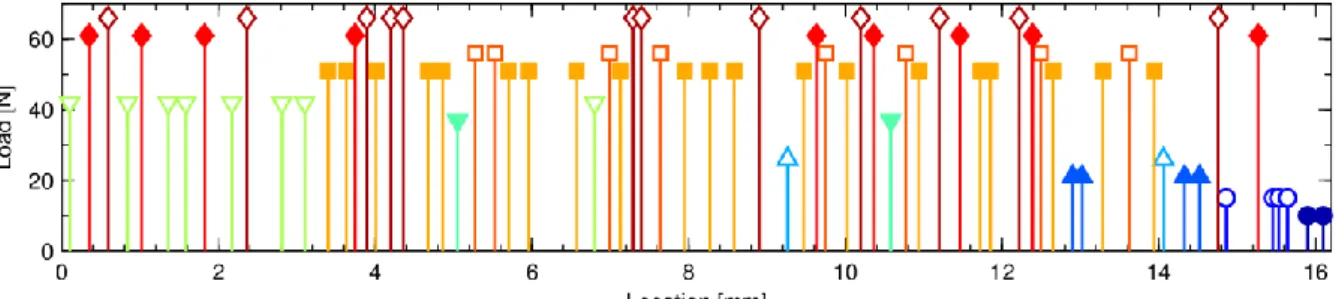
Thus, as illustrated in Figure 4, matrix cracking could have been characterized both in terms of its chronology and its spatial distribution. In fact, even if most cracks appear during the non-linear part of the macroscopic response (between 40 N and 75 N), a few of them are observed at lower or higher loads. Note also that, mainly at the cracking first stages, cracks appear in groups located in various healthy parts of the minicomposite. Beyond these qualitative observations, statistical data such as distribution of matrix fragment length at saturation could directly be measured.
Figure 4 : Matrix cracking chronology and spatial distribution (test #4). Each line stands for a crack associated to the load level at which it was observed for the first time (markers differ
regarding load levels).
Finally, cracks opening evolution has been quantified using the automatic procedure detailed above. Openings of cracks distributed into three regions about 2 mm in length each, for the first three tests, were measured. The evolution of all cracks has been observed during test #4. Global evolutions of opening, with respect to the applied load, were consistent between all tests. In particular, openings ranged from about 0.1 µm to a few micrometers. These results are presented with more details in section 4 together with the comparison to modeling results.
2.4. In-situ microtomography
Because SEM tensile tests are not sufficient to fully characterize damage evolution – in particular matrix crack propagation through the minicomposite section and fiber breaking cannot be characterized from surface observation – they were complemented by an X-ray microtomography investigation performed on a minicomposite submitted to a tensile load. The experiment was conducted at the ESRF (European Synchrotron Radiation Facility, Grenoble, France). In order to observe both cracks and the microstructure of the tow, the highest resolution available on the ID19 beamline (voxel size of 0.28 μm, identical in all three directions) was used. All procedures and experimental results are detailed in [Chateau et al. (2011)]. A description of the tomography technique applied to the mechanics of materials may also be found in [Buffière et al. (2010)] for instance.
The main results that are relevant to the building and validation of the damage model are summarized here. 3D images of a minicomposite under several tensile loads were used to study the matrix crack kinetic through the section and showed a slow discontinuous propagation. These results are not reported here and can be found in [Chateau et al. (2011)]. In addition, observations using simple absorption radiography lead to statistically representative data on fiber breaking both in terms of break density and axial location. Indeed, it is an efficient way to locate fiber breaks along the entire sample (about 12 mm), thanks to a much faster acquisition time than tomography. Moreover, the resolution was sufficient to estimate fiber break openings.
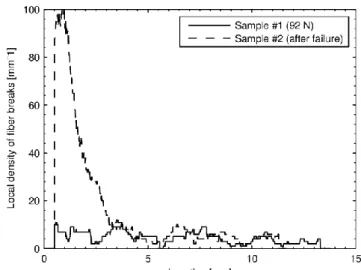
Such observations were performed on a minicomposite under a 92 N tensile load (i.e. 950 MPa, about 80 % of the stress to failure) and another one after failure. They revealed that fibers homogeneously fail at first (see local break density in Figure 5) at loads pretty lower than the ultimate failure one, and are typically located in the vicinity of matrix cracks. As also shown in Figure 5, the fiber break density observed at 92 N around 5 fiber failures per mm -barely evolves until the macroscopic failure, except in a restricted zone (a few millimeters in length) surrounding the failure location where the break number density is much greater. Fiber openings are also much larger in this area [Chateau et al. (2011)]. Additionally, note
that the first fiber breaks observed with 3D tomography appeared at 80 N, which matches the final stage of matrix crack propagation inside the minicomposite.
Finally, radiograph observation of the entire sample at 92 N provides additional data to estimate the mean distribution of matrix fragment length at saturation, together with the distribution of fiber break openings, which range from 1 µm to 8 µm approximately.
Figure 5 : Fiber break local density as a function of the location along the minicomposite. For sample #2, the location is given from the ultimate failure zone. The local density was
computed over a 1 mm moving window.
3. Unidirectional damage modeling
This section describes the main features of the model proposed to predict the evolution of damage within a minicomposite, i.e. at local scale, and its effect at the macroscopic scale. A 1D probabilistic approach is derived from existing modeling tools that are extended to describe both matrix cracking and fiber breaking in a single model. It is based on a random strength approach (following [Castelier et al. (2010)]) using a uniaxial discretization of the composite. Albeit numerically involved, this method seems to be appropriate to minimize approximations.
3.1. Framework
The model considers (N+1) 1D phases in parallel representing N identical fibers and the matrix. Each phase of length L is divided into a large number of short segments of length ΔX. Cross-sectional areas ( for the matrix and for the fibers, i.e. , where is the fiber radius) and Young moduli ( and ) are supposed to be invariant along the minicomposite axis.
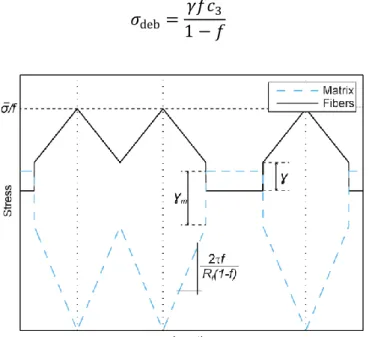
The model describes the local state of the minicomposite under an overall load , corresponding to the overall stress ̅ ( ). The local state is described by stress profiles in the matrix and in each fiber (where stands for the fiber indice). They are calculated in each segment using specific hypothesis if it is located in the vicinity of a matrix crack or of a fiber break. A matrix crack (resp. a fiber break) is represented by a matrix segment (resp. fiber segment) that is assumed to be broken. As illustrated in Figure 6,
damaged lengths are defined in the vicinity of each broken segment to indicate areas where the interface is sliding because of the matrix crack (or the fiber break). The set of damaged lengths in the matrix (resp. in a fiber ) is denoted (resp. ). Matrix segments (resp. fiber segments) located in damaged lengths are called damaged matrix (resp. damaged fiber). Elsewhere, matrix and fibers are called intact matrix and intact fibers.
In the following, stands for the number of intact fiber and stands for the set of damaged fibers at the location . Because all fibers have the same radius, the stress is identical in all intact fibers and is denoted .
Figure 6 : Diagram of damaged lengths (hatched areas) in the matrix (in white) or in a fiber (in grey), around a matrix crack or a fiber break.
Thus, we describe in this section 3 how stress profiles are determined along the whole length
L. In damaged lengths, the model uses the characteristics of the sliding interface and the
global static equilibrium. Elsewhere, the perfect interface coupling lead to the strain continuity (where and stands for the local strain in the matrix and fibers). So stress can be fully determined using the static equilibrium.
Note that both coefficients of thermal expansion of the third generation Hi-Nicalon S fibers and of the CVI SiC matrix are very close. Therefore, residual stresses induced by the thermal expansion difference are really low especially compared to stress levels that may be reached in the minicomposite. Indeed, the thermal residual stress parameter defined below [Curtin et al. (1998)] has been estimated at less than 10 MPa.
(1)
is the fiber volume fraction and ∫ stands for the mismatch strain between matrix and fibers due to temperature decrease from the stress-free temperature (≈1000°C) to the operating temperature (≈20°C). The evolution with temperature of the coefficients of thermal expansion and have been taken from [Sauder et al. (2010)]. As section 4.3 will show, the effect of such thermal stresses on the macroscopic behavior is very slight, so it will be neglected in the presented model.
3.2. Strength distributions
A strength is randomly assigned to each segment of volume (where subscripti refers
( ) [ ( ) ] (2) where is the Weibull modulus, is the scale factor and the reference volume taken to be 1mm3 all along this paper.
The statistical nature of this approach is based on this initial assignment of random strength. The further evolution of the model is strictly deterministic. In fact, a matrix crack (resp. fiber break) appears in a matrix segment (resp. fiber segment) once its stress reaches its initially defined strength.
3.3. Stress distribution
Stress profiles in matrix and fibers are related to the global load applied to the composite and to its damage state.
3.3.1. Stress profiles in damaged lengths
At each matrix crack (resp. fiber break) location, the matrix stress (resp. the stress of the broken fiber ) drops to zero. Following the assumption of a constant interfacial shear stress for the damaged interface, the matrix stress (resp. the fiber stress ) linearly rises either side of the break to recover its previously carried stress far away from the break. The slopes of the stress profiles along with the sliding interface are defined from the static equilibrium of an infinitesimal slice that leads to the following differential equations [Hutchinson and Jensen (1990)] :
{ |
|
around a matrix crack at |
|
around a fiber break at
(3)
The damaged length is defined as the length necessary to recover the so-called intact matrix (resp. fiber) stress (i.e. where the interface is undamaged). As commonly recognized by several authors [Curtin (1991a), Hui et al. (1996), Castelier et al. (2010)], the matrix (resp. broken fiber) stress profile cannot increase anymore along the damaged length, so no new crack can appear in this zone.
If two matrix cracks are close, damaged length may overlap. Then the matrix stress is defined as the minimum stress of independent profiles, i.e. stress profiles that would be established if both cracks were supposed to be isolated (see Figure 7). Stress profiles of broken fibers are determined the same way if two breaks overlap.
As established by [Hutchinson and Jensen (1990)], in the case of matrix cracks only, a jump in the fiber stress at the debond tip is defined to account for the interface mode II fracture energy (see Figure 7), according to
( ) (4)
(1990)]. The corresponding jump in the matrix stress profile is given in equation (5) from the global equilibrium.
(5)
Thus the damaged length does not progress before the overall stress reaches the stress level
defined below [Hutchinson and Jensen (1990)], i.e. a crack does not have any
consequence on stress profiles (and the macroscopic response) before the overall stress reaches .
(6)
Figure 7 : Example of stress profiles around three matrix cracks, taking into account the interface fracture energy through the stress jump (defined by [Hutchinson and Jensen
(1990)]
Finally, note that here the interphase is supposed to be globally fractured while deviating matrix cracks. Thus, fiber breaks are supposed not to involve interface fracture energy. If the damage chronology was reversed, i.e. if fibers had broken before the matrix cracked, a jump in broken fiber profiles should have been used.
3.3.2. Load transfer
When moving away from a crack, the decrease in the matrix stress is fully transferred to all intact fibers. Likewise, the decrease in the fiber stress around a break is fully transferred to all other intact fibers, as well as on the intact matrix.
Note that this work is focused on the framework of the Global Load Sharing (GLS) according to which the stress is equally redistributed over all intact fibers in the cross section of the minicomposite. In fact, even though other models could be used because fibers are connected together through the matrix, GLS has proved to be good enough in CMC [Evans and Zok (1994), Lissart and Lamon (1997)], in particular for low interfacial shear stress [Curtin (1993c)].
profiles in the matrix and for each of the fibers are calculated at all locations by solving the static equilibrium of the considered cross section:
̅ [ ∑
] (7) with
(a) if , is given by equation (3) (b) if , is given by equation (3)
(c) if , and are linked by the compatibility equation:
(8)
In other words, the model is based on stress profiles (defined by equation (3)) in the vicinity of a matrix crack or fiber break. Other profiles are deduced from equation (7) whose unknown stresses are different whether the matrix is damaged, or the matrix is intact implying the use of equation (8). However, boundaries of damaged length directly depend on stress profiles in intact matrix and fibers, which also depend on the load transfer around a matrix crack or a fiber break. Consequently, a specific framework has been established to define damaged lengths when matrix cracks coexist with fiber breaks. This technical aspect is detailed in Appendix A.
3.4. Inputs-outputs
The unidirectional model has been implemented to describe the evolution of damage during a loading history split into constant load increment . In addition to material parameters (such as sections, Young modulus, interfacial parameters), random strengths are initially assigned to all matrix and fibers segments as described above in section 3.2. Stress profiles are determined at each load increment following strength distribution assumption presented above, leading to the detection and location of new matrix cracks and/or fiber breaks. A description of the algorithm is given in Appendix B, together with details about its accuracy. As a post-treatment, at each load iteration, the global strain of the composite ̅ is calculated as the mean strain of intact fibers:
̅ ∑ (9) At the local scale, matrix crack openings (where stands for the crack index) are computed by deducting the matrix strain from the intact fiber strain along their damaged length :
∑ ( )
(10)
The mean pull-out length on the fracture surface is also estimated by calculating the mean distance between the fatal matrix crack and the nearest fiber breaks.
4. Experimental identification and validation of the model
This section presents the identification of interfacial parameters and the model validation by comparing numerical results to experimental data at both local and global scales. Given that these observations showed that most of matrix cracks appear before the fibers fail, the identification method will be divided in two steps. Parameters relative to the matrix cracking will be defined before studying fiber breaking. Moreover, model results will be compared to those from the analytic model proposed by [Curtin et al. (1998)], validating its implementation.
4.1.Input parameters
Chosen geometrical parameters are the average measurements presented in section 2.1 and reported in Table 2. The fiber radius is supposed to be constant and is defined from the total fiber section and the number of fibers with √ .
Fiber properties, as the Young modulus, are derived from several tensile tests on a single fiber [Sauder and Lamon (2007), Colin and Gélébart (2008)]. Weibull parameters (Table 2) have been identified from fracture data of about fifty tensile tests. Failure probabilities have been evaluated using the classical estimator , where stands for the samples number and is the rank of the i-th strength, sorted in ascending order. Matrix Young modulus has been evaluated from tensile test on microcomposites [Michaux et al. (2007), Colin and Gélébart (2008)]. Concerning matrix failure probabilities, experimental results obtained by [Michaux et al. (2007)] on matrix-dominated microcomposites which exhibit a brittle behavior (a single carbon fiber with a thick SiC matrix deposited by CVI) are used.
Table 2 : Fixed input parameters for the SiC/SiC minicomposite
Parameter Matrix Fibers Volume fraction 0.34 0.66 Section (mm²) 0.033 0.064
Number - - 500
Young modulus (GPa) 404 354 Weibull modulus 4.6 6.3 Scale factora (MPa) 278 1217
a
=1 mm3
Different approaches are proposed in the literature to evaluate interfacial parameters and . They are based on the interpretation of cyclic tensile tests performed on minicomposites [Lamon et al. (1995), Sauder et al. (2010)] or on indentation procedures [Marshall (1984), Chandra and Ghonem (2001)]. However, few results are available for the studied SiC/SiC composites and uncertainty is too high to consider such data as known input parameters. For information purposes, the interfacial shear stress magnitude was estimated this way at 10 MPa by [Sauder et al. (2010)] for similar minicomposites. Moreover, because these composites may be classified as Small Debond Energy composites [Evans and Zok (1994)], the interfacial debond energy is usually neglected in unidirectional modeling. Consequently, interfacial parameters are here identified to fit experimental data.
4.2.Interfacial parameters related to matrix cracking
The identification approach of interfacial parameters and is developed into two steps. Initial ranges are determined for both parameters from openings of isolated cracks, i.e. without overlapping damaged lengths of neighboring cracks. Then a set of parameters, included in these ranges, is proposed to fit experimental macroscopic response, as well as distribution of matrix fragment lengths and crack openings.
4.2.1. Identification based on opening measurements of isolated cracks
The model of interface debonding with constant friction established by [Hutchinson and Jensen (1990)] gives the pullout displacement of a fiber embedded in a brittle matrix. It has been expressed by [Marshall (1992)] as a function of interfacial parameters and and the overall stress ̅ applied on the fiber end:
{ [( ̅ ) ] ̅ ̅ (11)
where and are non-dimensional constants given in [Hutchinson and Jensen (1990)] as combinations of elastic coefficients (using type II boundary conditions having zero shear traction with constrained normal displacement), and ̅ .
This displacement corresponds to the half-opening of an isolated crack in the minicomposite under an overall stress ̅. Thus, this crack opening is linked to the applied load by a polynomial of degree 2, whose coefficients depend on and :
{ ( ̅ ) [ ] (12)
SEM observations showed a few cracks that are relatively far from their neighboring cracks (between 370 and 650 µm) compared to the mean crack spacing at saturation (315 µm). These cracks, which exhibit the widest openings, are considered to behave like isolated cracks. Polynomial regressions of the openings of nine of such cracks (among which five are reported in Figure 8) give an estimate of consistent set of parameters, where ranges between 2 and 3 MPa and ranges between 150 and 300 MPa.
Figure 8 : Polynomial regressions on openings of almost isolated cracks (for the sake of clarity, four crack openings, which nearly superimpose the five reported cracks, are not
presented)
4.2.2. Multi-scale validation
Numerical simulations were run with several pairs of interfacial parameters ( , ) and stopped once the cracking saturation was reached. The fiber strengths were arbitrary raised to avoid fiber breaks. The stabilized mean result of 10 simulations, with =25 mm, =5 µm and =1 N, was compared to experimental data.
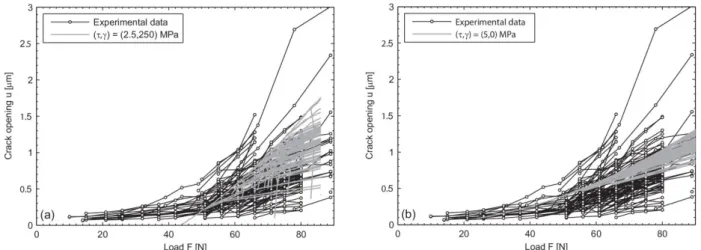
To simplify the identification process, the parameter was fixed to 250 MPa, in agreement with the identification from isolated crack openings (see section 4.2.1) and with the macroscopic limit of linearity experimentally observed around 450 MPa (see equation (6)). Thus, the best fit between numerical and experimental results was obtained with =2.5 MPa. Indeed, as presented in Figure 9 to Figure 11a, the model predicts the curvature of the macroscopic response as well as the matrix fragment lengths distribution at saturation and crack openings. The cracking chronology is also in consistency with SEM observations: it mainly occurs between 40 and 75 N, with the appearance of a few cracks from 20 N to 100 N. However, the model, that takes the interfacial debond energy into account, makes it impossible to open cracks at low loads. This small discrepancy is not important because these openings are measured to be very small. Note that other pairs of interfacial parameters, in the same order of magnitude (like =3 MPa and =220 MPa), may lead to a similar agreement with experimental data.
The best agreement using the usual assumption =0 is reported in figures 9, 10 and 11b with =5 MPa. Rising to 7 MPa would lead to a better match regarding the mean crack spacing at the expense of a stiffer behavior and lower crack openings. Nevertheless, results assuming =0 are less satisfactory than assuming , regarding both the macroscopic behavior and the distribution of cracks openings.
Finally, as presented in section 2.3.2, locations of all cracks during a tensile test, for each stress level, are available after the SEM characterization. This information can be enforced in the numerical model for matrix fracture instead of the statistical evolution based on the Weibull law. This approach allows us to study effects of interfacial parameters regardless matrix strength. Doing so, the results based on experimental data from test#4 and using =5
MPa and =0 showed that 30% of crack locations are inconsistent with resulting debond length: in other words, 30% of cracks were located in the debond length surrounding of a crack that appeared previously. On the contrary, this number of inconsistent crack locations falls down to 6% using =2.5 MPa and =250 MPa. This set of parameters lead also to a better agreement regarding the distribution of cracks openings. These results are independent of matrix strength distribution and confirm the use of a nonzero interface debond energy. Moreover, although it could seem high and it has an significant effect, a stress jump of 250 MPa corresponds in this case to a quite small interface energy release rate , which is estimated at 0.74 J.m-2 using equation (4).
Figure 9: Predictions of macroscopic behavior for two pairs of interfacial parameters (mean result of 10 simulations with =25 mm). Only the beginning of the curve is considered (until
saturation) and fiber breaking is arbitrarily avoided.
Figure 10: Predictions of matrix fragment length distributions at saturation, for two pairs of interfacial parameters (mean result of 10 simulations with =25 mm).
Figure 11: Predictions of matrix crack opening for two pairs of interfacial parameters: an interface debond energy is taken into account (a) or not (b).Openings of cracks from one
simulation (with =25 mm) are reported.
4.3.Comparison to analytical model and discussion on fiber strengths
4.3.1. Initial parameters
Once interfacial parameters have been identified on matrix cracking, the modeling was computed until the composite collapsed using experimental probabilities of fiber failure. The results of this numerical model are also compared to those obtained from the analytical model proposed by Curtin et al. [Curtin et al. (1998)]. The comparison of macroscopic behaviors is presented in Figure 12 for the two sets of interfacial parameters P0 and P1 identified above (matrix Weibull parameters remain the same as in Table 2). Those parameters are listed in Table 3, including specific parameters used in the analytical model. In fact, Curtin et al. defined specific parameters and related to Weibull parameters of matrix and fibers and to interfacial parameters in equations (13) and (14). The minimum cracking stress was assumed zero, like in the numerical model.
̅ [ ] (13) (( ) ) (14)
with ̅, linked to through equation (6).
It is noted that the application of this analytical model is doing using equations (15) and (16) to compute the macroscopic strain due to matrix cracking where stands the debond length and ̅ for the average crack spacing at the applied stress ̅ (see [Curtin et al. (1998)]). These equations were obtained from the works of [Ahn and Curtin (1997)], that were extended to take into account, and were used instead of equations No.6 and No.7 proposed in [Curtin et al. (1998)].
̅ ̅ ̅
Table 3 : Sets of parameters used to compare the numerical model to the analytical model from [Curtin et al. (1998)] and results. Final crack spacing ̅ and mean pull-out length
are estimated from both models.
Parameters Results
a ̅
(MPa) (MPa) (MPa) - - (MPa) (MPa) (µm) (mm)
Curtin Num Curtin Num
P0 5 0 680 1.8 6.3 1217 3911 410 396 1.2 0.5 P1 2.5 250 636 1.96 6.3 1217 3557 329 330 2.1 0.9 P2 2.5 250 680 1.96 3 250 2630 329 332 1.6 0.8
a The crack spacing parameter is defined in [Curtin et al. (1998)] and derives here from final
crack spacing estimated with the numerical model (without any fiber break). Its value for parameters P0 is in agreement with the one given in [Curtin et al. (1998)].
First, it should be noticed that the numerical model is in good agreement with the analytical model in average. However, Figure 12 shows that loads to failure predicted by the analytical model are a bit lower than those predicted by the numerical model. This difference is due to the residual matrix strain after matrix crack saturation that is neglected in the analytical model but not in the numerical model. Average crack spacing at saturation is also consistent between the two models. Although trends of mean pull-out lengths are similar, lengths predicted by the numerical model are smaller than those by the analytical model. This discrepancy is for now attributed to the strain localization [Curtin (1993a)] that is evidenced by the numerical model around the fracture surface (it will be illustrated in section 4.4.2).
Furthermore, the analytical model allows the inclusion of residual thermal stresses. Then, Figure 12 shows that assuming a nonzero thermal stress ( =20 MPa, defined in equation
(1)) has no noticeable effect on the macroscopic behavior. So the previous hypothesis to neglect thermal stresses, developed in section 3.1, can be considered to be valid for these SiC/SiC minicomposites (with Hi-Nicalon type S fibers).
Even so, Figure 12 shows that both models predict an ultimate failure load far too high with initial parameters (P1). Actually, the experimental response deviates from the expected evolution, based on the assumption that the tangent modulus should tend to , once fibers only carry the load after cracking saturation and before fibers start to break [Aveston et al. (1971), Evans et al. (1994)]. On the contrary, as presented in Figure 13, the simulated tangent modulus tends to the theoretical value and drops only after 125 N when fibers break. Underestimates of the simulated modulus reduction have already been reported in literature [Beyerle et al. (1992), Spearing and Zok (1993), He et al. (1994)] about other SiC fibers based composites and have been attributed to the lack of fiber breaks. Our experimental results are in agreement with this interpretation, following Figure 14 that shows that the predicted fiber break density (at 92 N) is far too low compared to the observed one. Finally, note that predicted pull-out lengths for =2.5 MPa (Table 3) slightly over-estimates experimental observations (Table 1), especially the analytical model.
̅ ̅
̅
So, one main conclusion of this work is that modifications of fiber parameters or of some model hypothesis are necessary to introduce fiber break earlier in order to match experimental observations.
Figure 12 : Comparison of macroscopic behavior from the numerical model and the analytical model (as defined by [Curtin et al. (1998)] with and without neglecting thermal
stresses) to the experimental data.
Figure 13 : Evolution of macroscopic tangent modulus from numerical simulations for two fiber strength distributions and comparison to experimental data.
Figure 14 : Prediction of mean fiber break density by the numerical model, for two fiber strength distributions, and comparison to the experimental measurement.
4.3.2. Degradation of fiber strengths
Modifying fiber strengths is the usual solution to have a lower composite strength, assuming that fibers could be weakened during processing (at ≈1000°C). A good macroscopic match is presented in Figure 12 with much lower fiber strengths (parameters P2 in Table 3). The corresponding probability density function of strengths is given in Figure 15. Although load to failure and tangent modulus are better reproduced, fiber break density is twice as high as experimental expectations, as illustrated in Figure 14. Above all, a so important degradation is not expected for Hi-Nicalon type S fibers. In fact, these near-stoichiometric and highly crystalline fibers exhibit a far better thermal stability than first generation fibers (Nicalon and Hi-Nicalon fibers). Initial strength has been observed to be retained up to 1200°C at least [Takeda et al. (1998), Sha et al. (2004)]. Additional tests have been performed after heat treatment corresponding to CVI conditions (2 hours at 1000°C) and confirmed the thermal stability (Sauder and Buet, unpublished communication). Moreover, fiber surface is quickly protected by PyC, which minimizes chemical degradation. So, in addition to failing to match experimental results at local scale, fiber strength degradation necessary to have a correct composite strength is too strong to be reliable. Additionally, introducing initial damage following analytical model proposed by [Curtin and Zhou (1995)] would also fail to fully predict the macroscopic behavior. Too much damage would be needed to sufficiently reduce the ultimate tensile strength, which would generate a too low tangent modulus. Furthermore, tomographic characterization did not show any fiber break from 50 N to 74 N along the observed field of view [Chateau et al. (2011)].
Figure 15 : Probability density functions of tested Weibull distributions for fiber strengths. Probability densities are represented for the fiber volume , with L=25 mm.
Thus, other modifications of the model need to be considered, such as change on the interfacial shear stress, use of bimodal strength distribution or introduction of unpredictable features. The model developed by Curtin et al. cannot address these ones unlike the numerical simulations presented here.
4.4.Modifications related to fiber breaking
In order to improve the comparison to experimental observations, modifications of some of the model features are considered. As mentioned in section 3.3.1, the interface behavior related to fiber breaking is only characterized by the interfacial shear stress. At first, this parameter is supposed to be identical for both matrix cracking and fiber breaking. Then, a dissymmetry is introduced as the only way to reproduce experimental results. Finally, the model is complemented by the addition of early fiber breaks, assumed to come from matrix cracks propagation, and validated at both macroscopic and microscopic scales. The results of each identification steps are compared to the experimental macroscopic response (force-strain curve in Figure 16) and to the measured fiber break density (Figure 17).
4.4.1. Identification of a specific interfacial shear stress
The first change consists in modeling a matrix crack deviation along multiple matrix/fiber interfaces differently from modeling a fiber break along a single interface. In fact, as illustrated in Figure 12, a decrease in lead to a lower composite strength. To do so, the interfacial shear stress related to fiber break deviation is distinguished from the one associated to matrix cracks . The latter was previously identified and remains unchanged. Before identifying , edge effects should be mentioned. In fact, a decrease in the interfacial shear stress produces an increase in the damaged lengths that may be not negligible compared to the composite length , in particular at high load levels. Because both ends are subjected to the consequences of a damaged vicinity from one side only, they tend to be less damaged and the local strain is smaller than in the center of the composite. Thus, the total length has been chosen for the macroscopic response to be independent of the gauge length, in the range of
tested ( =75 mm). Note that this boundary effect has already been highlighted by Curtin [Curtin (1991a), Curtin et al. (1998)], who predicted a tensile strength with no dependence on gauge length as soon as it is longer than a minimum length. In addition, because of a longer gauge length, variability between simulations is very low, so from now on, one simulation only is sufficient to obtain a stabilized result to compare to experimental data (in order to decrease computer time without loss of accuracy, =10 µm is used).
As presented in section 2.4, experimental observations showed a fiber break density estimated at 5 breaks/mm for an applied load of 92 N, corresponding to ̅ 0.43%. So numerical simulations were computed with an artificial random insertion of the expected number of fiber breaks at 92 N (a less artificial and sharp way to introduce fiber breaks is discussed in section 4.4.2). Thus, fiber break density is in agreement with experimental results and the only free parameter available to fit the macroscopic behavior is . Several values were tested this way. The best one, =0.4 MPa, provided the expected global strain. Thus, any other value of turned out to make impossible the agreement between experimental and modeling results on both macroscopic behavior and break density at 92 N, regardless fiber strengths.
Furthermore, the complete model using =0.4 MPa, associated with the random insertion of fiber breaks at 92 N, predicts correctly the end of the force-strain curve (see Figure 16). Thereby, the decrease in the tangent modulus and the composite strength are well predicted thanks to the fiber breaks generated from the initial population added at 92 N.
4.4.2. Insertion of additional fiber breaks
Two main hypotheses have been challenged at first to explain the existence of the premature fiber breaks. First, fiber strength distribution was modified similarly to section 4.3.2. As presented in Figure 16, a good macroscopic result was obtained decreasing to 300 MPa with =2.5. Nevertheless, this Weibull distribution once again seemed not realistic with experimental expectations (see probability density function in Figure 15), in addition to lower prediction of fiber breaks at 92 N (Figure 17). The numerical simulations also allowed the use of bimodal probability laws [Chateau (2011)]. Although the ultimate tensile strength could be reduced enough with a small population of low strengths, the tangent modulus remains too high and strains too small (0.52% at failure instead of 0.65%). This macroscopic behavior is due to the local fiber break density which is too low. Increasing lowest strength weight would lead to a better agreement concerning the tangent modulus, but it would also lead to a far too low ultimate failure. Second, the Global Load Sharing hypothesis was changed into a simplified Local Load Sharing assumption. Following Calard’s works [Calard and Lamon (2004)], load was only transferred to the nearest intact fibers supposed to be arranged into a hexagonal array. But, this change only advanced the avalanche effect leading to the fatal failure of the composite.
Tomography observations suggested that first fiber breaks were observed in the vicinity of fiber breaks [Chateau et al. (2011)]. Moreover, their appearance matched matrix cracks propagation through the cross-section. So an additional hypothesis of dynamic effects due to crack propagation is finally considered.
The chosen approach to introduce fiber breaks due to the propagation of matrix cracks is assumed to be independent of local fiber failure probabilities. It involves three random aspects to model when, where and how many fiber breaks will appear, which are added to the initial steps of algorithm (Appendix B):
Overall load levels (called “propagation load”), which are aimed at modeling crack propagation, are randomly assigned to each matrix crack when it appears (step (3a) of the algorithm). They are normally distributed with a mean value of 76 N and a standard deviation of 3 N. In the case of a late crack that appears from 70 N, the propagation load is set to the current load, i.e. the matrix crack appearance load.
Just before the classical damage detection (step (3)), if one “propagation load” is reached, a fiber break is randomly added in the propagating crack vicinity (bounded at ±50 µm around the crack following tomography observations).
Each break generated from dynamic effects is supposed to have a 50% chance to generate another one, in the same crack vicinity. This way, one or more fiber breaks are added in cracks vicinity. Then, the load redistribution is computed as usual, taking these breaks into account, before running the damage detection (step (3)).
This approach allows for a smooth introduction of additional fiber breaks. Although its parameters are based on experimental observations, this arbitrary method should be improve by introducing more physical phenomena.
The 1D model thus modified provides a good prediction on the macroscopic behavior (Figure 16). In addition to reproducing the fiber break density at 92 N, the model predicts that the density remains almost stable between 92 N, and the avalanche effect leading to the ultimate failure (see Figure 17), which is in agreement with tomography observations (Figure 5). As presented in Figure 18, a localization of fiber breaks in a weaker area is also observed during the load increment leading to the ultimate failure, as observed experimentally.
Figure 16: Macroscopic behavior simulated with arbitrary addition of fiber breaks at 92 N, degraded fiber strengths ( =300 MPa, =2.5) and dynamic effects, comparison to
Figure 17 : Prediction of mean fiber break density with arbitrary addition of fiber breaks at 92 N, degraded fiber strengths ( =300 MPa, =2.5) and dynamic effects. All numerical
results assume =0.4 MPa.
Figure 18 : Prediction of the local fiber break density as a function of the location along the minicomposite, for the identified interfacial parameters ( =2.5 MPa, =250 MPa, =0.4
MPa) and dynamic effects, at three increasing load levels: 90 N, the last load increment before the ultimate failure ( ) and the load leading the ultimate failure ( ).
4.4.3. Limitations and additional directions to be explored
While no specific issue appears in validating matrix cracking modeling at the local scale, some shortcomings remain concerning fiber breaking. Because of the necessary low interfacial shear stress , some discrepancies reveal an overestimate of lengths over which the load is transferred around a fiber break.
Indeed, in addition to important gauge length effects, most of fiber break openings were evaluated (similarly to matrix cracks) between 20 µm and 50 µm at 92 N, although experimental observation did not show any opening wider than 10 µm [Chateau et al. (2011)]. The model predicts also mean pull-out lengths around 3.6 mm in average, which are well above observations (a few hundred micrometers, see Table 1). A higher (like the one estimated by unloading/reloading tests) would have led to smaller pull-out lengths but the
ultimate stress would have been too high, together with too low strains.
Therefore, further developments are needed to explain experimental observations, concerning both fiber strengths and stress recovery around fiber breaks. A complete characterization of fiber breaking chronology could be obtained from real-time radiography during in-situ tests, in order to describe premature failure and to check for initial damage. Additionally, fracture mirrors investigation of broken fibers [Stawovy et al. (1997), Sha et al. (2006)] should be performed to estimate in-situ fiber strengths and to confirm anomalous damage mechanisms. If break density under middle tensile load (after matrix crack saturation) are confirmed, stress recovery mechanisms for fiber breaking should be reconsidered to explain macroscopic strain, break density and fiber pull-out.
5. Conclusion
Original in-situ tensile tests were developed to study damage processes in SiC/SiC minicomposites, including matrix cracking and fiber breaking, to complement classical macroscopic and post-mortem techniques. Experimental results were used to build and validate a 1D probabilistic damage model. The approach is based on existing modeling tools, as Weibull failure probability laws and a stress redistribution assumption in the vicinity of matrix cracks and fiber breaks, which are extended to describe combined matrix cracking and fiber breaking in a single model. Besides, the benefit of this numerical model is to describe local damage mechanisms in terms of their distribution and not only in average. Moreover, fundamental hypotheses can easily be modified if necessary.
An identification method was proposed to fit interfacial parameters to get, besides the macroscopic behavior, matrix crack openings, distribution of matrix fragment lengths and fiber break density in agreement with experimental observations. It has been possible to identify parameters and to describe correctly matrix cracking using classical assumptions, from failure probability distribution and elastic properties experimentally evaluated.
Regarding fiber breaking, the model could not reproduce the end of the experimental force-strain curve without additional hypothesis. An asymmetry in the interfacial shear stress has been proposed, complemented by the addition of early fiber breaks. Thus, the identification approach evidenced that a proper description of damage mechanisms at the local scale, as the fiber break density experimentally observed, was essential to correctly predict the macroscopic behavior. Neither important degradation of fiber strengths, albeit unlikely, nor local load sharing assumption could lead to satisfying results at both scales. Thus an attempt to smoothly add random fiber breaks was proposed, based on the assumptions of dynamical effects of the discontinuous matrix crack propagation experimentally observed.
The final modeling provides good results on both macroscopic and microscopic scales, although debond length associated to fiber breaks seems to be overestimated. Yet, this is the only way to describe damage process with such a simple model. A better understanding of the composite behavior related to local parameters would probably need a more advanced model. Before any improvement, fiber breaking chronology needs to be characterized more precisely (real-time radiography, fiber fracture mirrors) to confirm premature failures and their potential link to the propagation of matrix cracks.
Appendix A. Definition of damaged lengths
As presented in the main text (section 3.3), a specific framework is needed to define damaged lengths around matrix cracks and fiber breaks which can coexist. For the sake of clarity, this framework is illustrated in Figure A.1with a simple example of a short composite damaged by a matrix crack (located at ) and the fiber broken at the location (where parameters were chosen to emphasize load transfers).
First, matrix cracks and fiber breaks are considered separately to determine reference stresses in intact matrix ( ) and fibers ( ) (see Figure A.1a).
To do so, on the one hand, only matrix cracks are taken into account. Matrix damaged lengths are defined from the slope given in equation (3), the jump discontinuity (equation (5)) and the undamaged matrix stress resulting from the basic equilibrium applied to an undamaged composite:
{
̅
(A.1)
The reference stress in fibers that are supposed to be intact, resulting from the load transfer, comes from equation (7).
On the other hand, only fiber breaks are taken into account. Fiber damaged lengths are defined from the slope given in equation (3), and the undamaged fiber stress (equation (A.1)). The reference stress in the matrix that is supposed to be intact, resulting from the load transfer, comes from equation (7).
Second, as presented in Figure A.1b, “real” damaged lengths for both matrix cracks ( ) and fiber breaks ( ) can be defined relatively to the reference stresses and .
Finally, stress profiles in intact matrix and fibers are calculated according to equations (7) and (8) (see Figure A.1c).
Note that interactions between matrix cracks and fiber breaks are taken into account to define damaged length, but fiber breaks interactions between one fiber and another are neglected. Indeed, the high number of fibers should minimize this effect. Moreover, this approximation is necessary to have an efficient algorithm based on a single iteration.
Figure A.1: Diagram of load transfers around a matrix crack ( ) and a fiber break ( ) in the fiber : (a) calculation of reference stresses in intact matrix and fibers (b) definition of damaged lengths around the matrix crack and the fiber break (c) calculation of stresses in