HAL Id: hal-01626703
https://hal.archives-ouvertes.fr/hal-01626703
Submitted on 23 Feb 2018
HAL is a multi-disciplinary open access
archive for the deposit and dissemination of
sci-entific research documents, whether they are
pub-lished or not. The documents may come from
teaching and research institutions in France or
abroad, or from public or private research centers.
L’archive ouverte pluridisciplinaire HAL, est
destinée au dépôt et à la diffusion de documents
scientifiques de niveau recherche, publiés ou non,
émanant des établissements d’enseignement et de
recherche français ou étrangers, des laboratoires
publics ou privés.
Mixing of a wet granular medium: Influence of the liquid addition method
R. Collet
a,b,⁎
, D. Oulahna
a, A. De Ryck
a, P.H. Jezequel
b, M. Martin
baRAPSODEE FRE-CNRS 3213, École des Mines d'Albi, Campus Jarlard, 81013 Albi, France bLAFARGE Centre de Recherche, 95 rue de Montmurier, BP15, F38291 St Quentin Fallavier, France
a b s t r a c t
Keywords: Mixing
Wet granular medium Liquid addition method
Mixing is an important operation in the elaboration of concrete. This process generally involves high energy consumption. The method by which the liquid is added influences this consumption. The liquid can be added progressively with a constant flow, instantaneously at the beginning of the mixing process, or in several stages. Our results show that the power usually consumed with a progressive liquid addition can be reduced by adding liquid in several stages, by modifying the number of additions and by varying the amount of liquid added for each addition.
For a final state mixture, oversaturated in liquid, instantaneous addition provides the lowest energy consumption. However, for a final state that is less saturated, the lowest energy intensity is obtained by adding the liquid in two stages. The first amount corresponds to a saturation rate located in the funicular regime, and is higher than the second amount.
Finally, for saturation states located before the capillary regime, a progressive increase in the energy signal is observed after an instantaneous addition of the liquid. Moreover, the capillary state is obtained using an amount of liquid for which this state is not usually reached by progressive addition. This phenomenon is more pronounced where the particle size is reduced and the rotation velocity increased.
1. Introduction
Mixing of wet granular media provides a homogeneous distribu tion of solids in the mixer and improves the wetting of the granular medium. However, it is a process that induces high energy consumption. In order to decrease the consumption intensity and the mixing time, a classification can be made of the factors (powders and liquid properties, process parameters) that have an effect on the inter particular forces (capillary, Van der Waals, gravitational, frictional and viscous forces, etc.)[1 3], and hence on the mixing efficiency. The liquid addition method is an influential process parameter.
In industry, the mixing of a concrete is carried out by adding the liquid in one stage, at the beginning of the process. However, the use of progressive addition, with a controlled flow, is worth studying because it leads to an increase in the time scale. The consumption intensity, represented as a function of mixing time or of added amount of liquid, allows for better observation of the different wetting states of the granular medium, and better characterization of the mixing behaviour (Fig. 1). The consumption intensity profile may be divided in five sections[4 6].
At the beginning of the mixing process (I), the first amount of liquid added is distributed at the surface of the particles without the formation of liquid bridges. Then, in the pendulary state (II), the liquid amount at the particle surface is high enough to form capillary bridges between them, while the medium becomes more cohesive and there is a rapid increase in energy consumption. During the funicular state (III), the porous volume of the previously formed agglomerates is filled by the additional liquid. In this state, the increase in the intensity is much lower because the majority of the capillary bridges have already been formed in the pendulary state. When the porosity in the agglomerates is completely filled by the liquid (end of III), the additional liquid forms new liquid bridges between agglomerates until the formation of a single agglomerate. This is the capillary state (IV), characterized by the appearance of a rapid increase in energy consumption (capillary peak). Finally, in the droplet state, the volume of liquid becomes higher than the bulk porosity of the granular medium and the energy consumption decreases.
The liquid can be added instantaneously or in several stages. In order to use corresponding liquid saturation rates for different solids, we introduced a dimensionless amount of liquid[7]:
π =r2−r1r−r1 ð1Þ
π is determined with the aid of the consumption intensity curve obtain with a progressive liquid addition (Fig. 1), for which “r” is the “liquid/solid” volume ratio, “r1” the “liquid/solid” volume ratio
corresponding to the beginning of the pendulary regime, and “r2” the “liquid/solid” volume ratio corresponding to the capillary state.
The first part of this paper present the results obtained with an instantaneous addition of liquid at the beginning of the mixing. Different amounts of liquid were used in order to mix a calcite powder. Then, different parameters were modified (average particle size and rotational velocity). The second part focuses on the addition of liquid in two stages. The liquid amounts used (volume 1+volume 2) allow different liquid saturation rates to be reached.
2. Experimental set up and materials
The mixer used was a planetary mixer from the CAD®Company
(Mlx60). It can be used to make a hard paste, and it allows the power consumption intensity to be recorded at a frequency of 10 points per second. The available rotation velocity is between 0 and 300 rpm and the volume of the bowl is 4 l. A preliminary study allowed the optimal process parameters to be set: an impeller speed of 120 rpm, a droplet by droplet liquid flow rate of 40 ml/min, and a filling rate of 1250 cm3
(volume of solids and inter particle porosity). The liquid was added using a peristaltic pump and a feeder pipe, 3 mm in diameter. Moreover, the necessary mass m of powder filling 1250 cm3 was
determined using the bulk density of the granular medium “ρ”, equal to the average of the aerated and tapped densities.
Materials used (Table 1) were calcites supplied by OMYA SAS. The volumetric granulometric distributions were obtained with a MALVERN Mastersizer 2000, the true density “d” of the solids with a helium picnometer (Accupyc 1330 Micromeritics), and the dry porosities by using the values of the true and bulk densities (ε = ρ δ). The liquid used for all the tests was water.
3. Results and discussion
3.1. Instantaneous liquid addition: calcites Durcal 15
After having mixed a dry powder of Durcal 15 for 100 s, the liquid was added in one stage and the mixing was maintained. The liquid
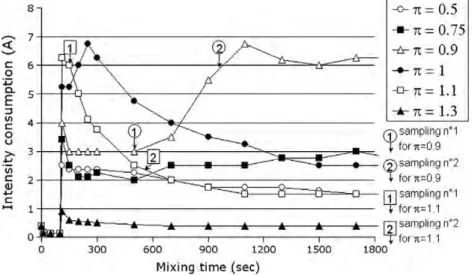
occurred for an equal amount of liquid added by progressive addition. Then, for π=0.5, the intensity remained constant during the mixing, probably because there was not enough liquid to observe an evolution of the system. On the other hand, for π=0.75 and 0.9, the intensity increased progressively during the mixing, this increase being higher as π tended toward one. In all cases, an instantaneous liquid addition to the Durcal 15 led to the obtaining of the capillary state for π=0.9, with a liquid amount lower than that required for progressive addition. Two hypotheses were proposed to explain this phenome non: After adding the liquid, the mixing time improves the liquid distribution in the granular medium and/or increases compacity.
If π≥1, after the initial peak corresponding in this case to the capillary state, the intensity decreased progressively before stabilizing at a level of an intensity which was lower when π increased, and also lower than for the same amount of liquid added with a progressive addition (40 ml/min). After adding the liquid, it is thought that the mixing time induces a better liquid distribution and/or a densification of the granular medium and may cause this phenomenon.
In order to study the densification hypothesis, the porosity of several dried (24 h, 50 °C) granular samples were measured. The samples were taken during the mixing to measure their porosity before (1) and after (2) the intensity variations, for the two cases corresponding to π=0.9 and π=1.1 (Fig. 2). Using the methodology of Rondet [8,9], three different tubular samplers (1570, 2260 and 9120 mm3) were used to take the samples, and for every volume (V
T),
three samplings were carried out. The porosity of the granular bed ε was determined with the following equation:
ε = 1−WD
VT⋅d ð2Þ
WDis the weight of a dried granular sample (g) and d the true density
(g/cm3).
For π=0.9 and π=1.1, the granular bed porosities of sampling no 1 were similar, and equal to 38%. Samples no 2 also had identical porosities equal to 40%. Therefore, the granular porosity did not change between sampling no 1 and no 2 (Fig. 2). These results confirm the hypothesis of an improvement in liquid distribution. We have shown, in other papers[10,11], that the granular bed porosity of the Durcal 15 decreases considerably between π=0.75 and π=1 (the porosity decreases from 68 to 40%). So, the granular medium has already reached the minimum porosity for π=0.9 and the mixing time does not improve the porosity, but only affects the liquid distribution.
3.2. Instantaneous liquid addition: particle size effect
Three calcites “Durcals” with different average particle sizes (Table 1), Durcal 5, 15, and 65, were mixed with an instantaneous liquid addition (Fig. 3). For every Durcal, three dimensionless liquid amounts π were used: 0.9, 1.1, and 1.3.
For the saturation rate located after the capillary state, (π=1.1 and 1.3), the signals obtained are similar for the three Durcals, with a higher intensity when the particle size decreases[10].
For π=0.9 and for the three materials, the signal increases until the capillary state is reached (chapter 3.1), and this state is reached
Fig. 1. Consumption intensity of the Durcal 15 mixed with a progressive liquid addition (40 ml/min).
Table 1
Characteristics of the different solids used. d10 (μm) d50 (μm) d90 (μm) True density d Bulk density ρ (g/cm3) Porosity ε (%) d90 d10 d50 Mass used (g) Durcal 5 1 6 17 2.73 0.87 68 2.67 1083 Durcal 15 1.5 18 47 2.73 1.13 59 2.53 1416 Durcal 65 3 29 68 2.73 1.32 51 2.24 1655
faster when the particle size decreases. The mixing of the Durcal 5 cannot be maintained when the capillary state is reached because the strength of the medium is too great.
3.3. Instantaneous liquid addition: the effect of rotation velocity (60, 120, 180 rpm)
The Durcal 65 was used to study the rotation velocity effect during the mixing after an instantaneous liquid addition (Fig. 4). The liquid saturation states used were the same as those used in the last part of this paper: (π=0.9, 1.1 and 1.3).
First, for π=0.9, the increase in the rotation velocity induced an increase in the intensity and an earlier appearance of the capillary state. So, the increase in the rotation velocity improved liquid distribution kinetics. Moreover, for a low velocity (60 rpm), the capillary peak was not reached. However, the representation of these curves as a function of the number of rotations (Fig. 5) shows that the capillary state was obtained with the same number of rotations (around 3000) for the rotation velocities of 120 and 180 rpm. It could thus be understood why the capillary state was not reached with 60 rpm. For this velocity, the test was stopped before reaching 3000 rotations, because too long a mixing time (50 min) would have been necessary. Beyond 30 min of mixing, we could not be sure that the liquid amount was the same as at the beginning of the test, because of evaporation.
For πN1, the signals obtained for the three velocities were similar. Moreover, for π=1.1, the representation of the curves as a function of
the number of rotations showed that the increase in the rotation velocity induced the increase in the intensity.
3.4. Instantaneous liquid addition: conclusion
For a final state oversaturated by the liquid (π = 1.3), an instantaneous liquid addition induced lower energy consumption than with a progressive addition (decrease of 85%).
However, for the others amounts of liquid (πb1.3), this liquid addition method did not lead to a decrease in the consumption intensity. On the contrary, the maximum consumption intensity was equal or higher than with a progressive addition (Figs. 1 and 2).
So the tests were continued by adding the liquid in two stages, the first amount corresponding to a saturation rate located in the funicular regime, the second in the droplet state.
3.5. Liquid addition in two stages: π1+π2=1.3
Two dimensionless liquid amounts π1 and π2, corresponding to π=1.3 (π1+π2 =π), were added at various times to mix the Durcal 15 (Fig. 6). After the first liquid addition (at t=100 s), with an amount corresponding to a saturation rate located before the capillary state, (π1=0.2, 0.5, 0.85), the mixing was maintained during the necessary time to reach the same saturation rate as with a progressive liquid addition (40 ml/min). Then, the second liquid addition was carried out and the mixing maintained, as previously, to reach the oversaturated droplet state. The first addition of liquid induced an
Fig. 2. Consumption intensity of the Durcal 15 mixed with an instantaneous liquid addition at t=100 s.
Fig. 3. Consumption intensity of the Durcal 5, 15, 65 mixed with an instantaneous liquid addition at t=100 s.
Fig. 4. Consumption intensity of the Durcal 65 mixed with an instantaneous liquid addition and different rotation velocities: 60, 120 and 180 rpm.
intensity peak that increased if the added liquid amount increased. This peak was lower than the capillary peak obtained with a progressive liquid addition. After this initial peak, the energy signal stabilized at the same intensity as was observed for the same amount of liquid added with a progressive addition (Fig. 1). The second addition induced a rapid decrease in the energy consumption, without a capillary peak, whatever the amount of liquid added.
These tests showed that the addition in two stages of a liquid amount that caused over saturation of the granular medium “π=1.3”, induced a mixing energy consumption signal without a capillary peak. Moreover, the maximum energy consumption was reduced by the decrease in π1 and the increase in π2. However, for π=1.3, the addition of liquid in two stages appeared less worthwhile than instantaneous addition, because the consumption intensity was higher.
3.6. Liquid addition in two stages: 1b π1+π2b1.3
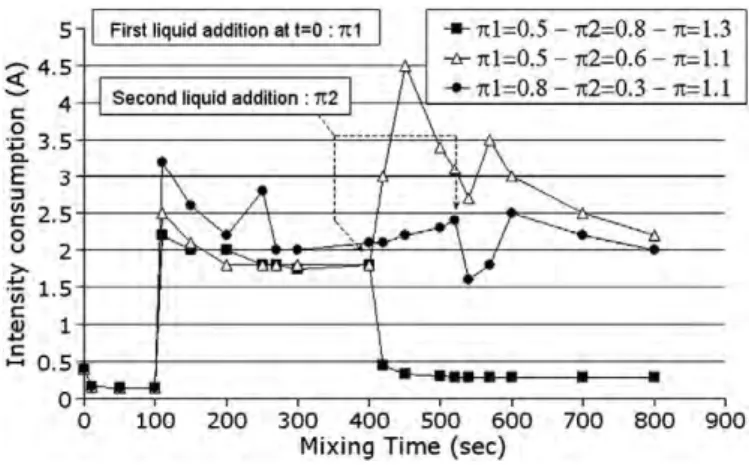
As previously, the Durcal 15 was mixed with a liquid addition in two stages, but with a total dimensionless liquid amount corresponding to a saturation rate located between the capillary state and the oversaturated droplet state (Fig. 7).
For the two first tests, the first liquid amounts were the same (π1=0.5), although they differed for the second (π2=0.8 and 0.6). After the second liquid addition, an intensity peak, characterizing the capillary state (peak amplitude: 3/4 of the peak obtained with a progressive liquid addition), appeared for the saturation rate closest to the capillary state (π=1.1). So when the saturation rate was closest
to the capillary state, the liquid distribution in the granular medium seemed to be less efficient, and an intensity peak appeared.
The third test resulted in a decrease in the energy consumption seen in the previous test (peak amplitude: 1/2 of the peak obtained with a progressive liquid addition) with the same final saturation rate (π=1.1). This result was obtained by decreasing the liquid amount in the second addition and by increasing the liquid amount in the first addition, in order to keep the total liquid amount constant. However, the first liquid amount needed to be kept low enough to avoid the first intensity peak being too high.
Thus, for a total dimensionless liquid amount corresponding to a saturation rate located between the capillary state (π=1) and the oversaturated droplet state (π=1.3), liquid addition in two stages allowed the energy consumption to be minimized. However, for the first addition, it is important to use a liquid amount corresponding to a saturation rate located in the funicular state, and higher than for the second addition.
4. Conclusion
The energy that is normally consumed during the mixing of a wet granular medium, with progressive liquid addition, can be reduced by using an addition in several stages and by adjusting the number of liquid additions and the amount of every addition.
For a final state that is oversaturated by the liquid (π=1.3), an instantaneous liquid addition induces a lower energy consumption than with a progressive addition (decrease of 85%).
The powder will be dispersed instantaneously in the liquid and the different liquid states are not visible on the energy consumption signal. On the other hand, for a total saturation rate located between the capillary state (π=1) and the oversaturated droplet state (π=1.3), the consumption intensity is minimized with a liquid addition in two stages. The liquid amount of the first addition must correspond to a saturation rate located in the funicular state and be higher than the second. In this case, the liquid amounts are not enough to over saturate the granular medium. Thus, after every liquid addition, the appearance of an intensity peak will characterize the difficulty the liquid volume is encountering in being distributed in the granular porosity. So, the peak intensity increases with the amount of liquid added.
These results were completed with an instantaneous addition (at t=100 s) of liquid amounts corresponding to saturation rates located before the capillary state. The main result was obtained for π=0.9. An increase in the intensity occurred during the mixing until the capillary state was reached. Usually, with a progressive liquid addition, the capillary state is obtained for π=1. This phenomenon is caused by an improvement in the liquid distribution in the granular medium with the mixing time and is increased with the decrease in the particle size and the increase in the rotation velocity.
Fig. 5. Consumption intensity of the Durcal 65 mixed with an instantaneous liquid addition and different rotation velocities: 60, 120 and 180 rpm. Representation as a function of the blade rotation number.
Fig. 6. Consumption intensity of the Durcal 15 mixed with liquid addition in two stages (π1+π2=1.3).
Fig. 7. Consumption intensity of the Durcal 15 mixed with liquid addition in two stages (1b π1+ π2b1.3).
This study will be continued using other granular materials (glass beads, cements, mortars). Further sampling will be carried out in order to follow the porosity of the granular bed during the mixing process. These samples will be used to make microscopic observations. For example, for granular media composed of several powders, the distribution of the different solids in the samples will be followed during the mixing process. Finally, kinetic laws will be established in order to characterize the energy consumption evolution after instantaneous liquid addition, particularly in the case of oversaturated media.
Acknowledgement
We thank the society OMYA SAS for the free supply of the calcites used in this study.
References
[1] J.Q. Feng, D.A. Hays, Relative importance of electrostatic forces on powder particles, Powder Technology 135–136 (2003) 65–75.
[2] J.P.K. Seville, C.D. Willett, P.C. Knight, Interparticle forces in fluidisation: a review, Powder Technology 113 (2000) 261–268.
[3] S.M. Iveson, J.A. Beathe, N.W. Page, The dynamic strength of partially saturated powder compacts: the effect of liquid properties, Powder Technology 127 (2002) 149–161.
[4] G. Betz, P. Junker Bürgin, H. Leuenberger, Power consumption profile analysis and tensile strength measurements during moist agglomeration, International Journal of Pharmaceutics 252 (2003) 11–25.
[5] A. Goldszal, J. Bousquet, Wet agglomeration of powders: from physics toward process optimization, Powder Technology 117 (2001) 221–231.
[6] D.M. Newitt, J.M. Conway-Jones, A contribution to the theory and practice of granulation, Transactions of the Institution of Chemical Engineers 36 (1958) 422–442.
[7] H. Leuenberger, M. Puchkov, E. Krausbauer, G. Betz, Manufacturing pharmaceutical. [8] E. Rondet, M. Delalonde, T. Ruiz, J.P. Desfours, Identification of granular compactness during the kneading of a humidified cohesive powder, Powder Technology 191 (2009) 7–12.
[9] E. Rondet, Texturation capillaire de milieux granulaires humides, PHD Thesis, Université Montpellier II, France, 2008.
[10] R. Collet, D. Oulahna, A. De Ryck, Mixing of a wet granular medium: particles size and liquid effects, 9th International Symposium on Agglomeration, Sheffield, June 22-26 2009.
[11] R. Collet, D. Oulahna, A. De Ryck, P.H. Jezequel, M. Martin, Mixing of a wet granular medium: solid properties effect, 12th SFGP Congress, Marseille, October 14-16 2009.