HAL Id: hal-01127973
https://hal.archives-ouvertes.fr/hal-01127973
Submitted on 9 Mar 2015
HAL is a multi-disciplinary open access
archive for the deposit and dissemination of
sci-entific research documents, whether they are
pub-lished or not. The documents may come from
teaching and research institutions in France or
abroad, or from public or private research centers.
L’archive ouverte pluridisciplinaire HAL, est
destinée au dépôt et à la diffusion de documents
scientifiques de niveau recherche, publiés ou non,
émanant des établissements d’enseignement et de
recherche français ou étrangers, des laboratoires
publics ou privés.
Using Multi-Angular RADARSAT-2 Datasets
Hongquan Wang, Stéphane Méric, Sophie Allain, Eric Pottier
To cite this version:
Hongquan Wang, Stéphane Méric, Sophie Allain, Eric Pottier. Adaptation of Oh Model for Soil
Pa-rameters Retrieval Using Multi-Angular RADARSAT-2 Datasets. Journal of Surveying and Mapping
Engineering, 2014, 2 (4), pp.65-74. �hal-01127973�
Adaptation of Oh Model for Soil Parameters
Retrieval Using Multi-Angular RADARSAT-2
Datasets
Hongquan Wang
1, Stéphane Méric
2, Sophie Allain
3, and Eric Pottier
4Institute of Electronics and Telecommunications of Rennes (IETR), European University of Brittany, 263 av. Général Leclerc, CS 74205, 35042 Rennes Cedex
1Hongquan.Wang@insa-rennes.fr; 2Stephane.meric@insa-rennes.fr; 3Sophie.Allain@univ-rennes1.fr; 4Eric.pottier@univ-rennes1.fr
Abstract-The global context of this study is to improve the robustness of surface geophysical parameter retrieval models.
Consequently, the adaptation of the existing retrieval models to radar measurement datasets is very important regarding the improvement of soil parameter retrieval procedures. In this context, the objective of this paper is to empirically adapt the Oh model based on the polarimetric RADARSAT-2 datasets acquired at different incidence angles, along with the simultaneous ground truth. The coefficients in the Oh model are adapted in order to decrease the deviation between Oh model predictions and SAR measurements. Improved agreements are found between the adapted Oh model and backscattering coefficients derived from multi-angular (ranged from 24° to 43°) SAR data. This indicates that the model adaptation could provide a way to improve the model behaviours and enhance the geophysical parameter retrieval.
Keywords- Multi-angular Measurements; RADARSAT-2 Datasets; Oh Model; Surface Roughness; Soil Moisture
I. INTRODUCTION
Soil surface roughness plays an important role in several physical processes regarding water conservation, soil erosion and surface runoff over agricultural areas. As the conventional soil parameter acquisitions are based on point measurements and considerable time and labour consumption, remote sensing techniques provide an opportunity to overcome these problems with a spatial resolution from centimeter to global scale. Thus, thanks to the signal processing which is called Synthetic Aperture Radar (SAR) processing and applied to radar signals, radar systems can provide images with a very high resolution [1] (RADARSAT-2 has an ultra-high resolution mode of about 3 meters for resolution). Furthermore, compared with optical remote sensing, radar is independent of weather and is able to give subsurface information taking into account the opportunity to use the radar wave polarisation state. Consequently, radar through radar images provides a promising approach to characterize the agricultural soils regarding the sensitivities to soil moisture and surface roughness.
Considering all these assumptions, the soil parameter retrieval can be achieved by considering polarimetric SAR images. Studies on characterization and retrieval of soil parameters like moisture and roughness using polarimetric SAR data have been carried out extensively in the past decades [2]. The SAR signature is affected by not only surface roughness, but also soil moisture. In addition, the radar backscattering signature is dependent on incidence angle, polarization and frequency [3]. Actually, the efficiency of retrieval procedure depends essentially on the scattering model accuracy that describes the soil behavior under electromagnetic wave effects. Thus, the characterization of soil parameters requires the scattering model to be adapted to actual SAR measurements.
One of the most frequently used models is the semi-empirical Oh model [4-6], which offers a wide range of applicability criteria. The cross-polarization signature and the ratios of backscattering coefficients are parameterized in terms of surface roughness, soil moisture and incidence angle based on fitting a large number of experimental measurements. However, the discrepancy between the model simulation and acquired backscattering coefficient is frequently large due to the different data scales and limits of model application criteria. Furthermore, when the algorithm is tested over the sites other than those where they are derived from, large deviation also appears due to different soil condition [7, 8] that compromises the efficiency of soil parameter retrieval. Thus, adaptation of Oh model is necessary before the implementation of retrieval procedure.
The capability of Oh model to infer surface roughness and soil moisture from RADARSAT-2 datasets is reported in [8], demonstrating significant disagreements between model predictions and actual data. The potential use of RADARSAT-2 datasets is evaluated in [9, 10] by examining the sensitivity of polarimetric parameters to surface roughness and soil moisture. The dynamics of linear polarized signature and polarimetric parameters from RADARSAT-2 are evaluated in [11] and the optimal SAR descriptors are determined for agricultural status monitoring. The discrimination between wet and dry moisture conditions is achieved in [12] using RADARSAT-2 datasets.
The objective of this paper is to evaluate and investigate the potential to adapt the Oh model using polarimetric RADARSAT-2 datasets extended in a multi-angular configuration and acquired in Northwest of France. Section II describes the test site and the multi-angular datasets. The operating characteristics of RADARSAT-2 are introduced and especially the
multi-angular datasets are acquired over the study region considering the meteorological conditions. Moreover, the soil moisture is measured by two methods and a conversion relationship is proposed to calibrate the soil moisture measurements. Finally, the surface roughness is measured using a simple chain method and then converted to the classical roughness descriptor. In section III, comparison between model simulation and RADARSAT-2 response is carried out. Then, the adaptation technique is implemented to improve the model performance and to decrease the disagreements of model predictions and multi-angular RADARSAT-2 datasets. Discussions and main conclusions are presented in section IV and section V respectively.
II. DATASET PRESENTATION A. Multi-angular SAR Data Acquisitions
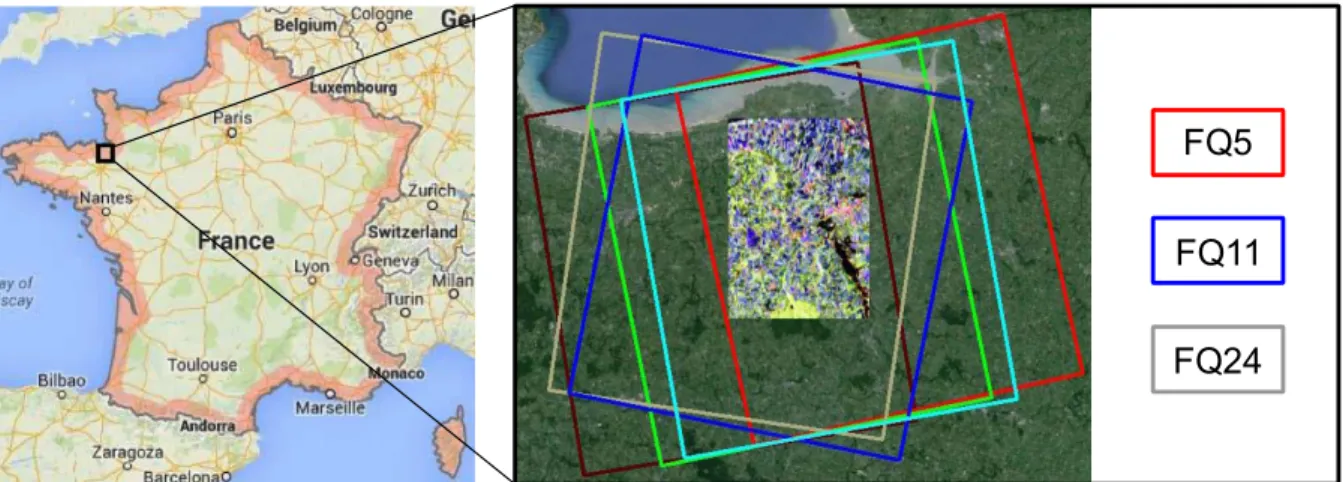
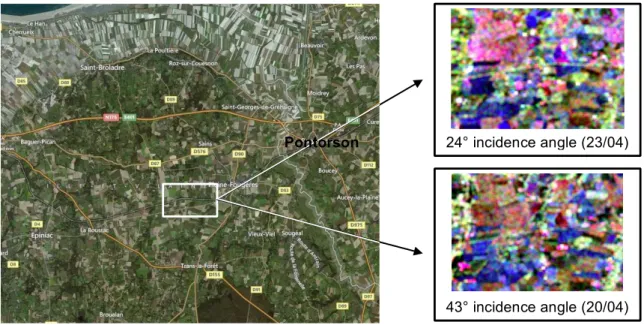
The studied agricultural areas are located in the site of Pleine-Fougères, near the Mont-St-Michel (N 48°38', E 1°30') in Brittany, France (see Fig. 1). Multi-angular fully polarimetric RADARSAT-2 images (see Fig. 1) were acquired in April 2013 in ascending and descending orbit and in fine quad-polarization mode (Single look complex - SLC products) with spatial resolution of 5.2 m in range and 7.6 m in azimuth and with three different incidence angles of 24°, 31°and 43° (Table 1). The SLC data are firstly extracted as coherence matrix T3 using PolSARpro4.2 [13]. Then, a boxcar filter with a 7-by-7 window [9] is applied to reduce speckle effect. The polarimetric images are ortho-rectified and transformed from slant range geometry to ground range using NEST (ESA SAR toolbox). As the test fields are flat, no compensation of terrain slope is applied to the SAR images. Afterwards, the master SAR image is selected from one of the multi-angular datasets and other images are co-registered to the master image, regardless of descending and ascending orbits. The co-registration average accuracy is achieved around 0.8 pixel. At this step, the processed Pauli color-coded images [13] are analysed in terms of scattering mechanisms. The volume scattering in green is dominant in forested areas and vegetated fields while the double bounce in red occurs predominantly in urban regions. The single bounce in blue is dominant over the expansive agricultural fields. For instance, in Fig. 2, two Pauli images are analysed for different incidence angle datasets and it can be noted that single bounce component tends to increase as the incidence angle increases. In order to locate the bare agricultural fields, the land cover information is collected in collaboration with the COSTEL laboratory from University of Rennes 2 (Climat et Occupation du Sol par TELédétection). The tested bare fields are selected considering their size and their distributions over the common section of multi-angular SAR swaths described in Fig. 1. Collecting the land cover information makes it possible to select 36 bare fields during the April 2013 campaign, the soil moisture measurements by Time Domain Reflectometry (TDR) instrument and the corresponding calibration procedures are presented in the followings. Moreover, the ground truth campaign involving surface roughness measurements by chain and laser methods is also described.
Fig. 1 RADARSAT-2 multi-angular image swaths over the Pleine-Fougères region
TABLE 1 MULTI-ANGULAR RADARSAT-2 DATASETS
Date (2013) Beam mode Incidence angle (°) Images orbit (Asc/Des)
23/04 FQ5 24 A
23/04 FQ11 31 D
20/04 FQ24 43 D
B. Soil Moisture Measurements
The electromagnetic wave traveling speed between two rods installed in TDR instrument depends on the permittivity of the natural soil which is located between these two rods. Hence, by measuring the electromagnetic wave traveling speed in soil mixture, the soil moisture can be derived. Although the TDR acquisition is fast to carry out over the expansive agricultural fields, the TDR measurement accuracy is usually not sufficient to be exploited. Consequently, TDR calibration is often necessary for agricultural soil with organic matters. In our study, the gravimetric method is accomplished as a soil moisture
FQ5
FQ11
reference measurement to evaluate the water content of a soil sample [14]. After measuring the soil moisture status using both TDR and gravimetric method, the calibration relationship can be established based on minimum Root Mean Square Error (RMSE) technique [15]. In our case, we investigate the calibration approaches for a common TDR-system: FieldScout-TDR300 (Spectrum Technologies) [16]. Therefore, the TDR measured soil moisture is transformed into the calibrated soil moisture.
Fig. 2 Comparisons between two Pauli RGB SAR images and the corresponding optical area for two incidence angles (double bounce (red), volume (green) and single bounce (blue))
In situ measurements of soil moisture, a depth of 3.8 cm (probe length) over the agricultural fields was measured over the 36 selected bare fields. Furthermore, TDR measurements were implemented over 25 samples distributed homogeneously over each test field so as to represent the general soil moisture status of each field. For the ground campaign in April 2013, the soil moisture distributions on 19/04/2013 and 23/04/2014 and the daily variations in April 2013 are shown in Fig. 3. Based on these measurements, the soil moisture ranges can be derived:
• From 23% to 32% with standard deviation around 4% on 19/04/2013. • From 15% to 24% with standard deviation around 4% on 23/04/2013. Besides the soil moisture, another important soil parameter is the surface roughness
(a) Distribution on 19/04/2013 (b) Distribution on 23/04/2013 (c) Daily variation in April 2013 Fig. 3 The distributions and daily variation of soil moisture measurements in April 2013
C. Surface Roughness Measurements
Surface roughness is commonly described by the standard deviation of the surface height also named Random Roughness Factor s. Several methods for surface roughness measurements have been developed in the past decades [17] by using i) vertical movable steel needles that make it possible to obtain the relief of the ground surface through a scale grid attached on a board, ii) a laser profiler transmitting pulses and recording the reflected pulses from the soil surface makes it possible to measure the surface roughness with high resolution through the reflected pulse delay. Nevertheless, these two approaches are still really time consuming, which prohibits any use for a mass of agricultural bare fields. Thus, in our study, the chain method proposed by Saleh [18] is adopted as an alternative simpler and faster approach to measure the surface roughness. This method
0 6 12 18 24 30 36 42 48 54 60 0 0.04 0.08 0.12 0.16 0.2 Soil moisture mv (%) PD F 0 6 12 18 24 30 36 42 48 54 60 0 0.04 0.08 0.12 0.16 0.2 Soil moisture mv (%) PD F 05/04 10/04 12/04 19/04 23/04 0 5 10 15 20 25 30 35 40 Date S o il m o ist u re m v (% ) 24° incidence angle (23/04) 43° incidence angle (20/04) Pontorson
is based on the principle that as a chain of given length L1 is placed across a surface, the covered horizontal distance L2
decreases as surface roughness increases. Therefore, the roughness descriptor called Saleh Roughness Factor (SRF) is defined as: SRF = 100(1-L2/L1). As the surface roughness is characterized by s, a relationship is established to transform quantitatively
the roughness measurements of SRF to the surface roughness s. Thus, a laser profiler has been developed to assess and calibrate the chain measurements. The effective length of the rail for holding laser instrument is 2.8 m. Several profiles are generated over different surfaces and the local slope effects are removed for each profile. The surface roughness s is computed for each profile as some examples are shown in Fig. 4 for s. Thus, the laser profiler can be used to transform the SRF measurements to the corresponding s values. To achieve this relationship between SRF and s, a regression model [19] is derived as s =a. SRF b where s is given in cm and the coefficients a and b are in function of rainfall amount [19], and also are
affected by the linkage length [20]. In our study, based on the regression between the laser measurements and synchronous chain sampling data, the coefficients for roughness scale transformation are derived as a= 0.5072 and b = 0.7867.
(a) Low surface roughness profile (b) High surface roughness profile Fig. 4 Surface roughness s after slope correction
(a) 19/04/2013 (b) 23/04/2013 Fig. 5 The distribution of measured surface roughness SRF in April 2013
In situ measurements of roughness with a chain of a given length L1= 146.5 cm, a 2.2 cm linkage length was measured also
over 36 selected bare fields. Over each test parcel, the SRF was measured 10 times uniformly in two perpendicular directions so as to represent the entire field. For the ground campaign in April 2013, all the chain measurements of SRF are described in Fig. 5. Based on the established conversion model, all these measurements can be transformed into random surface roughness descriptor s. The s values range from 1.0 cm to 5.5 cm.
Considering all these in situ measurements, we are consequently able to compare the RADARSAT-2 data with specific retrieval models regarding soil moisture and roughness.
III. ADAPTATIONOFOHMODELTORADARSAT-2DATA
A. Comparisons between Oh2004 Model and Radarsat-2 Data
The semi-empirical Oh model [4-6] is generally used for soil parameters retrieval. Its last version (Oh2004 model) is based on EM scattering behaviour, using scatterometer measurements and airborne SAR data. The formulation of the cross-polarization signature σ0
HV and the backscattering coefficient ratios in co-polarized and cross-polarized channels are given by
following 0 50 100 150 200 250 300 -10 -6 -2 2 6 10 Location(cm) Profile(cm) s = 1.2352 cm 0 50 100 150 200 250 300 -20 -15 -10 -5 0 5 10 15 20 Location(cm) Profile(cm) s = 5.8123 cm 0 6 12 18 24 30 0 2 4 6 8 10 12 14 SRF Number of Fields 0 6 12 18 24 30 0 2 4 6 8 10 12 14 SRF Number of Fields
0 0.7 2.2
(
1)
1 1g
(cos ) 1 exp( ( ) )
n HVmv
m ks
σ
=
θ
−
(1) 1.4(
2)
2(0.13 sin1.5 )
1 exp(
2( ) )
nq
=
g
+
θ
−
m ks
(2)0.65 3 0.35 3 3
2
1 (
)
mvexp (
( ) )
np
g
θ
m ks
π
−⎛
⎞
=
⎜
−
×
⎟
⎝
⎠
(3) With soil moisture mv, surface roughness ks (k = 2 π f /c is the wavenumber), incidence angle θ in radian, gi, mi, ni (i = 1, 2, 3)
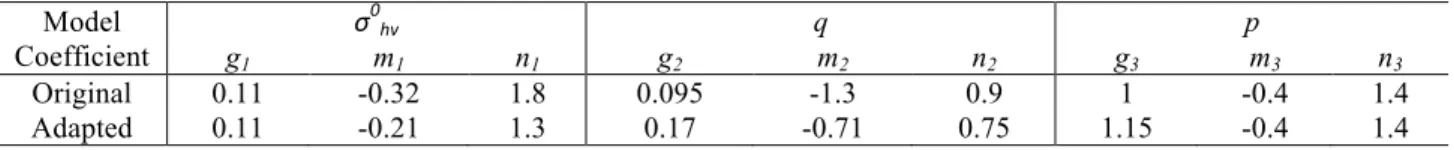
are the fitting coefficients. The original values of these coefficients, given in Table 2, are derived from the Oh2004 model. In this study, the parameters described through Eqs. (1), (2) and (3), are forward simulated regarding the satellite configuration characteristics (frequency f, incidence angle θ and polarization) using the mean value (field-level) of measured soil moisture
and surface roughness described in section II as inputs. In addition, the co-polarized p and cross-polarized q ratios are computed from the RADARSAT-2 linear polarization channels as p = σ0
HH / σ0
VV and q = σ0
HV / σ0
VV respectively (σ0
HV is
extracted from the processed coherence matrix as previously described in section II.A). Thus, the results of the simulations are compared with the RADARSAT-2 data derived parameters as shown in Fig. 6, and each point represents the mean value of SAR derived parameters for a given sampling field (it is computed by averaging the values of all the pixels within the target field, except some pixels near the field boundary to remove boundary effects). The significant disagreements between the original Oh2004 model predictions and RADARSAT-2 derived parameters are found in this study.
TABLE 2 ORIGINAL AND ADAPTED COEFFICIENT OF THE OH MODEL
Model Coefficient σ 0 hv q p g1 m1 n1 g2 m2 n2 g3 m3 n3 Original 0.11 -0.32 1.8 0.095 -1.3 0.9 1 -0.4 1.4 Adapted 0.11 -0.21 1.3 0.17 -0.71 0.75 1.15 -0.4 1.4
On the one hand, one can see that the linear polarization signature σ0
HV is overestimated by Oh2004 model (Fig. 6(a)). This
overestimation of σ0
HV is in agreement with the results in [8]. The average difference between predicted values using original
Oh2004 model and measured values from RADARSAT-2 is observed around 3 dB for low incidence angle i.e. 24° and around 2.4 dB for high incidence angle (43°).
On the other hand, the cross-polarized ratio q and the co-polarized ratio p derived from RADARSAT-2 dataset are underestimated using Oh2004 model (Fig. 6(b) and Fig. 6(c) respectively). Firstly, the discrepancy between the original Oh2004 model and extracted RADARSAT-2 q values ranges from 1.6 dB to 3.3 dB in Fig. 6(b). It is also reported in [8] that the RADARSAT-2 data have larger dispersion from the original Oh2004 model. Secondly, the values of p derived from RADARSAT-2 datasets range from -1 dB to 1 dB, while those simulated by the original Oh2004 model range from -1.3 dB to 0 dB (Fig. 6(c)). The p > 0 dB may due to several reasons, such as the high roughness condition and the weak periodic soil surface structure. This disagreement requires the original model to be adapted. Moreover, the original p model underestimates RADARSAT-2 data, but it is demonstrated in [8] that p is overestimated by Oh2004 model when ks < 1.5. This different behaviour with [8] may due to the soil condition difference, as the ground measurements employed in our study cover much wider ranges (for example ground surface roughness) than previous works.
(a) Cross-polarization signature σ0
HV (b) Co-polarized coefficient ratio q (c) Cross-polarized coefficient ratio p
Fig. 6 Comparisons of the RADARSAT-2 datasets with Oh2004 model
The disagreements between RADARSAT-2 datasets and scattering models may be caused by several reasons, such as the bare soil heterogeneity, the vegetation residue influence and the agricultural manipulation disturbance. For example, the spatial variation of soil texture, the high temporal dynamic of soil moisture, the possible soil moisture gradient in term of depth, and the slight topography influence within the sampling fields may partially explain these disagreements. Furthermore, the
-25 -22 -19 -16 -13 -10 -25 -22 -19 -16 -13 -10 σ0 HV(dB) from RS2 σ 0 HV (d B ) fro m O h 2 0 0 4 24° 31° 43° -15 -13 -11 -9 -7 -5 -15 -13 -11 -9 -7 -5 q (dB) from RS2 q( dB ) fr om O h2004 24° 31° 43° -2 -1 0 1 2 -2 -1 0 1 2 p(dB) from RS2 p( dB ) fr om O h2004 24° 31° 43°
apparent roughness measured by satellite in the direction orthogonal to flight path is not consistent with the ground truth roughness collection approach. In addition, the multiple scattering within the subsurface also aggravates the model divergence from RADARSAT-2 measurements, dependent on the wave penetration depth. Moreover, our measured surface roughness range may be close to the limit of Oh model validity. Nevertheless, except for these mentioned factors, the error in the ground truth measurement must be taken into account. In this work, the surface roughness is measured initially by the chain method like SRF, and then the measured SRF is transformed to s. As described in section II.A, the datasets of simultaneous chain and laser measurements are not large, which may cause less representativeness of the calibration relationships. Furthermore, a conversion model is used in this study to calibrate the TDR measurements. This conversion model may also cause errors in deriving the corresponding soil moisture. Considering all these points of view, this study proposes to evaluate and to investigate the potentials to adapt the original Oh2004 model in the aim of estimating soil moisture using multi-angular polarimetric RADARSAT-2 datasets.
B. Methodology for the Adaptation
In the Oh2004 model (equations from (1) to (3)), the general function (1 − exp (𝑚! (𝑘𝑠)!!)) is selected as the indicator of
surface roughness influence. This function is in agreement with the phenomenon that backscattering signature is towards zero for very flat surface, and becomes independent of surface roughness for very rough condition [5]. Consequently, the new idea is to adapt the coefficients in the surface roughness term (g1, m1, n1 for σ0
HV; g2, m2, n2 for q; and g3, m3, n3 for p) using iterative
Levenberg-Marquardt method [21] in order to decrease the deviation of Oh2004 model prediction from actual data. The adaptation process has been performed by monitoring the error between the model outputs and the targets of field-level actual values derived from RADARSAT-2 data (considered as field-level targets for the Levenberg-Marquardt). The iterative process is terminated when a minimum of such error was reached. In the adaptation, 50% pixels from the bare agricultural fields are randomly selected and the reminder pixels shall be used in the validation process. The adapted coefficients for cross-polarization signature σ0
HV, cross-polarized ratio q and co-polarized ratio p are achieved in Table 2. The sign of the coefficients
is the same as the original one but the magnitude of some coefficients is changed. The new coefficient values are presented in Table 2 and the final results are shown in Fig. 7. Also, the fitting coefficients gi, mi, ni (i = 1, 2, 3) influences are addressed for
each polarimetric measurement. Cross-polarization σ0
HV
In the adaptation process of σ0
HV to RADARSAT-2 data, the angular sensitivity and soil moisture dependence are kept. The
adaptation is mainly focused on the surface roughness characterization term (1 − exp (𝑚! (𝑘𝑠)!!)) and a scale factor g
1.
Therefore, the dependence of σ0
HV regarding the roughness parameter ks is described in Fig. 8. Moreover, the improvement of
the adapted model over the original one is clearly shown in Fig. 8 where the simulation and RADARSAT-2 data have the same scale values. It is also obvious that the disagreement is larger at low incidence angle (Fig. 8(a)) than at high incidence angle (Fig. 8(c)) even after adapting the model. Indeed, these disagreements are induced since ks > 3.5 is beyond the optimal application condition of Oh2004 model (the SAR signature is less sensitive and close to saturation at very high surface roughness condition) whatever the incidence angle value is. Nevertheless, at high incidence angle condition (such as Fig. 8(c)) the cross-polarization signature is more dominated by surface roughness than soil moisture. Furthermore, Fig. 8(a) shows some abnormal parcels, which are below both the original and adapted model. The low cross-polarization backscattering from these parcels under incidence 24° is due to the low soil moisture (mostly around 15% as mentioned in section II.B), implying that σ0
HV is also predominated by soil moisture at low incidence angle. In the condition of ks < 2.5, several parcels with mv > 15%
matched better with original model than with the adapted model (the study in [8] also found the Oh model performance in terms of RADARSAT-2 data is improved significantly at condition of mv > 25%), but 85% of the parcels are observed more suitable to the adapted model. It is found that the global discrepancy after the model adaptation decreases to 1.5 dB for low incidence angle and to 1.2 dB for high incidence angle. In this sense, the cross-polarization backscattering signature at high incidence angle acquisition shows great potentials to improve the surface roughness characterization.
(a) Cross-polarization signature σ0
HV (b) Co-polarized coefficient ratio q (c) Cross-polarized coefficient ratio p
Fig. 7 Comparisons of the RADARSAT-2 datasets with the adapted Oh2004 model
-25 -22 -19 -16 -13 -10 -25 -22 -19 -16 -13 -10 σ0 HV(dB) from RS2 σ 0 HV (d B ) fro m a d a p te d O h 2 0 0 4 24° 31° 43° -15 -13 -11 -9 -7 -5 -15 -13 -11 -9 -7 -5 q (dB) from RS2 q( dB ) fr om adapt ed O h2004 24° 31° 43° -2 -1 0 1 2 -2 -1 0 1 2 p (dB) from RS2 p( db) f rom adapt ed O h2004 24° 31° 43°
(a) (b) (c) Fig. 8 Original vs adapted Oh2004 model for cross-polarization σ0
HV using incidence angle (a) 24°; (b) 31°; (c) 43°
Cross-polarized ratio q
The cross-polarized ratio is very sensitive to roughness variation (Fig. 9). In order to decrease the discrepancy between Oh2004 model and RADARSAT-2 data, the m2 and n2 coefficients are adapted to be smaller to get the surface roughness
description term (1 − exp (𝑚! (𝑘𝑠)!!)) to become more dynamic to surface roughness variations. The discrepancy of adapted
Oh2004 model from RADARSAT-2 data becomes lower when using high incidence angle acquisition rather than using low incidence angle acquisition. This is also in agreement with the observing results that the surface roughness over bare agricultural fields is more suitable to be described using higher incidence angle acquisitions [22]. This incidence angle influence on cross-polarized ratio q is significantly clear in Fig. 9 (and also Fig. 7(b)). It is noted that at low incidence angle 24° (Fig. 9(a)), the adapted model also underestimates the actual data, even the discrepancy becomes less than the original one. At high incidence angle 43° and in the case of ks > 2.8 (Fig. 9(c)), the adapted model overestimates the actual data while the original model underestimates the actual values, but the absolute divergences are similar. However, for both original and adapted Oh2004 model, the general bias of cross-polarized ratio q is larger for smooth surface than for rough surface, in accordance with the Oh model evaluation in [8]. The systematic bias between adapted q model and RADARSAT-2 data allows us to conclude a dependence on incidence angle.
Co-polarized ratio p
The co-polarized ratio p is less sensitive to roughness variation as shown in Fig. 10. By model adaptation, the m3, n3 values
are in accordance with the original Oh2004 model; only the coefficient g3 is changed to 1.15 (Table 2). This unchanged surface
roughness term implies that the dependence of co-polarized ratio p on surface roughness is weak. For small incidence angle 24° (Fig. 10(a)) and moderate incidence angle 31° (Fig. 10(b)), it is noted that when ks < 3.2, the adapted model agrees with the RADARSAT-2 data. Nevertheless, for high incidence angle 43°, both the model before and after adaptation underestimate the RADARSAT-2 datasets, even though the discrepancy decreases for adapted model. When ks > 3.2, the adapted model overestimates the data whatever the incidence angle value is, and the absolute bias is similar to the original model. Thus, even though the general performance of adapted Oh2004 model is better than the original model, it is also with drawbacks since the limitation of SAR derived parameters under high roughness condition (such as ks > 3.2) can not be overcome.
(a) (b) (c)
Fig. 9 Original vs adapted Oh2004 model for cross-polarized ratio q using incidence angle (a) 24°; (b) 31°; (c) 43°
1 2 3 4 5 6 -25 -22 -19 -16 -13 -10 Roughness ks σ 0 HV (d B ) RS2 Original Adapted ks < 2.5 ks > 3.5 1 2 3 4 5 6 -25 -22 -19 -16 -13 -10 Roughness ks σ 0 HV (d B ) RS2 Original Adapted ks > 3.5 ks < 2.5 1 2 3 4 5 6 -25 -22 -19 -16 -13 -10 Roughness ks σ 0 HV (d B ) RS2 Original Adapted ks < 2.5 ks > 3.5 1 2 3 4 5 6 -15 -13 -11 -9 -7 -5 Roughness ks q ( d B ) RS2 Original Adapted 1 2 3 4 5 6 -15 -13 -11 -9 -7 -5 Roughness ks q ( d B ) RS2 Original Adapted 1 2 3 4 5 6 -15 -13 -11 -9 -7 -5 Roughness ks q ( d B ) RS2 Original Adapted ks > 2.8
(a) (b) (c)
Fig. 10 Original vs adapted Oh2004 model for co-polarized ratio p using incidence angle (a) 24°; (b) 31°; (c) 43°
IV. VALIDATIONANDDISCUSSION
A. Model Validation
The performances of the adaptation results are assessed based on RMSE which is expressed in dB 2 1 1 RMSE= N ( i i) i O P N = −
∑
(4)Where the index i describes the field number, Oi is the extracted value in dB from RADARSAT-2, Pi is the simulated value in
dB from models (original and adapted respectively), and N is the total number of fields. The RMSE is able to quantify the magnitude of average modelling error for each model and for each incidence angle. The results are mainly compared in Fig. 11. It is indicated that RMSE decreases after the Oh model adaptation to RADARSAT-2 datasets.
For cross-polarization signature σ0
HV (Fig. 11(a)), the RMSE at small incidence angle is larger than that at higher incidence
angle even after the model adaptation. In the same way, Fig. 11(b) shows the improvement for the cross-polarized coefficient q using multi-angular data, indicating that the RMSE decreases by around 50% owing to the model adaptation. The deviation of
q model from actual SAR data at small incidence angle is also larger than at higher angle. Finally, it is shown in Fig. 11(c) that
RMSE decreases by around 40% after the p model is adapted. In contrary to the behaviours of σ0
HV and q, the RMSE of original
p model slightly decreases at incidence angle 31° and then increases at 43°. After the p model is adapted, the RMSE increases with incidence angle. The comparison of the model behaviours indicates that the adapted σ0
HV and q are more suitable to
characterize the surface roughness at high incidence angle. This indicates that the sensitivity of polarimetric parameters to surface roughness increases with increasing incidence angle, which is in agreement with the theoretical prediction [22].
(a) Cross-polarization σ0
HV (b) Cross-polarized ratio q (c) Co-polarized ratio p
Fig. 11 Comparisons of RMSE (in dB) between original and adapted Oh2004 models
B. Discussion 1 2 3 4 5 6 -2 -1 0 1 2 Roughness ks p ( d B ) RS2 Original Adapted ks < 3.2 ks > 3.2 1 2 3 4 5 6 -2 -1 0 1 2 Roughness ks p ( d B ) RS2 Original Adapted ks < 3.2 ks > 3.2 1 2 3 4 5 6 -2 -1 0 1 2 Roughness ks p ( d B ) RS2 Original Adapted ks < 3.2 ks > 3.2 0 0,5 1 1,5 2 2,5 3 3,5 24° 31° 43° RMS E (d B) Incidence angle Original Adapted 0 0,5 1 1,5 2 2,5 3 3,5 24° 31° 43° RMS E (d B) Incidence angle Original Adapted 0 0,2 0,4 0,6 0,8 1 24° 31° 43° RMS E (d B) Incidence angle Original Adapted
Based on examining these RADARSAT-2 datasets, the original cross-polarization σ0
HV model is found to overestimate
RADARSAT-2 data by 2.4 - 3 dB. This error is larger than the RMSE error of 2.34 dB in [5]. The original q model underestimates the RADARSAT-2 data by around 1.6 - 3.3 dB (in [5] RMSE equals to 2.06 dB), and original p model underestimates the RADARSAT-2 data by around 0.6 dB (in [5] RMSE equals to 0.82 dB). The divergences between original Oh2004 model and RADARSAT-2 data may due to the fact that the original Oh2004 model is derived using datasets from scatterometer and airborne SAR, different from RADARSAT-2 image acquisition system. After adapting the Oh2004 model to RADARSAT-2 datasets, the RMSEs decrease to around
• 1.4 dB for cross-polarization σ0
HV,
• 0.8 - 1.6 dB for cross-polarized ratio q, • 0.32 - 0.45 dB for co-polarized ratio p.
Thus, the adapted Oh model shows less divergence from the RADARSAT-2 data. As incidence angle increases, the RMSE decreases for both σ0
HV model and q model (in contrary with p mode). Thus, it is
suggested to use σ0
HV and q formulations at high incidence angle for surface roughness characterization. These findings
illuminate the importance of cross-polarization signature for surface roughness quantification over bare agricultural environments. As in C-band, the microwave penetrating ability is weaker than in L-band [23]. Thus, the cross-polarization signature which represents the multiple scattering components may be predominated more by surface roughness than soil moisture.
The adapted Oh2004 model provides a possible application when surface roughness satisfies 1.3 ≤ ks ≤ 5.6 with moderate soil moisture and incidence angle ranging from 24° to 43°. In addition, the adapted Oh2004 model suggests a potential use of multi-angular SAR data for improving the effectivity of backscattering model. Nevertheless, further work is still necessary to test the adapted Oh2004 model using large databases acquired by RADARSAT-2 (and/or other platform) over various study conditions in order to validate the robustness of the adapted Oh2004 model.
V. CONCLUSION
The objective of this study is to evaluate and adapt the original semi-empirical Oh2004 model based on the multi-angular RADARSAT-2 datasets and simultaneous ground truth measurements over bare agricultural soils. The adapted model maintains the sensitivities to the variation of incidence angle and soil moisture. Meanwhile, the sensitivity to surface roughness along with the data scale is determined to minimize the model discrepancy from actual SAR measurements. With the improved surface roughness characterization ability for the bare agricultural fields, the adapted σ0
HV and q model are proposed for surface
roughness retrieval, preferentially using high incidence angle RADARSAT-2 data.
REFERENCES
[1] G. Cumming and F. H. Wong, Digital processing of synthetic aperture radar data, 1st ed., Ed. Boston, USA: Artech House Publishers, 2005.
[2] K. Fung, Microwave Scattering and Emission Models and Their Applications, 1st ed., Ed. Boston, USA: Artech House Publishers, 1994.
[3] F. T. Ulaby, R. K. Moore, and A. K. Fung, Microwave Remote Sensing: Active and Passive, Vol. II – Radar Remote Sensing and
Surface Scattering and Emission Theory, Ed. Norwood, USA: Addison-Wesley Publishing Company, Advanced Book Program /
World Science Division, 1982.
[4] Y. Oh, K. Sarabandi, and F. T. Ulaby, “An empirical model and an inversion technique for radar scattering from bare soil surfaces,”
IEEE Transactions on Geoscience and Remote Sensing, vol. 30, iss. 2, pp. 370–381, Mar. 1992.
[5] Y. Oh, K. Sarabandi, and F. T. Ulaby, “Semi-empirical model of the ensemble-averaged differential mueller matrix for microwave backscattering from bare soil surfaces,” IEEE Transactions on Geoscience and Remote Sensing, vol. 40, iss. 6, pp. 1348–1355, Jun. 2002.
[6] Y. Oh, “Quantitative retrieval of soil moisture content and surface roughness from multipolarized radar observations of bare soil surfaces,” IEEE Transactions on Geoscience and Remote Sensing, vol. 42, iss. 3, pp. 596–601, Mar. 2004.
[7] J. A. Mozos, M. G. Audicana, and J. Casali, “Evaluation of empirical and semi-empirical backscattering models for surface moisture estimation,” Canadian Journal of Remote Sensing, vol. 33, iss. 3, pp. 176–188, 2007.
[8] A. Merzouki, H. McNairn, and A. Pacheco, “Evaluation of the Dubois, Oh, and IEM radar backscatter models over agricultural fields using C-band RADARSAT-2 SAR image data,” Canadian Journal of Remote Sensing, vol. 36, iss. 2, pp. 274–286, 2010. [9] N. Baghdadi, R. Cresson, E. Pottier, M. Aubert, M. Zribi, A. Jacome, and S. Benabdallah, “A potential use for the C-band
polarimetric SAR parameters to characterize the soil surface over bare agriculture fields,” IEEE Transactions on Geoscience and
Remote Sensing, vol. 50, iss. 10, pp. 3844–3858, Oct. 2012.
[10] N. Baghdadi, P. Dubois-Fernandez, X. Dupuis, and M. Zribi, “Sensitivity of main polarimetric parameters of multifrequency polarimetric SAR data to soil moisture and surface roughness over bare agricultural soils,” IEEE Geoscience and Remote Sensing
Letters, vol. 10, iss. 4, pp. 731–735, Jul. 2013.
[11] J. R. Adams, A. A. Bergand, H. McNairn, and A. Merzouki, “Sensitivity of C-band SAR polarimetric variables to unvegetated agricultural fields,” Canadian Journal of Remote Sensing, vol. 39, iss. 1, pp. 1–16, 2013.
[12] L. Bourgeau-Chavez, B. Leblon, F. Charbonneau, and J. R. Buckley, “Assessment of polarimetric SAR data for discrimination between wet versus dry soil moisture conditions,” International Journal of Remote Sensing, vol. 34, iss. 16, pp. 5709–5730, 2013. [13] J. S. Lee and E. Pottier, Polarimetric radar imaging from basics to applications, 1st ed., T. F. Group, Ed. Boca Raton, USA: CRC
Press, 2009.
[14] J. P. Walker, G. R. Willgoose, and J. D. Kalma, “In situ measurement of soil moisture: a comparison of techniques,” Journal of
Hydrology, vol. 293, iss. 14, pp. 85–99, 2004.
[15] E. T. Jaynes, Probability Theory: The Logic of Science, Ed. Cambridge, UK: Cambridge University Press, 2003. [16] Spectrum, “User’s manual: Field Scout TDR 300 soil moisture meter,” Spectrum Technologies, Inc., Tech. Rep., 2009.
[17] W. Jester and A. Klik, “Soil surface roughness measurement - methods, applicability, and surface representation,” CATENA, vol. 64, iss. 2-3, pp. 174 – 192, Dec. 2005.
[18] A. Saleh, “Soil roughness measurements: chain method,” Journal of Soil and Water Conservation, vol. 48, iss. 6, pp. 527–529, Nov/Dec. 1993.
[19] J. E. Gilley and E. R. Kottwitz, “Random roughness assessment by the pin and chain method,” Applied Engineering in Agriculture, vol. 12, iss. 1, pp. 39–43, 1995.
[20] S. D. Merrill, C. Huang, T. M. Zobeck, and D. L. Tanaka, “Use of chain set for scale-sensitive and erosion-relevant measurements of soil surface roughness,” in Proceedings of the 10th International soil conservation organization meeting, pp. 594–600, May. 1999.
[21] G. A. F. Seber and C. J. Wild, Nonlinear Regression, 1st ed., Ed. New York, USA: Wiley-Interscience, 2003.
[22] N. Baghdadi, C. King, A. Bourguignon, and A. Remond, “Potential of ERS and RADARSAT data for surface roughness monitoring over bare agricultural fields: application to catchments in northern France,” International Journal of Remote Sensing, vol. 23, iss. 17, pp. 3427–3443, 2002.
[23] M. Nolan and D. R. Fatland, “Penetration depth as a DINSAR observable and proxy for soil moisture,” IEEE Transactions on