HAL Id: hal-01006849
https://hal.archives-ouvertes.fr/hal-01006849
Submitted on 13 Dec 2017
HAL is a multi-disciplinary open access
archive for the deposit and dissemination of
sci-entific research documents, whether they are
pub-lished or not. The documents may come from
teaching and research institutions in France or
abroad, or from public or private research centers.
L’archive ouverte pluridisciplinaire HAL, est
destinée au dépôt et à la diffusion de documents
scientifiques de niveau recherche, publiés ou non,
émanant des établissements d’enseignement et de
recherche français ou étrangers, des laboratoires
publics ou privés.
Experimental Parametric Study of Suffusion and
Backward Erosion
Fateh Bendahmane, Didier Marot, Alain Alexis
To cite this version:
Fateh Bendahmane, Didier Marot, Alain Alexis. Experimental Parametric Study of Suffusion and
Backward Erosion. Journal of Geotechnical and Geoenvironmental Engineering, American Society of
Civil Engineers, 2008, 134 (1), pp.57-67. �10.1061/(ASCE)1090-0241(2008)134:1(57)�. �hal-01006849�
Experimental Parametric Study of Suffusion
and Backward Erosion
Fateh Bendahmane
1; Didier Marot
2; and Alain Alexis
3Abstract: Within hydraulic earth structures 共dikes, levees, or dams兲, internal seepage flows can generate the entrainment of the soil grains. Grain transportation affects both particle size distributions and porosity, and changes the mechanical and hydraulic characteristics of the earth’s structure. The occurrence of failures in new earth structures due to internal erosion demonstrates the urgency of improving our knowledge of these phenomena of erosion. With this intention, a new experimental device has been developed that can apply hydraulic stresses to reconstituted consolidated cohesive soils without cracks in order to characterize the erosion evolution processes that might be present. A parametric study was conducted to examine the influence of three critical parameters on clay and sand erosion mechanisms. When the hydraulic gradient was low, it was concluded that the erosion of the structure’s clay fraction was due to suffusion. When the hydraulic gradient increased, it was concluded that the sand fraction erosion initiation was due to backward erosion. The extent of the erosion was dependent on the clay content. The study underlines the complexity of confinement stress effects on both erosion phenomena.
Keywords: Erosion; Triaxial stress; Cohesive soils; Soil structure; Hydraulic structures.
Introduction
The presence of water in earth structures, such as dams and dikes, may cause damage by three mechanisms: Sliding, overtopping, and internal erosion. Internal erosion appears to be one of the main causes of failures and damage to embankment dams. Among 11,192 surveyed dams 共Foster et al. 2000兲, 136 show dysfunc-tions, which are divided up as 5.5% related to sliding, 48% related to overtopping, and 46% related to internal erosion. Hence, internal erosion appears to be a main cause of observed instabilities.
Internal erosion is due to the transport and migration, under the action of flow, of particles constituting the soil within the earth’s structure. Improvements in understanding internal erosion mechanisms are hindered by the complexity of these mechanism and the difficulties associated with their detection. When internal erosion occurs, the hydraulic and mechanical characteristics of the soil are altered. The material permeability, for instance, may undergo sharp changes that may cause loss of water tightness of
the structure or lead to increases in pore pressure, which may be prejudicial to the stability of the slopes of the structure.
Internal erosion mechanisms involve many parameters, some of which are coupled. Laboratory testing to identify specific mechanisms are easier to carry out than monitoring full scale structures. Laboratory tests allow for differences in interpretation within the same test campaign; Skempton and Brogan共1994兲 ex-plained the piping of fine grains by the presence of a coarse grain framework that carried the greater part of the overburden load, whereas Monnet共1998兲 defined a piping critical gradient for the whole soil.
The two main phenomena responsible for erosion of particles in soils that are not cracked are backward erosion and suffusion. In backward erosion, particles are detached from the downstream surface of the structure by the seepage forces in the soil. In suf-fusion, the process is similar, but the coarse particles form a ma-trix and erosion is only of the finer particles in the pore space between the larger particles.
Different criteria to assess initiation and development of inter-nal erosion are proposed in the literature. The different ap-proaches mostly rest on the analysis of the material particle size or on the estimation of the erosion critical hydraulic gradient. These criteria, which are mostly determined for cohesionless soils, are summarized below.
Granulometric Criteria
On the assumption that bigger grains can hinder the erosion of smaller grains, Kenney and Lau共1985兲 have developed a method for assessing whether soils are internally unstable based on the shape of the grading curve. This has been validated for both up and down flows共Monnet 1998; Skempton and Brogan 1994兲. The recognized limits of these prediction criteria may come from the lack of consideration of porosity and soil confinement stresses. The methods also do not apply to clay soils.
1
Postdoctoral Student, Institut de Recherche en Génie Civil et Mécanique GeM, UMR CNRS 6183, Université de Nantes, BP 420, 44606 Saint-Nazaire Cedex, France.
2
Associate Professor, Institut de Recherche en Génie Civil et Mécanique GeM, UMR CNRS 6183, Université de Nantes, BP 420, 44606 Saint-Nazaire Cedex, France. E-mail: [email protected]
3
Professor, Institut de Recherche en Génie Civil et Mécanique GeM, UMR CNRS 6183, Université de Nantes, BP 420, 44606 Saint-Nazaire Cedex, France.
Hydraulic Criteria
In order to characterize the initiation of backward erosion, several authors have developed expressions that relate to the critical hydraulic gradient. Some of them are strongly dependent on the specific configuration studied and, therefore, cannot be applied generally. Because of the importance of the uncertainties in the expressions based on the hydraulic gradient, engineers prefer to choose high values共up to 15兲 for the safety factor on the critical gradient for sand boils.
In order to take into account the characteristics of cohesive soils共Khilar et al. 1985兲, the erosion critical gradient is expressed as a function of the hydraulic shear stress , of the soil, the in-trinsic permeability K, and the porosity n. The main difficulty and interest when using this approach lies in the determination of, which is dependent on both clay mineralogy and pore fluid prop-erties共Arulanandan and Perry 1983兲. For example, to characterize the initiation of internal erosion, Reddi et al.共2000兲 have devel-oped an expression of the shear stress for cohesive soils
=
冉
⌬P ⌬L冊
冑
2K
n 共1兲
with ⌬P=pressure drop 共Pa兲; ⌬L=sample height 共m兲; ⌬P/⌬L = average pressure gradient共kN/m3兲; n=porosity; and
K⫽intrin-sic permeability共m2兲, determined by
K = k
␥w
共2兲 with k = hydraulic Darcy’s permeability共m/s兲; =dynamic viscos-ity共kg m−1s−1兲; and ␥
w= volumic weight of water共kN/m3兲.
The migration of particles within the soil, when internal ero-sion begins, may rapidly cause dysfunctions at the level of the whole structure. The characterization of the soil mechanical per-formance of soils is strongly linked to the fluid/soil interaction. The soil’s stress field also conditions its behavior. However, the influence of stresses on internal erosion mechanisms within materials is not clear. Tomlinson and Vaid共2000兲, who have ex-amined the effect of confining pressure on internal erosion of an artificial material共glass balls兲, conclude that the effects are minor. Wan and Fell共2004兲 showed that the degree of compaction had an effect on the rate of erosion of silty and cohesive natural soils, but that effect is superimposed on the effect of water content, and hence, degree of saturation. Papamichos et al.共2001兲 have shown that initiation of erosion in sand is a function of loads, and that beyond a certain threshold erosion sharply increases.
Soil structure can be broken down into two groups: A primary structure and a secondary structure 共Kenney and Lau 1985; Barakat 1991; Lafleur et al. 1989; Tomlinson and Vaid 2000兲. The primary structure consists of grains, which are in contact with each other and provide primary resistance to erosion, compress-ibility, and shear strength. If these grains are eroded, there are changes to the soil resistance, and these changes may cause col-lapses. The secondary structure, on the other hand, is composed of grains that are in the spaces between the primary grains and may be displaced under the action of mechanical 共vibration兲 or hydraulic共flow兲 stresses. Barakat 共1991兲 concludes that erosion of these secondary particles in a process of suffusion does not affect soil mechanical slope stability. It, however, may modify the settlement potential of cohesive soils according to Ayadat et al. 共1998兲.
Current internal erosion criteria do not adequately consider the hydraulic/mechanical coupling and the simultaneous influence and interactions of the main parameters that appear to influence
erosion共porosity, grain size, confining stress, gradient兲. The great number of parameters affecting the different phenomena, as well as their interrelated features, emphasize the importance of experimental studies that can provide greater insight into erosion processes.
Design of New Device Main Characteristics
The experimental device developed by the authors, which can be used to study the initiation of internal erosion, was developed for sandy-clay samples.
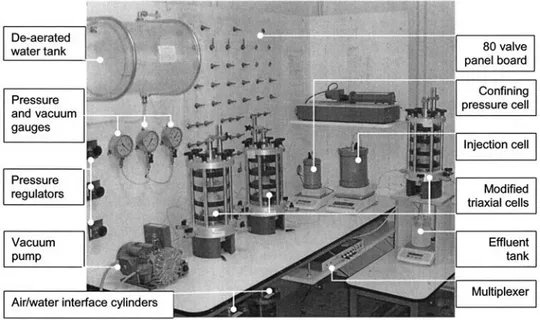
In order to reduce parasitic flows between a soil sample and a rigid cell wall, Kenney and Lau 共1985兲 introduced a rubberlike diaphragm between the rigid wall and the compacted sample. As an alternative, Daniel et al. 共1984兲 developed a permeameter using a modified triaxial cell. This flexible wall permeameter of-fers the potential for more complete control over stresses that act on the soil specimen, and is better suited for minimizing side wall leakage. Because of these advantages, the new device, which is placed in a temperature-controlled chamber共20±0.5°C兲, consists of three modified triaxial cells that are coupled to two air-water cells. The whole device is designed to allow flows through the samples within the cells. So as to avoid all unwanted distur-bances on the samples, saturation, consolidation, hydraulic, and mechanical test stages are carried out inside the test cell without deconfining the sample. The detection of erosion in the effluent is performed using optical aids and by weighing the amount of grains in the eroding fluid共Fig. 1兲.
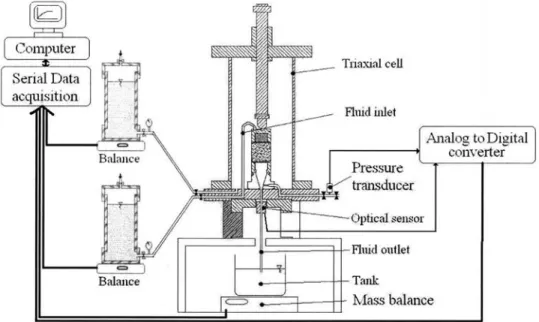
The three triaxial cells allow for saturation, consolidation, and the characterization of volume change and deformations. These cells can be used simultaneously in order to saturate and to con-solidate three samples together, and thus to minimize the test program’s duration. They have been modified to let fluids flow through the samples with limited head losses, and discharge fine particles washed away by the process without clogging the drain-age system 共Fig. 2兲. The fluid is circulated into the top of the sample using a 22 mm thick layer of glass sphere to diffuse the fluid on the sample contact interface uniformly. At the bottom of the sample, the funnel-shaped draining system is specially de-signed to avoid clogging or the formation of a layer of particles within the collection system. This makes it possible to use differ-ent filters, which can be either granular or made of geotextiles with openings ranging between 1m and 8 mm and with a maxi-mum thickness of 17 mm. For suffusion and backward erosion tests on sandy-clay samples, a 4 mm pore opening grid is used to survey the migration of all the particles共sand and clay兲. The cell outlet is linked to an effluent tank through a transparent drainage pipe.
The hydraulic system consists of different elements generating pressures and suctions, all connected to an 80 valve panel board, which can operate on the three triaxial cells simultaneously. The system includes two pressure volume controllers, one for the in-jection and the other to generate sample predetermined confining pressures. Both controllers are continuously weighed during the tests to determine both injected flow rates and sample volume changes. The pressure inside these cells cannot exceed 70 kPa 共Fig. 3兲.
The new device also includes three pressure regulators con-nected to air/water interface cylinders, which are used to generate
and maintain constant pressures. The injected fluid is kept in a tank, from where air bubbles are removed using a 90 kPa vacuum pump.
Two pressure gauges共250 and 600 kPa兲 and a vacuum gauge 共−100 kPa兲, connected to the valve panel board, are used to carry out measurements throughout the whole circuit. A pres-sure gauge is connected at the cell outlet to meapres-sure the pore pressure during the sample consolidation phase or the fluid outlet pressure.
In order to study the very beginning of internal erosion, to detect the possible initiation point, and to carry out real-time measurements of the eroded clay quantity, a photo sensor has been developed 共this device is able to measure only the small
quantities of eroded material兲. Placed on the pipe connecting the triaxial cell to the effluent tank, it measures the transparency of the fluid coming through the pipe. Thanks to a previous cali-bration for different kaolinite erosive mass rates, the optical sen-sor can quantify very small quantities of eroded material. Fig. 4 represents the instantaneous kaolinite content versus the relative variation of the optical sensor terminal voltage.
The instantaneous kaolinite content determined by the optical sensor is expressed in the form
Sopt共t兲 =
⌬mk out
⌬mw out
共3兲 with mk out= kaolinite mass within the effluent; and mw out= water
mass within the effluent.
The injection rate qwis defined by
qw共t兲 = ⌬mw inj共t兲 ⌬t = ⌬mw out共t兲 ⌬t − ⌬mw sam共t兲 ⌬t 共4兲
with mw inj= injected water mass; and mw sam= water mass within
the sample.
Regarding clay erosion, the water mass change inside the sample 共⌬mw sam兲 can be neglected in comparison with the
in-jected water mass change. We then obtain the erosive mass rate per unit surface as
qs共t兲 =
Sopt共t兲 ⫻ qw共t兲
s 共5兲
with s = sample cross-sectional area共m2兲.
The integration of the erosive mass rate with time gives the cumulated eroded solid mass during the tests, that is
m共t兲 =
冕
0 t
s⫻ qs共t兲dt 共6兲
In the case of sand erosion, the high quantities of eroded material allow us to use mass measurements. Thanks to these mass mea-surements, the rate of sand and clay erosion can be calculated.
Cohesive soil testing usually takes a long time, so automation of the operations is provided using a multiplexer that collects Fig. 1. Photograph of the experimental device
analog signals from the gauges and digital signals from both the pressure/volume controllers and the electronic scales. The multi-plexer is connected to a dedicated computer, which operates the acquisition of the data and the monitoring of the tests thanks to a specific visual basic piece of software developed by the authors. Test Procedure
The material used is a washed Loire sand 共grain density: 26 kN/ m3兲 with a grain size distribution within the range
80m–1 mm 共d50= 440m, uniformity coefficient: 3.125兲. The
clay consists of kaolinite, with liquidity and plasticity limits of 55 and 22%, respectively. Fig. 5 presents the grain size distributions of both the sand and the clay. The preparation phase is divided into three steps: Production and installation of the sample, satu-ration, and then consolidation. The repeatability of the production is achieved by the following procedure. The sand is first mixed with a moisture content of 8%. While mixing continues, powder clay is then progressively added and mixing is then carried on for an additional 10 min. This method has been validated through confirmation of the size distribution homogeneity achieved after mixing共Bendahmane 2005兲.
The installation of the sample inside the cell requires prelimi-nary forming. The study conducted by Camapum De Carvalho et al. 共1987兲 to examine how compaction methods affect a co-hesive soil’s homogeneity reveals that semistatic compaction proves to be the best method to achieve homogeneous samples. The next best method these authors advocate is single layer semi-static compaction within a mold using two pistons. In conformity with the results of this study, we use a 50 mm diam and 50 mm high mold under the action of two pistons, until the initial fixed dry density共before consolidation兲 is reached. This initial dry den-sity value 共17 kN/m3兲 is lower than the smallest value reached
after consolidation.
The saturation phase begins when a small 20 kPa confinement pressure is applied to prevent any parasitic leakage between the sample and the diaphragm. In such sand clay mixtures, saturation with only deaerated water is not effective 共final saturation ratio: About 90%兲. Consequently, some carbon dioxide is initially in-jected into the sample starting at the bottom, before saturation is completed using demineralized and deaerated water. The whole saturation phase requires approximately 24 hr.
The confining pressure increases in steps in conformity with standard AFNOR NFP 94-074 共AFNOR 1994兲 procedures. In order to control the quality of the sample consolidation, expelled Fig. 3. Schematic representation of the experimental triaxial cell equipped with the two controllers, effluent weight measurement, and optical
sensor mechanism
Fig. 4. Optical sensor calibration curve for different kaolinite
fluid volume measurements are performed until stabilization 关in conformity with standard AFNOR NFP 94-074 共AFNOR 1994兲 procedures兴 and the excess pore pressure dissipation is checked. The confining pressure is finally decreased by half to avoid fur-ther consolidation of the material because of the inflow. Last, the sample is subjected to a hydraulic action in downward direction using demineralized and deaerated water in order to keep the injected fluid characteristics identical.
Details of Tests and Analyses of Results Test Principle
Three parameters共hydraulic gradient, clay content, and confining pressure兲 with the following characteristics have been examined using the new device:
• Kaolinite content: 5, 10, 20, and 30%;
• Hydraulic gradient ranging between 5 and 160 m/m; and • Isotropic confining pressure 3 共1=3兲: 100, 150, 200, and
250 kPa.
The range of hydraulic gradients was chosen to be relatively large in order to include the possible reduction of flow path in an earth structure by backward erosion phenomena. In this case, the local gradient can be much higher than the global one.
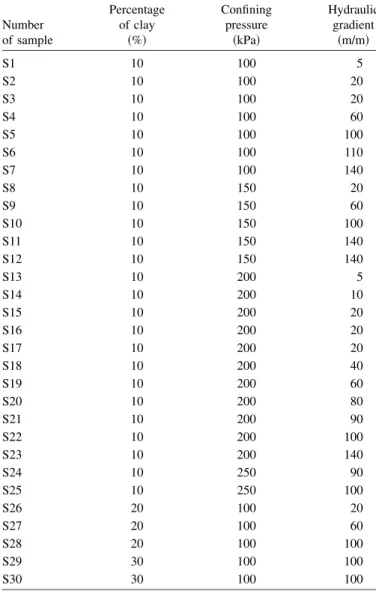
The highest confining pressure is equivalent to the earth pres-sure, which exits at 12.5 m depth in a typical earth dam. The details of the experimental program, which consisted of 30 tests, are presented in Table 1.
In order to improve understanding of the erosion phenomena, a distinction is made between the tests during which only clay particle migration is initiated, and the tests during which the transport of both clay particles and sand grains is observed. Maxi-mum erosion rates per sample cross section are preferred as a measurement indication to cumulative eroded mass information, because the erosion rate for the condition investigated here reaches its maximum value very quickly, which, therefore, means that it does not depend on the test length.
Clay Erosion
Fig. 6 shows that the internal erosion occurs when a 60 mm−1
hydraulic gradient is applied, but not with a 5 mm−1 hydraulic
gradient. Because the amount of eroded particles was too small to be weighed, the optical sensor, calibrated for kaolinite, was used for the clay erosion tests. From the beginning of the test, the mass flow given by the optical sensor increased until reaching a maxi-mum value qs max. It then decreased sharply, to finally end with an
asymptotic behavior toward zero.
When erosion is nonexistent, the permeability remained con-stant. It, however, decreased by a factor of 10 during the tests where erosion was initiated. Consequently, according to the pre-viously defined terminology, this phenomenon, characterized by some diffuse mass losses, can be called suffusion. In our tests, suffusion induces a clogging in the soil specimen. The tests show that the higher the hydraulic gradient, the bigger the mass of eroded clay. Fig. 7 represents the maximum erosion rate versus gradient curve 共for a soil with a 10% kaolinite content and 200 kPa confining pressure兲.
The results of the three tests, carried out with identical pa-rameter values 共i=20 m/m, 10% clay content, 3= 200 kPa兲,
demonstrate the good repeatability of the tests. The measure-ments show that this erosion phenomenon can be considered
as continuous. The substantial variations of the maximum erosion rate observed here can be represented using the following power law:
qs max= 12共100.02i− 1兲 共7兲
where the number of tests N = 8; and the correlation coefficient
r = 0.999. The curve analysis described by Eq. 共7兲 allows us to
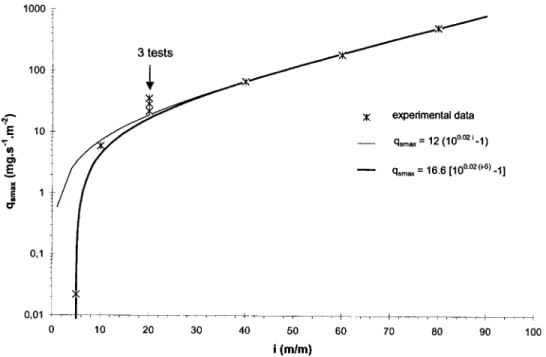
examine some elements concerning the critical gradient. The maximum erosion rate values are plotted according to a logarith-mic scale 共Fig. 8兲. For the smallest erosion rate value achieved using the optical sensor, the critical gradient is equal to 5 m/m. From Fig. 8, the maximum erosion rate is given by
qs max= 16.6关100.02共i−5兲− 1兴 共N = 8, r = 0.999兲 共8兲
The small difference between both expressions and the global curve shape reveals the difficulty in identifying the critical gradi-ent value precisely, all the more so since it also depends on the accuracy of the experimental setup used. Because the material resistance to erosion depends on the material’s inherent character-istics, clay content effects were also examined. Fig. 9 presents the maximum erosion rate as a function of the clay content. The values used here have been obtained with samples which have been consolidated at 100 kPa.
Table 1. Main Characteristics of the Tests
Number of sample Percentage of clay 共%兲 Confining pressure 共kPa兲 Hydraulic gradient 共m/m兲 S1 10 100 5 S2 10 100 20 S3 10 100 20 S4 10 100 60 S5 10 100 100 S6 10 100 110 S7 10 100 140 S8 10 150 20 S9 10 150 60 S10 10 150 100 S11 10 150 140 S12 10 150 140 S13 10 200 5 S14 10 200 10 S15 10 200 20 S16 10 200 20 S17 10 200 20 S18 10 200 40 S19 10 200 60 S20 10 200 80 S21 10 200 90 S22 10 200 100 S23 10 200 140 S24 10 250 90 S25 10 250 100 S26 20 100 20 S27 20 100 60 S28 20 100 100 S29 30 100 100 S30 30 100 100
These tests show that, depending on the hydraulic gradient, the erosion of the soils studied decreases as a function of the clay content according to
for i = 20 mm: qs max= − 0.06 % clay + 1.28 共N = 3 , r = 1兲
共9兲 for i = 60 mm: qs max= − 0.13 % clay + 2.85 共N = 2兲 共10兲
for i = 100 mm: qs max= − 0.17 % clay + 5.15
共N = 4 , r = 0.996兲 共11兲
In a general way, the erosion rate doubles when the clay content changes from 20 to 10%.
We note that when the kaolinite content increases, the initial permeability decreases, causing the global flow within the sample to be falling. The decrease in the particulate water velocityvpcan
then be estimated as
vp=
vm
n 共12兲
withvm= flow velocity within the sample共m/s兲 and n=porosity.
Darcy’s law gives
vp=
k⫻ i
n 共13兲
For a given hydraulic gradient and two kaolinite content val-ues共10 and 30%兲
Fig. 6. Typical time-mass flow curve共10%, 3= 200 kPa兲
i = constant =vp30%⫻ n30% k30%
=vp10%⫻ n10%
k10%
共14兲 Finally, with n30%= 30% and n10%= 33%, k30%= 1.5⫻10−7m / s
and k10%= 2.5⫻10−5m / s, we obtain
vp30%= 0.0066vp10% 共15兲
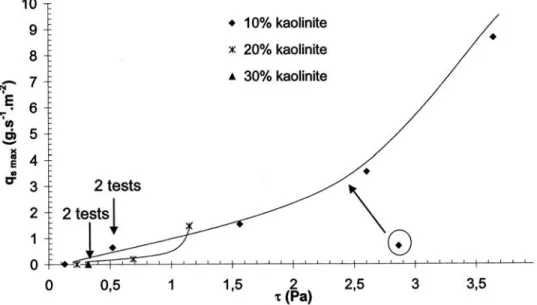
This solution shows that the particle velocity within sand/clay samples with a 30% kaolinite content is 150 times slower than with a 10% content. When the velocity decreases, the hydraulic shear stress generated by the flow within the samples also de-creases and contributes to increase the internal erosion resistance. With the intention of considering hydraulic gradient and porosity effects, the hydraulic shear stress is computed using Eq.共1兲. Fig. 10 represents the evolution of the maximum erosion rate according to the hydraulic shear stress for a confining pres-sure of 100 kPa.
The correlation between the data is not linear as regards to clay content values. The critical hydraulic shear stress value for different clay contents, however, can be determined graphically: cr= 0.13, 0.23, and 0.32 Pa for 10, 20, and 30% clay content
values, respectively.
Because the initial porosity of a soil depends on soil consoli-dation, studying the effects of the confining pressure is essential. For sand specimens subjected to odometer confinement condi-tions, Papamichos et al.共2001兲 observed that the maximum ero-sion rate increases with the applied axial pressure. The present tests, on the other hand, that were conducted under isotropic confinement with a 20 m/m hydraulic gradient and a 10% clay content, reveal some opposite results共Fig. 11兲.
Depending on the hydraulic gradient value, the linear decrease of the maximum erosion rate according to the confining pressure is expressed as Eqs.共16兲 or 共17兲
for i = 20 m/m: qs max= − 0.0063+ 1.256
共N = 6 , r = 0.9996兲 共16兲
for i = 60 m/m: qs max= − 0.0133+ 2.877
共N = 3 , r = 1兲 共17兲
Such an evolution underlines the necessity to use a flexible cell to subject the samples to stresses as close as possible to reality.
The growth in the confining pressure and, therefore, in the material consolidation increases the interparticulate contact bonds and intensifies the internal erosion resistance. If we con-sider a portion of the sample at a given height, it is possible to demonstrate that the hydraulic gradient growth causes locally a rise in the pore pressure and, at constant confining pressure, a decrease in the effective stress. The increase in the hydraulic gra-dient here appears to have the same effects as a reduction in the sample consolidation. This observation, however, does not apply to the bottom part of the sample, where the pore pressure remains nil.
Fig. 8. Influence of the hydraulic gradient on clay erosion, logarithmic scale共10% clay content, 3= 200 kPa兲
Fig. 9. Influence of the clay content and of the hydraulic gradient on
In conformity with the previous procedure, the maximum ero-sion rate is represented according to the hydraulic shear stress for different confining pressure values共Fig. 12兲.
To obtain the same maximum erosion rate, the hydraulic shear stress has to increase as a function of the confining pressure. However, because no clear classification appears here, the expres-sion of the hydraulic shear stress does not make it possible to consider the confining pressure effects on the maximum erosion rate accurately.
The result difference observed between the samples tested here and the Papamichos et al.共2001兲 specimens can be accounted for by many reasons: The characteristics of 共1兲 the pressure first, which can be isotropic or axial; 共2兲 the samples, which can be made of a sandy-clay mixture or composed of sand only;共3兲 the phenomena examined, which are interpreted to be suffusion or backward erosion; and共4兲 the sand grain angularity.
Clay and Sand Erosion
Considering two samples 共S9 and S11兲 both with a 10% clay content and consolidated at 150 kPa. The first sample subjected to the action of a hydraulic gradient of 60 m/m suffered some clay erosion, whose extent was measured using the optical sensor, and gave a clay eroded mass of 60 mg. Sample S11, on the other hand, subjected to a 140 m/m hydraulic gradient, gave a weighed eroded mass共clay and sand兲 of approximately 40 g 共Fig. 13兲.
The quantity of effluents achieved here 共17% of the sample initial volume兲 produces a substantial volume variation within the sample, which finally collapses, revealing then a significant change in the erosion mechanisms. Clay and sand particles are discharged from the soil downstream and along the upstream line through a backward erosion mechanism occurring within the sample.
Fig. 10. Maximum erosion rate according to hydraulic shear stress and clay content共3= 100 kPa兲
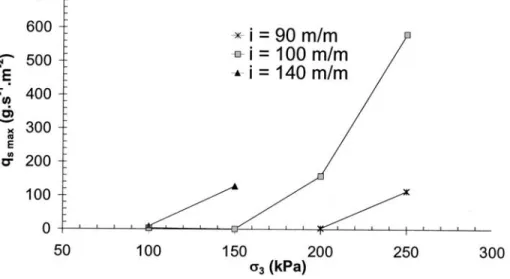
Fig. 14 shows the effects of the confining pressure on the maximum erosion rate 共determined by weighing regarding sand erosion兲. This confirms that when the confining pressure rises, sand erosion within the samples tends to increase. These results demonstrate the significance of confining pressure effects on sample performances. It confirms the existence of a secondary critical gradient, from which both clay and sand transportation is initiated. This gradient depends on the confining pressure, on the clay content, and on the material.
If the hydraulic gradient remains below this backwards erosion critical gradient value, confinement tends to increase the sample resistance to suffusion. When the hydraulic gradient, on the other hand, is higher than this value, backward erosion begins.
The backward erosion increase, as a function of confining pressure, confirms the Papamichos et al.共2001兲 conclusions that were achieved on the basis of tests with specimens made of sand only.
Conclusions and Perspectives
Mechanisms responsible for internal erosion are many, evolution-ary, and depend on different parameters. In the face of such
com-plexity, internal erosion initiation and development criteria found in the literature are closely dependent on the structure studied and, therefore, diverse.
New earth-structure recent failures reveal the inadequacy of the current criteria to assess internal erosion initiation and its development, and hence, the resulting variations in soil mechani-cal performances. Consequently, the design and development of a new experimental setup, which can be used for a test campaign that can systematically study the influence of parameters of con-cern here, appeared essential.
The experimental setup that was developed and is described in this paper can be used to saturate and consolidate samples made of sand and clay. The triaxial cells used in the setup have been modified to let the共static or dynamic兲 flow go through the core of the sample in a downward direction. Long-lasting tests are possible thanks to the automation of both the monitoring and the acquisition of the data. Moreover, the possibility to use three cells simultaneously makes it possible to reduce the time length of the test program. The internal erosion critical gradient can be assessed from the effluent’s instantaneous optical analysis. In order to address internal erosion development, injection vol-ume flow rates and obtained mass flow measurements are compared.
The erosion occurring within the clay fraction does not affect the particle size distribution nor the volume of the samples sig-nificantly. Permeability, only, decreases. The erosion mechanism concerned here is called suffusion. The impact of three different parameters on the initiation of suffusion were examined.
The rate of suffusion increases according to the hydraulic gra-dient. The study conducted to assess the suffusion initiation point gives a critical gradient on the order of 5 m per m. This value, however, being highly dependent on the accuracy of the setup used and on the properties of the soil studied, is, therefore, not generally applicable. For other soils tested, the critical gradient was higher. The initial clay content significantly affects suffusion mechanisms; the maximum erosion rate doubles when the clay content changes from 20 to 10%.
The material initial porosity is also an important parameter, which depends on the particle size analysis, on the one hand, and on the confining pressure, on the other hand. The suffusion maxi-Fig. 12. Maximum erosion rate according to hydraulic shear stress and confining pressure共10% clay content兲
Fig. 13. Cumulative eroded mass versus time共Samples S9 and S11,
mum erosion rate doubled when the confining pressure decreased from 150 to 100 kPa.
Because the hydraulic shear stress is a function of the above parameters, expressing it for the different tests appears essential. This approach makes it possible to identify the minimum stress levels, which depend on both clay contents and confining pres-sures, and below which suffusion will not occur for the soils tested:
For3= 100 kPa:
• cr= 0.13 Pa with a 10% clay content;
• cr= 0.23 Pa with a 20% clay content; and
• cr= 0.32 Pa with a 30% clay content.
For3= 200 kPa and a 10% clay content:cris approximately
0.42 Pa.
These values are several orders of magnitude greater than those in the case of surface erosion experiments, referring notably to the results from tests done in rotating cylinders共Arulanandan and Perry 1983兲 or hole erosion test 共Reddi et al. 2000兲. However, these values are four times smaller than those from the Reddi et al.共2000兲 measurements in the case of internal erosion experi-ments. The direct comparison of our results and the Reddi et al. 共2000兲 measurements seems to be difficult for the moment. The resulting differences observed between the samples tested here, and the Ottawa sand+ kaolinite mixtures tested by Reddi et al. 共2000兲 can be accounted for as a result of several factors. First, the characteristics of the filter, that can either be open or a porous stone, may be responsible for these differences. The sand itself could also play a role, as grain sizes and grain angularities were different in our and their experiments.
When the hydraulic gradient increases above a secondary threshold value, the erosion of sand grains is suddenly initiated and evolves very quickly as particle backward erosion, causing the whole sample to collapse. This erosion mechanism can be described as backwards erosion, but may be due to cracking of the sample under high gradients and loads.
Backward erosion critical gradient values are very high, and, like suffusion, depend on both clay content and confinement stress. For clay contents higher than 10%, no backwards erosion effect was observed, whereas with a 10% clay content, the back-ward erosion critical gradient is:
• 90 m/m with3= 200 kPa;
• 100 m/m with3= 150 kPa; and
• 140 m/m with3= 100 kPa.
These values confirm the complexity of confinement effects on internal erosion because, contrary to suffusion, confinement in-tensifies backward erosion. This experimental study opens up many new research prospects to address the problem of backward erosion development and quantization, while demonstrating the importance of confinement effects on internal erosion.
The performed tests point out that the processes measured here require higher gradients than are present in dams and dikes. This seems to show that for soils similar to those tested here, backward erosion and suffusion are probably not the preponderant phenom-ena that need to be considered for those structures.
Acknowledgments
Special thanks to Mr. Coué for his involvement in the production of the experimental device.
Notation
The following symbols are used in this paper: d50 ⫽ mean diameter;
i ⫽ hydraulic gradient; K ⫽ intrinsic permeability;
k ⫽ hydraulic Darcy’s permeability; m ⫽ cumulated eroded solid mass; mk out ⫽ kaolinite mass within the effluent;
mw inj ⫽ injected water mass;
mw out ⫽ water mass within the effluent; mw sam ⫽ water mass within the sample;
N ⫽ number of tests; n ⫽ porosity;
qs ⫽ erosive mass rate per unit surface;
qs max ⫽ maximum erosion rate per unit area;
qw ⫽ injection flow;
r ⫽ correlation coefficient;
Sopt ⫽ kaolinite content determined by the optical sensor;
s ⫽ sample cross-sectional area;
U ⫽ relative variation of optical sensor terminal
voltage;
vm ⫽ flow velocity;
vp ⫽ particulate water velocity;
␥w ⫽ volumic weight of water;
⌬L ⫽ sample height; ⌬P ⫽ pressure drop;
⌬P/⌬L ⫽ average pressure gradient; ⫽ dynamic viscosity; 3 ⫽ confining pressure;
⫽ hydraulic shear stress; and cr ⫽ critical hydraulic shear stress.
References
AFNOR.共1994兲. “Essais à l’appareil triaxial de révolution.” Rep. No. NF
P 94-074, Association Française de Normalisation.
Arulanandan, K., and Perry, E. B.共1983兲. “Erosion in relation to filter design criteria in earth dams.” J. Geotech. Engrg., 109共5兲, 682–698. Ayadat, T., Belouahri, B., and Ait Ammar, R.共1998兲. “La migration des particules fines comme approche d’explication du mécanisme de l’effondrement.” Revue Française de Géotechnique, 83, 73–81. Barakat, B.共1991兲. “Instabilité aux écoulements des milieux granulaires,
aspects morphologiques et probabilistes.” Ph.D. thesis, Ecole Centrale de Paris, France.
Bendahmane, F.共2005兲. “Influence des interactions mécaniques eau-sol
sur l’érosion interne.” Ph.D. thesis, Université de Nantes, France. Camapum De Carvalho, J., Crispel, J., Mieussens, C., and Nardone, A.
共1987兲. “La reconstitution des éprouvettes en laboratoire; théorie et pratique opératoire.” Rapport de Recherche LCPC No. 145. Daniel, D. E., Trautwein, S. J., Boynton, S. S., and Foreman, D. E.
共1984兲. “Permeability testing with flexible-wall permeameters.”
Geo-tech. Test. J., 7共3兲, 113–122.
Foster, M., Fell, R., and Spannagle, M.共2000兲. “The statistics of embank-ment dam failures and accidents.” Can. Geotech. J., 37, 1000–1024. Kenney, T. C., and Lau, D.共1985兲. “Internal stability of granular filters.”
Can. Geotech. J., 22, 215–225.
Khilar, K. C., Fogler, H. S., and Gray, D. H.共1985兲. “Model for piping-plugging in earthen structures.” J. Geotech. Engrg., 111共7兲, 833–846. Lafleur, J., Mlynarek, J., and Rollin, A. L.共1989兲. “Filtration of broadly graded cohesionless soils.” J. Geotech. Engrg., 115共12兲, 1747–1768. Monnet, A. 共1998兲. “Boulance, érosion interne, renard. Les instabilités
sous écoulement.” Revue Française de Géotechnique, 82, 3–10. Papamichos, E., Vardoulakis, I., Tronvoll, J., and Skjærstein, A.共2001兲.
“Volumetric sand production model and experiment.” Int. J. Numer.
Analyt. Meth. Geomech., 25, 789–808.
Reddi, L. N., Lee, I., and Bonala, M. V. S. 共2000兲. “Comparison of internal and surface erosion using flow pump test on a sand-kaolinite mixture.” Geotech. Test. J., 23共1兲, 116–122.
Skempton, A. W., and Brogan, J. M.共1994兲. “Experiments on piping in sandy gravels.” Geotechnique, 44共3兲, 440–460.
Tomlinson, S. S., and Vaid, Y. P.共2000兲. “Seepage forces and confining pressure effects on piping erosion.” Can. Geotech. J., 37, 1–13. Wan, C. F., and Fell, R. 共2004兲. “Investigation of erosion of soils in