HAL Id: dumas-01615582
https://dumas.ccsd.cnrs.fr/dumas-01615582
Submitted on 12 Oct 2017
HAL is a multi-disciplinary open access archive for the deposit and dissemination of sci-entific research documents, whether they are pub-lished or not. The documents may come from teaching and research institutions in France or abroad, or from public or private research centers.
L’archive ouverte pluridisciplinaire HAL, est destinée au dépôt et à la diffusion de documents scientifiques de niveau recherche, publiés ou non, émanant des établissements d’enseignement et de recherche français ou étrangers, des laboratoires publics ou privés.
Impact d’un environnement de soins comprenant un
programme d’éducation thérapeutique sur la survie des
personnes porteuses de cirrhose virale B et C : cohorte
CIRVIR
Aude Turcry
To cite this version:
Aude Turcry. Impact d’un environnement de soins comprenant un programme d’éducation thérapeu-tique sur la survie des personnes porteuses de cirrhose virale B et C : cohorte CIRVIR. Médecine humaine et pathologie. 2017. �dumas-01615582�
AVERTISSEMENT
Ce document est le fruit d'un long travail approuvé par le
jury de soutenance et mis à disposition de l'ensemble de la
communauté universitaire élargie.
Il n’a pas été réévalué depuis la date de soutenance.
Il est soumis à la propriété intellectuelle de l'auteur. Ceci
implique une obligation de citation et de référencement
lors de l’utilisation de ce document.
D’autre part, toute contrefaçon, plagiat, reproduction illicite
encourt une poursuite pénale.
Contact au SID de Grenoble :
bump-theses@univ-grenoble-alpes.fr
LIENS
LIENS
Code de la Propriété Intellectuelle. articles L 122. 4
Code de la Propriété Intellectuelle. articles L 335.2- L 335.10
http://www.cfcopies.com/juridique/droit-auteur
1
UNIVERSITE GRENOBLE ALPES FACULTE DE MEDECINE DE GRENOBLE
Année 2017
IMPACT D’UN ENVIRONNEMENT DE SOINS
COMPRENANT UN PROGRAMME D’EDUCATION
THERAPEUTIQUE SUR LA SURVIE DES
PERSONNES PORTEUSES DE CIRRHOSE VIRALE
B ET C : COHORTE CIRVIR
THESE PRESENTEE POUR L’OBTENTION DU DOCTORAT DE MEDECINE DIPLÔME D’ETAT
Aude TURCRY
THESE SOUTENUE PUBLIQUEMENT A LA FACULTE DE MEDECINE DE GRENOBLE*
Le 09 octobre 2017
DEVANT LE JURY COMPOSE DE
Président du jury : Monsieur le Professeur Vincent LEROY Membres
Madame le Docteur Marie-Noëlle HILLERET Directrice de thèse Madame le Docteur Magalie BAUDRANT
Monsieur le Professeur Thomas DECAENS Monsieur le Docteur Matthieu ROUSTIT
*La Faculté de Médecine de Grenoble n’entend donner aucune approbation ni improbation aux opinions émises dans les thèses ; ces opinions sont considérées comme propres à leurs auteurs.
2 SOMMAIRE
LISTE DES ENSEIGNANTS DE LA FACULTE DE MEDECINE 2017-2018...3
LISTE DES ABBREVIATIONS………..7
RESUME………8
INTRODUCTION………...10
1. Education thérapeutique du patient (ETP)………..10
2. Efficacité dans les pathologies chroniques……….19
3. Exemples du Programme du CHU de Grenoble……….21
ARTICLE (version anglaise)………..23
Abstract……….24
1. Introduction………...………….26
2. Materials and methods………28
3. Results……….32 4. Discussion………...………50 Appendix………...54 ANNEXES………57 CONCLUSION………74 REFERENCES………76 SERMENT D’HIPPOCRATE………...80 REMERCIEMENTS………..81
7
ABBREVIATIONS
ALD : affection de longue durée (équivalent de LDD, long duration disease) ANRS : Agence Nationale de Recherche sur le SIDA et les hépatites virales
ARS : Agence régionale de Santé BEP : bilan éducatif partagé
ETP : Education thérapeutique du Patient (équivalent de PE : Patient Education) HAS : Haute autorité de santé
HSPT : Hôpital, santé, patients, territoires (loi du 21 juillet 2009) OMS : Organisation Mondiale de la Santé
Siinram : système national d’information inter-régime de l’Assurance Maladie
SNP : polymorphisme d’un seul nucléotide (équivalent de Single Nucleotide Polymorphisms), marqueurs en
8
RESUME
Contexte : L’éducation thérapeutique pour les patients porteurs d’hépatite chronique virale C
a prouvé son utilité mais les bénéfices d’activités éducatives autour de la cirrhose restent inconnus.
Objectif : L’objectif de cette étude est d’évaluer l’impact d’un environnement de soins
comportant un programme éducation thérapeutique des patients (ETP) porteurs de cirrhose virale B et C.
Patients et Méthodes : Dans une étude rétrospective analytique multicentrique au sein de la
cohorte française CIRVIR comprenant 1671 patients, nous avons comparé la survie globale entre les patients issus de centres proposant un programme d’ETP, intégrant des actions éducatives autour de la cirrhose (Groupe 1) et les patients issus de centres sans programme d’ETP (Groupe 2). Les patients issus de centres proposant un programme d’ETP, n’intégrant pas d’actions éducatives autour de la cirrhose, ont été exclus. Les critères de délai régulier d’échographie abdominale, d’incidence de réponse virologique soutenue au traitement anti-viral de l’hépatite B ou C, des évènements hépatiques, de traitement initial curatif si apparition d’un carcinome hépatocellulaire(CHC), de sevrage des addictions (tabac, alcool et toxicomanie), d’évolution pondérale, de mortalité hors cause hépatique et de durée médiane de suivi ont été également analysés de manière univariée.
Résultats: 280 patients de 6 centres répartis dans le Groupe 1 et 459 patients de 15 centres
répartis dans le Groupe 2, ont été inclus entre 2008 et 2012 de la cohorte CIRVIR et suivis jusqu’au 31 décembre 2016. 932 patients dont 148 d’un centre refusant de participer ont été exclus. Il n’y avait pas de différence significative de survie (85.7% soit 47 décès à 6 ans de
9
suivi pour le Groupe 1 et 87.8% à 6 ans de suivi soit 60 décès pour le Groupe 2; p=0.40), également après ajustement sur un score de propension (HR=0.85 [0.45 ; 1.63], p=0.63). Le suivi médian était significativement plus élevé dans le Groupe 1 (75.5 mois [IQR : 47.5 – 98.7] versus 67.3 mois [IQR : 45.2 – 89.8], p=0.026). Il y avait significativement plus de prise en charge initiale curative de CHC dans le Groupe 1 que dans le Groupe 2 (32 sur 44 patients soit 78.1% versus 27 sur 59 patients soit 54% ; p=0.017). Il n’y avait pas de différence entre les 2 groupes pour les autres critères.
Conclusion : Cette étude ne retrouve pas d’effet de l’environnement de soins intégrant une
proposition d’ETP portant sur la cirrhose sur la survie globale des patients porteurs de cirrhose virale B et C. Cependant, elle suggère que cet environnement de soins pourrait être associé à un traitement initial curatif du carcinome hépatocellulaire plus fréquent. Une étude prospective avec comparaison de populations aux critères de prise en charge médicale strictement homogènes pourrait confirmer cette hypothèse.
Mots clés:
- Education thérapeutique du patient - Cirrhose
- Hépatite chronique B - Hépatite chronique C - Cohorte CIRVIR
10
INTRODUCTION
1. Education thérapeutique du patient
1.1. Définition :
Selon le rapport de l’OMS (1996), « l’éducation thérapeutique du patient vise à aider les patients à acquérir ou maintenir les compétences dont ils ont besoin pour gérer au mieux leur vie avec une maladie chronique. Elle fait partie intégrante et de façon permanente de la prise en charge du patient. Elle comprend des activités organisées, y compris un soutien
psychosocial, conçues pour rendre les patients conscients et informés de leur maladie, des soins, de l’organisation et des procédures hospitalières, et des comportements liés à la santé et à la maladie. Ceci a pour but de les aider (ainsi que leurs familles) à comprendre leur maladie et leur traitement, collaborer ensemble et assumer leurs responsabilités dans leur propre prise en charge dans le but de les aider à maintenir et améliorer leur qualité de vie. Une information orale ou écrite, un conseil de prévention peuvent être délivrés par un professionnel de santé à diverses occasions, mais ils n’équivalent pas à une éducation thérapeutique du patient. » [1].
C’est un ensemble de pratiques visant à permettre au patient l’acquisition de
compétences, afin de pouvoir prendre en charge de manière active sa maladie, ses soins
et sa surveillance, en partenariats avec ses soignants, tout en optimisant sa qualité de vie.
Ainsi, elle ne vise pas seulement à apporter une information. En effet, plusieurs méta-analyses montrent que l’information seule dans le cadre de maladies chroniques ne suffit pas à aider les
11
patients à gérer leur maladie au quotidien [2], [3] (dans le cadre de l’asthme, la polyarthrite rhumatoïde, la prise au long cours d’AVK).
1.2. Historique et contexte d’apparition de l’Education Thérapeutique
Les dernières décennies ont vus apparaitre de nombreux progrès diagnostic, techniques et médicamenteux dans la pratique médicale. Les choix médicaux, les consensus et les
recommandations s’appuient ainsi sur les preuves des études thérapeutiques (evidence-based medecine). Parallèlement à ces avancées, la pratique d’éducation thérapeutique a été s’est développée pour répondre à plusieurs enjeux : l’observance, l’évolution sociologique et l’épidémiologie sanitaire.
A- La non-observance et ses conséquences[4]:
La non-observance reste un phénomène fréquent, correspondant à environ un patient sur deux. Il s’agit d’un phénomène intemporel et non d’une « déviance ». La non-observance est déjà observée un siècle avant JC par Démocrite « les hommes demandent aux dieux la santé dans leur prières, mais ils ne savent pas qu’ils possèdent en eux-mêmes le pouvoir de l’obtenir. Mais ils font tout le contraire par manque de tempérance et livrent eux-mêmes par trahison leur santé aux passions » puis par Hippocrate dans Bienséance « il faut observer les fautes des malades ; il ait arrivé plus d’une fois qu’ils aient menti au sujet des choses
prescrites »[5] et enfin, par Aristote déclare dans Ethique à Nicomaque « le malade ne recouvrera pas la santé, et il peut arriver qu’il soit malade par sa faute, en menant une vie de désordres et n’obéissant pas aux médecins ».
12
La non-observance est qualitative : il n’y a pas de patient complètement non-observant ou observant. Elle est déterminée par :
- les facteurs liés au patient : croyances, connaissances, émotions, addictions, état psychique, caractère personnel
- les facteurs liés à la maladie : chronique, présence de symptômes ou non - les facteurs liés au système de soins : organisation des soins
- les facteurs liés au traitement : sa durée, ses effets indésirables
- les facteurs socio-économiques : âge, rapports sociaux, accès aux soins
Les conséquences de la non-observance sont :
- individuelles :
La non-observance est un facteur de risque de mortalité (BB HAT[6]), de traitement injustifié ou biaisé (surenchère thérapeutique par le médecin car absence de résultats avec le traitement prescrit initialement) et modifie la qualité de vie.
- collectives de santé :
La non-observance entraîne un coût de santé (médicaments non utilisés, explorations multiples inutiles), entraîne des ré-hospitalisations sur les décompensations de la maladie[6]–[8].
B- L’évolution sociologique de la relation soignant-patient
L’intérêt sociologique pour l’éducation thérapeutique nait dans les années soixante-dix lors du passage d’une pédagogie médicale verticale, autoritariste et passive à une pédagogie basée sur la reconnaissance du droit des malades et sur le développement de l’autonomie du patient dans l’éthique médicale anglo-saxonne. L’observance ou compliance est définie à partir de 1975 par Sacckett et Haynes[9], [10] comme « le degré de concordance entre les
13
comportements des patients, en terme de prise de médicaments, de suivi d’un régime ou de changements de mode de vie et les recommandations médicales ou en terme de santé ». Puis la relation médecin-malade et le rôle du patient se modifient progressivement : des années quatre-vingt aux années deux-mille, on parle de «l'obéissance liée à la confiance»
[11](Burner), de « coopération » (Tauber) puis d’adhésion au traitement. Parallèlement, la multiplicité des moyens de communication et d’information de santé augmentent les connaissances de santé des patients et modifient leurs attitudes et leurs comportements.
C- Epidémiologie sanitaire et prévention de Santé publique
On assiste à un développement croissant de maladies devenant chroniques par les
améliorations pharmacologiques de ces cent dernières années : diabète insulinorequérant, maladies cardiovasculaires (HTA, angor, insuffisance cardiaque), asthme, BPCO, maladies virales complexes tel que le VIH, cancers, hépatites chroniques... Elles sont contrôlées mais non guéries, évoluant souvent par épisodes aigus et nécessitent une prévention de leurs complications chroniques. Elles concernent 20% de la population française, 1/3 population des pays d’Europe de l’Ouest et d’Amérique du Nord puis progressivement les autres pays. Leur traitement et leur suivi sont souvent contraignants car ils sont effectifs au long cours et interférent avec la vie sociale du patient. Ils nécessitent un apprentissage du patient.
D- Création de programmes d’Education Thérapeutique du Patient (ETP)
Les premières démarches concrètes d’éducation thérapeutique apparaissent dans la prise en charge du diabète (premier manuel d’éducation des diabétiques de Eliott P. Joselin 1941) puis elles sont promut par le Pr J.P. Assal en 1975 en Suisse. Associé à la notion de Santé
14
Publique, l’OMS développe l’éducation thérapeutique à partir des années quatre-vingt puis définit l’ETP en 1998.
En France, l’HAS publie en avril 2007 le plan d’amélioration de la qualité de vie des personnes atteintes de maladies chroniques 2007-2011. Puis, le 21 juillet 2009, le Ministère de la Santé publie la loi Hôpital, santé, patients, territoires (HSPT) inscrivant les programmes d’ETP dans le parcours de soins du patient (code de Santé Publique)[12], [13].
1.3. Cadre législatif et organisation globale de l’ETP :
Un programme d’Education Thérapeutique peut être conduit dans les établissements de santé, en médecine de ville, dans un réseau de santé ou dans une association. Il doit correspondre au cahier des charges national (défini dans l'arrêté du 14 janvier 2015) et concerne une affection de longue durée (liste ALD 30).
Conformément à la loi HPST, la réalisation d’un programme d’ETP nécessite :
- une demande d’autorisation par le Directeur Général de l’Agence Régionale de Santé, validée pour 4 ans.
- une auto-évaluation annuelle qualitative et quantitative du programme transmise à l’ARS.
- un renouvèlement d’autorisation tous les 4 ans par une nouvelle demande à associer à un rapport d’évaluation quadriennale (recommandations HAS rééditées en mai 2014, article L1162-1 du code de la santé publique).
L'équipe impliquée dans la mise en œuvre du programme (intervenants) doit comporter au minimum deux professionnels de santé de professions différentes ou au mieux une équipe multi professionnelle, formée à la démarche d’ETP (minimum 40h de formation certifiée).
15
Elle peut comprendre des médecins généralistes et spécialistes (hospitaliers et libéraux), des pharmaciens, des infirmiers, des addictologues, des psychologues, des diététiciens. Elle concerne également des intervenants non soignants de l’organisation de la prise en charge de la maladie chronique : le patient lui-même, les associations de patients, les travailleurs sociaux[1].
L'ARS peut financer un programme d’ETP si il présente une activité externe et intègre un travail en réseau (ateliers au plus près des lieux de vie des patients, association avec les représentants de patients et de leurs proches, communication avec les médecins traitants…) :
- l’ETP de ville est financée par le Fond d'Intervention Régional (FIR)
- l’ETP d’établissement de santé est financée par la tarification à l’activité (T2A) des établissements de santé ou la dotation annuelle de financement
1.4. But de l’ETP
L’éducation thérapeutique du patient vise à améliorer la santé du patient (biologique, clinique) et à améliorer sa qualité de vie et celles de ses proches.
Les finalités spécifiques du programme personnalisé de chaque patient, selon son contexte psychosocial, sont l’acquisition et le maintien de compétences[14] :
A- d’auto-soins : décisions prises par le patient pour modifier l’effet de la maladie sur sa santé. Il y a notamment l’acquisition de compétences dites de sécurité visant à
sauvegarder la vie du patient, qui dépend des besoins spécifiques de chaque patient. Elles comprennent :
16 Prendre en compte les résultats d’une autosurveillance, d’une automesure
Adapter des doses de médicaments, initier un autotraitement.
Réaliser des gestes techniques et des soins.
Mettre en oeuvre des modifications à son mode de vie (équilibre diététique, activité physique, etc.).
Prévenir des complications évitables.
Faire face aux problèmes occasionnés par la maladie.
Impliquer son entourage dans la gestion de la maladie, des traitements et des répercussions qui en découlent
B- d’adaptation : compétences personnelles et interpersonnelles, cognitives et physiques permettant au patient de maîtriser et de diriger son existence, et d'acquérir la capacité à vivre dans son environnement et à modifier celui-ci. Elles font partie d’un ensemble plus large de compétences psychosociales, s’appuyant sur le vécu et l’expérience antérieure du patient. Elles comprennent :
Se connaître soi-même, avoir confiance en soi.
Savoir gérer ses émotions et maîtriser son stress.
Développer un raisonnement créatif et une réflexion critique.
Développer des compétences en matière de communication et de relations interpersonnelles.
Prendre des décisions et résoudre un problème.
Se fixer des buts à atteindre et faire des choix.
S’observer, s’évaluer et se renforcer.
1.5. Procédure et place de l’ETP dans le parcours de soins
L’offre d’éducation thérapeutique à un patient porteur de maladie chronique suit l’annonce du diagnostic ou une période de vie avec la maladie, sans prise en charge éducative. Elle peut être refusée ou reportée dans le temps.
17
A- La procédure d’un programme d’ETP comporte 4 étapes:
- un diagnostic éducatif : il permet une définition des priorités d’apprentissage par le patient et le professionnel de santé. Le diagnostic éducatif s’appuie sur l’évaluation des besoins et de l’environnement du patient. Il correspond au Bilan éducatif partagé (BEP).
- définition du programme personnalisé d’ETP : à la fin de la séance d’élaboration du diagnostic éducatif, on définit avec le patient les compétences à acquérir au regard de son projet et de la stratégie thérapeutique. On planifie un programme individuel.
- mise en œuvre des séances collectives ou individuelles réalisées pour l’acquisition et le maintien des compétences selon les possibilités locales (accessibilité géographique, disponibilité des professionnels de santé), les besoins et préférences du patient. Elles sont planifiées et convenues avec le patient.
- réalisation d’une évaluation individuelle des compétences acquises, des transformations du vécu de la maladie au quotidien à la fin du programme et/ou au cours de la procédure. Le diagnostic éducatif est actualisé si l’évaluation n’atteint pas les objectifs éducatifs.
B- L’ETP s’inscrit ainsi dans le parcours de soins du patient : critères de qualité [1]
L’éducation thérapeutique du patient est un processus centré sur le patient, intégré dans les soins et continu [14].
18
- Elle tend à s’intégrer à la prise en charge thérapeutique : complémentarité avec les traitements et les soins, soulagement des symptômes, prévention des complications. - Elle prend en compte des besoins spécifiques, comorbidités et des vulnérabilités
psychologiques et sociales, des facteurs environnementaux et des priorités définies avec le patient.
- Elle est adaptée à l’évolution de la maladie et au mode de vie du patient ; elle fait partie de la prise en charge à long terme.
- Elle s’appuie sur les fondements scientifiques (recommandations professionnelles, littérature scientifique pertinente, consensus professionnel), et elle est enrichie par les retours d’expérience des patients et de leurs proches, pour ce qui est du contenu et des ressources éducatives.
1.6. Evaluation de l’ETP
A- Evaluation du patient et de son entourage
- dimension pédagogique : acquisition de compétences d’auto-soins et d’adaptation - dimension bioclinique : état général, décompensations cliniques, marqueurs
biologiques
- dimension psychosociale : qualité de vie, état psychologique, croyances
B- Evaluation du programme (recommandations HAS rééditées en 2014)
- évaluation de l'activité : rapport d’activité (nombre de patients ayant bénéficié de l’activité, ayant refusé le programme, profil des patients, nombre de séances par
19
patient et par an, nombre de patients dont les compétences ont été atteintes à l’issue du programme …)
- évaluation du processus : en fonction du rapport d’activité, de l’auto-évaluation de la satisfaction et de la perception d’utilité du programme par les patients et de l'atteinte des objectifs fixés par l'équipe. Mise en évidence par l’équipe des axes d’amélioration du programme et planification des actions/modifications à apporter.
- évaluation de l’impact du processus : Pour chaque objet d’évaluation, il est définit des indicateurs et critères d’évaluation recueillis, propre à chaque programme et maladie chronique (critères cliniques, biologiques, échelle d’observance médicamenteuse, critères en rapport avec l’amélioration de la qualité de vie, paramètres sociaux, économiques…).
2. Efficacité dans les pathologies chroniques dans la littérature
2.1. Diabète
L’éducation thérapeutique s’est développée initialement pour les malades du diabète, après l’arrivée de l’insuline en 1924 puis l’apparition des complications chroniques du diabète. D’après la littérature, les mesures d’éducation thérapeutique permettent une diminution de la fréquence des comas diabétiques par acidocétose [15], des amputations[16], de l’Hba1c[17]. Elle permet également une réduction des dépenses de santé[18] et une amélioration
20
2.2. Cardiopathie et risque cardiovasculaire
L’éducation thérapeutique permet une amélioration du risque cardiovasculaire dont le score de Framingham dans le programme européen EUROACTION[20] et le programme français PEGASE[21]. Le risque de récidive d’infarctus non mortel était diminué pour les patients suivant un programme éducatif prolongé sur 3 ans, au décours d’une réadaptation cardiaque (étude italienne GOSPEL[22]). L’éducation thérapeutique est recommandée dans
l’insuffisance cardiaque[23], [24]. Une étude montre diminution d’hospitalisation dans les suites de chirurgie cardiaque[25] en cas de programme d’éducation thérapeutique.
2.3. Risque iatrogène AVK
L’éducation thérapeutique permet une augmentation de l’observance, une connaissance maniabilité AVK et une diminution de la labilité de l’INR[26]. Dans l’étude multicentrique prospective EDUC’AVK[27], elle diminuait le risque d’incidence d’évènement hémorragique ou thrombotique.
2.4. Maladie respiratoire chronique et asthme
Les études d’éducation thérapeutique dans l’asthme ont montré une amélioration du contrôle de l’asthme [28], [29] et de la qualité de vie avec l’éducation thérapeutique. Une étude américaine retrouve également une diminution de la fréquence des exacerbations[30] en cas de programme éducatif. Il y a peu de données de l’effet éducatif pour les patients porteurs de bronchite chronique obstructive (diminution de la sensation de dyspnée et de l’altération de l’état général[31]).
21
2.5. VIH
L’éducation thérapeutique des patients VIH améliore l’observance, permet une diminution de résistance et une amélioration de la réponse virologique au traitement[32]–[34]. Elle permet également la diminution de transmission périnatale[35].
2.6. Cancérologie
Dans la littérature, l’éducation thérapeutique a montré une efficacité sur la résolution des douleurs faibles à modérées [36].
2.7. Hépatites chroniques : Hépatite C
L’étude multicentrique prospective française PegOBs retrouve une améliore de la réponse virologique soutenue (37.7% versus 25%, p<0.05) en cas de consultation éducative
systématique par une infirmière auprès de patients VHC en cours de traitement par interféron pégylé + ribavirine avec OR= 2-3 (Larrey and al. 2012) [37], [38].
De même, l’’étude CheObs prospective multicentrique retrouve que l’éducation thérapeutique pour les patients génotype 2/3 patients aide au maintien de l’adhérence à la bithérapie
interferon et ribavirine (OR=1.58, p=0.04)[39], [40] (Cacoub and al. 2008). Il n’y a pas de littérature concernant l’hépatite B chronique.
3. Exemple d’ETP a CHU de Grenoble
Au CHU de Grenoble, le programme d’ETP a été validé par l’ARS en janvier 2011, renouvelé en 2015, et s’adresse aux patients vus en ambulatoires porteurs d’une hépatite virale
22
L’objectif général est le maintien de l’adhésion à la prise en charge médicale des patients porteurs d’hépatite virale chronique, avec ou sans thérapeutique antivirale.
Les objectifs spécifiques sont l’acquisition et la mobilisation de compétences liée à la maîtrise du risque de transmission VHB et/ou VHC, à la connaissance de la maladie, aux comorbidités (alcool, cannabis, surpoids), la capacité à initier une thérapeutique antivirale, le maintien d’une observance optimum quel que soit les circonstances de vie quotidienne, le maintien d’une insertion socioprofessionnelle, le maintien d’une qualité de vie jugée acceptable par le patient.
L’équipe pluridisciplinaire du programme ETP est composée d’hépatologues, d’un
pharmacien, d’infirmières et d’une psychologue. Un partenariat avec le réseau ville hôpital « Prométhée Alpes réseau », permet à tout patient de bénéficier de la proposition d’un accompagnement psycho social associé.
L’efficacité du programme est jugée auprès du patient par :
- des critères cliniques (rupture thérapeutique ou mauvaise réalisation des prescriptions) - des critères psychosociaux (« auto »critères de qualité de vie, adéquation du mode de
vie du patient avec les recommandations, situation socio professionnelle, stratégies mise en place pour le maintien d’efficacité thérapeutique et pour une réduction des comorbidités…).
L’analyse des effets du programme ont fait évolué progressivement les objectifs
pédagogiques avec notamment la nécessité d’aborder plus spécifiquement le contexte des
patients porteurs de maladies sévères hépatiques (fibrose hépatique extensive,
cirrhose) : « beaucoup de patient formulent lors des entretiens d’évaluation, la difficulté
23
ARTICLE
Impact of care environment including Patient Education
on people with viral cirrhosis B and C overall survival: the
CIRVIR cohort study
24
A
B
S
T
R
A
C
T
Backgrounds: Patient education (PE) for chronic carriers of viral hepatitis C has proved his
utility but benefits of educational activities around viral cirrhosis remains unclear.
Aims: This study aims to evaluate the impact of care environment including PE program on
patients outcome with viral cirrhosis B and C.
Methods: In a multicenter retrospective analytical study within the French CIRVIR group including 1671 patients, we compared the overall survival between patients from centers offering a PE program which integrates educational activities around cirrhosis (Group 1) and patients from centers which do not offer any PE program (Group 2). Patients from centers with a PE program which does not integrate educational activities around cirrhosis were excluded. The criteria for regular abdominal ultrasound monitoring, sustained virological response to anti-viral therapy, incidence of hepatic events, initial curative treatment with hepatocellular carcinoma (HCC), smoking cessation, alcohol and drug withdrawal,
overweight improvement, mortality apart from liver cause and median follow-up were also compared in univariate analysis.
Results: 280 patients divided into 6 centers in Group 1 and 459 patients divided into 15
centers in Group 2 within the CIRVIR cohort were enrolled between 2008 and 2012, followed up until 31 December 2016. 932 patients, among whom 148 patients from a center which refused to participate, were excluded. There was no significant difference in survival (85.7%, n=47 deaths with 6 years of follow-up for Group 1 and 87.8% with 6 years of follow-up, n=60 deaths for Group 2; p = 0.40), also adjusted with a propensity score (HR=0.85 [0.45 ; 1.63], p=0.63).
The mean follow-up was significantly higher in Group 1 (75.5 months [IQR: 47.5 - 98.7] versus 67.3 months [IQR: 45.2 - 89.8]; p = 0.026). There was significantly higher initial HCC
25
curative treatment in Group 1 than in Group 2 (32 of 44 patients or 78.1% versus 27 of 59 patients or 54%; p=0.017). There was no difference between the 2 groups as for the other criteria.
Conclusions: This study does not find any effect on overall survival of environment care with
PE focused on cirrhosis in patient with viral cirrhosis B and C. However, it suggests that this environment care is associated with a more frequent initial curative treatment of
hepatocellular carcinoma. A prospective study comparing populations with strictly homogeneous medical care criteria could confirm this hypothesis.
Keywords:
Patient education Viral cirrhosis Hepatitis C Hepatitis B
26
1. Introduction
The importance of patient education(PE) in the management of chronic diseases such as diabetes or ischemic heart disease is demonstrated in the literature [1–4]. It "aims to help patients to acquire or maintain the competences they need to manage their lives with chronic disease" [1].
Promoting PE and optimizing coordination between different care stakeholders is a priority of the DHUMEAUX Report of Recommendations in 2014, under the aegis of French Society for Hepatology (AFEF) and National Agency for AIDS and Viral Hepatitis Research (ANRS) [43], [44]. Several French studies had shown a better adhesion and a more frequent virological cure with PE in chronic hepatitis C treated with pegylated interferon and ribavirin [38], [40], [45].
The impact of PE is currently discussed in chronic viral hepatitis HBV and HCV, especially with the emergence of effective and short-lived antiviral drugs. However, no study has yet analyzed its effect on cirrhotic disease, viral hepatitis being the underlying cause.
According to SNIIRAM (National Health Insurance Information System), in France, there were 63,000 peoples with LDD 6 status (long duration disease), for chronic hepatitis C in 2015. Likewise, there were 20,500 people in LDD 6 for chronic hepatitis B in 2015, progressively increasing since 2013 [46], [47]. This population is often concerned by social precarity (CMU, addictive comorbidities, emigrants), thus making hepatitis detecting and regular monitoring more complicated [46], [47].
Chronic viral hepatitis progresses to cirrhosis in 20-30% of cases. In France, there is an increasing exposure to the metabolic syndrome and a high level of alcoholism. Overweight,
27
diabetes and alcohol abuse speed up the development of cirrhosis[48]–[54]. Besides, cirrhosis exposes to clinical decompensation (portal hypertension with oesogastric varices, ascites, hepatic encephalopathy, infections) and hepatocellular carcinoma (75-80% of HCC comes from cirrhosis)[55], [56]. Chronic viral hepatitis annual mortality between 2004 and 2011 in metropolitan France was 1,500 for HBV and 3,600 for HCV [57]. Eventually, complications of cirrhosis account for 50-60% of their mortality[57], [58].
Based on these findings, we wanted to define the role of PE in the care strategy for patients with chronic viral cirrhosis B and C and their comorbidities.
The primary endpoint of this study was to evaluate the impact of a care environment including personalized PE program (PE) on overall survival in patients of CIRVIR cohort with viral B and C cirrhosis. Sustained virological response to anti-viral treatment, comorbidities such as overweight, tobacco, alcohol and drug abuse, hepatic events, adherence to abdominal ultrasound monitoring, initial curative treatment with hepatocellular carcinoma (HCC), mortality apart from liver cause (cardiovascular, cancer and other causes) and median follow-up were also evaluated.
The analysis compared two modalities of support management: patients followed in centers offering a PE program which integrates educational activities around cirrhosis and patients followed in a center which do not offer any PE program.
28
2. Materials and methods
2.1. Study design
A retrospective analytical epidemiological study based on data from patients included in the CIRVIR cohort between 2006 and 2012 was performed. The cohort was founded and promoted by the ANRS. The protocol was approved by the Ethics Committee (Aulnay-sous-Bois, France) and consistent with the ethical recommendations of the 1975 Helsinki
Declaration[58]. All patients gave their written consent to participate. These patients were aged 18 or older, with histologically proven cirrhosis, had at least one criterion proving the viral origin of cirrhosis (positive anti-HCV antibody, positive C viral RNA and / or positive Hbs antigen) and no previous cirrhosis complications (i.e. ascites, encephalopathy, digestive hemorrhage, hepatocellular carcinoma). In 35 metropolitan France centers, objectives of follow-up were every six months; according to French Health Authority (HAS)
recommendations, until December 31st, 2016, when the cohort was stopped.
2.2. Type of health care
Patients were divided into 3 groups according to the care support method provided by their center:
1- patients followed-up in a center offering a PE program which integrated educational activities around cirrhosis, approved by the Regional Health Agency (ARS) between 2010 and 2014 (Group 1 or PE+ cirrhosis),
29
2- patients followed-up by a support nurse or attending only a regular medical consultation, in a center which did not offer any PE program (Group 2 or PE-) and 3- patients followed-up in centers offering an ARS-validated PE program between 2010
and 2014 focusing on hepatitis C and / or B, which did not integrate any educational activities around cirrhosis (Group 3 or PE+ without cirrhosis).
To that end, the CIRVIR investigators and / or the care staff from each center were reached by telephone between July 2016 and February 2017 to answer a single questionnaire validated by the CIRVIR Scientific Committee in June 2016. The telephone questionnaire was carried out by a junior doctor of the Hepato-Gastroenterology department of the University Hospital of Grenoble. The junior doctor had no prejudices against any support care methods on cirrhotic viral hepatitis PE in metropolitan France centers.
This questionnaire asked about the presence or not of an PE for hepatic chronic diseases validated by the ARS between 2010 and 2014, and about the support care environment of each center: presence of a support nurse or a nurse dedicated to the hepatology consultation, other people such as pharmacist, dietician, psychologist or psychiatrist, addictologist, secretary and social worker; support groups; information tools; links with associations; existence of a city hospital network that may modify the support care approach. The cirrhosis complication screening of the center was also sought.
For centers with a validated PE program between 2010 and 2014, this program was justified by the transmission of the authorization text by the ARS and at best by the description of the PE program submitted to the ARS. The transmitted program descriptive texts were qualitatively and independently analyzed by a physician and a pharmacist based on predetermined criteria. Both experts are referents for PE university educational program at
30
Grenoble University Hospital. The text description of ARS program had to be provided and both physician and pharmacist analysis had to match in order to consider PE program related to underlying viral hepatitis cirrhosis and not only viral hepatitis. These data allowed the CIRVIR patient distribution among the 3 groups of care management.
2.3. Statistical analyses
Statistical analyses were carried out with the help of the CIRVIR statistician.
The analysis of our study compared Group 1 patients to Group 2 patients, excluding Group 3 patients.
The comparison between Group 1 and Group 2 as for baseline characteristics and support methods was carried out by the Mann-Whitney test (continuous variables) and by the chi-square test or Fisher's exact test (qualitative variables).
Then the survival and Kaplan Meier event incidence curves were built for each of the judgment criteria and compared using the log-rank test, in univariate analysis.
Overall survival and hepatic events were also analyzed by Cox model adjusted with a propensity score, based on the main variable characteristics at inclusion.
The primary endpoint was the difference in survival. Other criteria were secondary: comparison of median follow-up, the incidence of hepatic events, sustained virological response, initial curative HCC management, overweight improvement, smoking cessation, alcohol withdrawal, drug withdrawal, mortality apart from liver causes (cardiovascular, non-HCC cancers or other causes) and abdominal ultrasound monitoring adherence.
31
The follow-up duration was the time between inclusion and death or study end. Hepatic events involved portal hypertension (PHT), related gastrointestinal bleeding, hepatic
encephalopathy or ascites. Adherence to ultrasound monitoring corresponded to the median time between each follow-up imaging. The virological response included a negative HBV DNA and a sustained negative HCV RNA at week 12 after HCV treatment. Patients with undetectable HCV-RNA and HBV-DNA at inclusion and HCV patients with missing end-of-treatment date and virological response were excluded. The initial curative HCC end-of-treatment was calculated based on the incidental HCC number. The overweight improvement was consistent with a BMI that had gone down less than 25 at the end of follow-up in patients with an initial BMI greater than or equal to 25. As for smoking cessation and drug withdrawal, they corresponded to a total cessation of consumption at the end of follow-up for patients with consumption at inclusion. Alcohol withdrawal corresponded to a consumption of alcohol less or equal to 10 grams per day for patients consuming more at inclusion. If there were missing comorbidities at six-monthly visit, these were considered to be identical to the patient's previous six-monthly visit.
Cardiovascular causes of death included neurological or cardiac ischemic attacks. Non-HCC cancers did not include cholangiocarcinoma. Other causes apart from liver causes included infections aside from ascites fluid infection.
Additional univariate and multivariate analyses of the factors influencing the initial curative HCC treatment have been performed by logistic regression model, adjusted on a propensity score.
The descriptive results were shown as median with extent [IQR] for the quantitative variables and in number and percentage (%) for the categorical data. The propensity score included all
32
characteristic variables with a p <0.20 obtained in univariate analysis. The results with a propensity score were shown with Hazard-Ratio (HR). A less than 0.05 P value would be considered as significant. Statistical analyses from the CIRVIR cohort were performed using the Stata 13 software and those from the support management analysis via the GraphPad Prism7 software.
3. Results
3.1. Flow chart
The CIRVIR cohort included 1,671 patients between 2006 and 2012 with HCV or HBV viral compensated cirrhosis in 35 healthcare centers in metropolitan France. 148 patients were excluded because one center refused to participate to this study. Of the 1064 patients from 19 centers including a PE program, 784 patients in 13 centers including a PE program which did not integrate educational activities around cirrhosis (Group 3) were also excluded. The program text analysis gathered from 16 centers with a PE program which integrated
educational activities around cirrhosis or not is shown in Appendix 1. The analysis involved 739 patients. Group 1 included 280 patients followed in 6 healthcare centers including a PE program which integrated educational activities around viral cirrhosis. Group 2 was
considered as control group, including 459 patients followed in 15 healthcare centers. These centers had just a care support nurse without any validated PE program or only benefited from a usual medical consultation (Flow Chart, Fig.1).
33 Figure 1 – Flow chart
3.2. Health care
The distribution of Hepato-gastroenterology wards or Internal Medicine wards of university hospital Center (UHC), non-university hospital center (HC) or private clinic (clinic) by group is described in Figure 2. Group 1 included 5 UHC services out of 6 centers and Group 2 included 10 UHC wards out of 15 centers. Excluded patients all came from UHC wards.
1,671 CIRVIR patients with compensated HCV or HBV cirrhosis in 35 healthcare
centers
Excluded patients: n=148
1 center who refused to participate in the study
739 patients with compensated HCV or HBV cirrhosis in 19 centers
All Child A with no history of hepatic events
459 patients in Group 2 : PE- 280 patients in Group 1:
PE + cirrhosis
Excluded patients: n=784
13 centers : Group 3 or PE+ without cirrhosis)
34 Figure 2 - Distribution by center type (a) in Group 1 and (b) in Group 2
35
Care and support methods by group are indicated in Table 1. Group 1 had significantly more facilities to access a pharmacist (100% versus 53.3%, p=0.04) and a social worker (83.3% versus 33.3%, p=0.04) than Group 2. Group 1 benefited more often from a consultation dedicated nurse (100% versus 66.7%, us) and had more frequent information on anti-viral treatments (100% versus 53.3%, p=0.04) than Group 2. In terms of communication, the information document use was identical in both groups. However, Group 1 had more local documents and tools (i.e. fascicles, playful materials) than Group 2 (83.3% versus 26.7%, p=0.02). Group 1 centers had more often support groups (83.3% versus 20%, p=0.01) than Group 2 centers. In Group 1 centers, there were more frequent support calls (66.7% versus 13, 3%, p=0.01), whereas in Group 2, centers used emails without using support calls. Ultrasound screening procedures varied widely among patients (Appendix A).
36 Table 1 – Health care characteristics in Group 1 and Group 2
Characteristics of health care All centers included p-value
Stakeholders pharmacist 14 6 100.0% 8 53.3% 0.04 nurse 16 6 100.0% 10 66.7% 0.11 dietitian 10 4 66.7% 6 40.0% 0.27 addictologist 16 5 83.3% 11 73.3% 0.63 psychologist 14 4 66.7% 10 66.7% >0.999 social worker 10 5 83.3% 5 33.3% 0.04
Action implemented (by nurse)
antiviral therapeutic information 14 6 100.0% 8 53.3% 0.04
medical consultation planning 11 4 66.7% 7 46.7% 0.83
ultrasound and endoscopy appointment planning 7 3 50.0% 4 26.7% 0.31
involvement in clinical trial 8 4 66.7% 4 26.7% 0.09
blood tests 12 5 83.3% 7 46.7% 0.13
Frequency of follow-up
at treatment initiation 2 2 33.3% 0 0.0% 0.02
during follow-up, non-systematic 8 3 50.0% 5 33.3% 0.48
during follow-up at each consultation 4 1 16.7% 3 20.0% 0.86
no follow-up 2 0 0.0% 2 13.3% 0.35
Communication/information tools
links with associations 10 4 66.7% 6 40.0% 0.27
support groups 8 5 83.3% 3 20.0% 0.01
documents 17 6 100.0% 11 73.3% 0.16
of laboratories 17 6 100.0% 11 73.3% 0.16
local tools 9 5 83.3% 4 26.7% 0.02
of laboratories and local tools 8 5 83.3% 3 20.0% 0.00
city hospital network 13 4 66.7% 9 60.0% 0.35
Means of communication
email 7 2 33.3% 5 33.3% 0.93
call support 6 4 66.7% 2 13.3% 0.01
mail and call support 2 2 33.3% 0 0.0% 0.02
37
3.3. Patients characteristics at baseline
The characteristics of the patients divided by group are shown in Table 2. Group 1 had a higher average age than control group (57 versus 54.5 years, p=0.019) and included 40% of patients ≥ 60 years compared with 34.6% in Group 2 (p=0.14). The population comprised 68.6% of men. Group 2 had significantly more African (21.4% versus 7.7%) and South East Asian patients (4.8% versus 2.9%) than Group 1 (p<0.001).
There was no difference in cirrhosis etiology in both groups: 587 HCV patients (79.4%), 134 HBV patients (18.1%), including 18 HCV-HBV (2.5%). Regarding HIV infection, there was 6.6% in Group 2 and 3.9% in Group 1 (p=0.13). Among HCV patients, Group 2 had significantly more genotype 2 and 3 and more treatment naïve patients (22.3 versus 15.7%, p=0.002 for the distribution of genotypes, 8.1 versus 3.2 %, p=0.008).
As for severity of cirrhosis, both patient groups were comparable in terms of portal hypertension and liver function.
The two groups were also comparable in diabetic, cardiovascular risk factors, dyslipidemia and overweight but not for high blood pressure (Group 1, n=92 (32.9%) versus Group 2, n=120 (26.1%), p=0.05). The overall population comprised 54.2% of overweight patients (BMI ≥ 25). 78 patients had a cardiovascular condition (10.6% of the population).
8 to 7.5% of patients had an alcohol consumption above 10 g/ day at baseline, 35% were current smokers and 23.3% were former smokers, less than 1% were unweaned drug addicts and 26.6% were former drug addicts (no significant difference between groups).
38 Table 2 – Patient characteristics
Characteristics at baseline Number of patients Study population n=739 Group 1 n=280 Group 2 n=459 P–value Age (years) 739 55.5 [48.7 – 64.6] 57.0 [49.7 – 66.9] 54.5 [48.2 – 63.2] 0.019 Age ≥ 60 years 739 271 (36.7) 112 (40.0) 159 (34.6) 0.14 Male sex 739 507 (68.6) 199 (71.1) 308 (67.1) 0.26 Cause of cirrhosis 739 0.61 VHC 587 (79.4) 226 (80.7) 361 (78.7) VHB 134 (18.1) 49 (17.5) 85 (18.5) VHC-VHB 18 (2.5) 5 (1.8) 13 (2.8) Karnofsky index 441 0.15* 0-40 0 0 0 50-70 8 (1.8) 6 (2.9) 2 (0.8) 80-100 433 (98.2) 198 (97.1) 235 (99.2)
Ethnic origin (evaluated by SNPs) 585 <0.001
EUR (equivalent Europe +Indo-Europe) 497 (85.0) 251 (92.3) 246 (78.6) AFR (equivalent Sub-Saharan Africa) 65 (11.1) 13 (4.8) 52 (16.6) EAS (equivalent South East Asia) 23 (3.9) 8 (2.9) 15 (4.8)
History of alcohol abuse 701 0.07
No 507 (72.3) 205 (76.2) 302 (69.9) Yes 194 (27.7) 64 (23.8) 130 (30.1)
Alcohol consumption at baseline (gram per day) 693 0.86 †
0 543 (78.4) 212 (80.3) 331 (77.2) <10 93 (13.4) 31 (11.7) 62 (14.4) 10 – 50 45 (6.5) 16 (6.1) 29 (6.8) 50 – 100 8 (1.1) 5 (1.9) 3 (0.7) >100 4 (0.6) 0 4 (0.9) Tobacco consumption 688 0.28 Never 287 (41.7) 112 (42.1) 175 (41.5) Ancient 160 (23.3) 69 (25.9) 91 (21.5) Current 241 (35.0) 85 (32.0) 156 (37.0) Substance addiction 719 0.21 Never 523 (72.7) 207 (75.5) 316 (71.0) Ancient 191 (26.6) 64 (23.4) 127 (28.5) Current 5 (0.7) 3 (1.1) 2 (0.5)
39
Characteristics at baseline Number of patients Study population n=739 Group 1 n=280 Group 2 n=459 P–value
BMI (kilogram per meter², kg/m²) 668 25.3 [22.8 – 28.4] 25.6 [23.0 – 28.9] 25.1 [22.7 – 28.1] 0.15
BMI (kg/m²) 668 0.25 <18 16 (2.4) 8 (3.1) 8 (1.9) [18 ; 25[ 290 (43.4) 101 (39.5) 189 (45.9) [25 ; 30[ 251 (37.6) 98 (38.3) 153 (37.1) ≥30 111 (16.6) 49 (19.1) 62 (15.1) Diabetes 739 127 (17.2) 42 (15.0) 85 (18.5) 0.22 Dyslipidemia 739 37 (5.0) 15 (5.4) 22 (4.8) 0.73
High blood pressure 739 212 (28.7) 92 (32.9) 120 (26.1) 0.050
Oesophageal varices 528
0.16 No 398 (75.4) 175 (78.5) 223 (73.1)
Yes 130 (24.6) 48 (21.5) 82 (26.9)
Oesophageal varices (OV) 528 0.43
No OV 398 (75.4) 175 (78.5) 223 (73.1) OV grade I 90 (17.0) 31 (13.9) 59 (19.3) OV grade II 35 (6.6) 15 (6.7) 20 (6.6) OV grade III 5 (1.0) 2 (0.9) 3 (1.0)
Portal hypertension gastropathy 528 0.83
No 419 (79.4) 176 (78.9) 243 (79.7) Yes 109 (20.6) 47 (21.1) 62 (20.3)
Creatinine (µmol/L) 732 72.0 [62.0 - 84.0] 75.0 [66.0 – 85.7] 70.7 [61.9 - 83.0] 0.004 Glomerular filtration rate (MDRD formula) 732 94.6 [79.7 – 112.0] 92.9 [77.6 – 108.9] 96.2 [81.4 – 114.4] 0.010
Albumin (g/L) 734 0.63
≤28 2 (0.3) 0 2 (0.4)
]28-35] 73 (19.9) 26 (9.3) 47 (10.3) >35 659 (89.8) 253 (90.7) 406 (89.2)
Total bilirubin (µmol/L) 738 0.41
<35 722 (97.8) 276 (98.6) 446 (97.4) [35-50[ 13 (1.8) 4 (1.4) 9 (2.0)
40
Characteristics at baseline Number of patients Study population n=739 Group 1 n=280 Group 2 n=459 P–value Platelets (103/mm3) 728 0.71 ≤75 76 (10.4) 26 (9.4) 50 (11.1) ]75-150[ 310 (42.6) 117 (42.2) 193 (42.8) ≥150 342 (47.0) 134 (48.4) 208 (46.1) Prothrombin (%) 713 89.0 [80.0 - 98.0] 88.0 [79.0 - 96.0] 91.0 [80.0 – 100.0] 0.006 Prothrombin (%) 713 0.68 ≤50 6 (0.8) 3 (1.1) 3 (0.7) >50 707 (99.2) 268 (98.9) 439 (99.3)
AST (International Unity per litre, IU/L) 739 49.0 [31.0 - 81.0] 49.0 [31.0 – 83.5] 50.0 [31.0 - 80.0] 0.96
ALT (IU/L) 739 52.0 [30.0 - 91.0] 50.0 [32.0 – 95.0] 52.0 [28.0 – 90.0] 0.58 GGT (IU/L) 738 73.0 [37.0 – 136.0] 75.0 [37.0 – 149.0] 69.0 [36.0 – 130.0] 0.36 VHC genotype 558/605 0.002 1 395 (70.8) 173 (79.7) 222 (65.1) 2 22 (3.9) 6 (2.8) 16 (4.7) 3 88 (15.8) 28 (12.9) 60 (17.6) 4 44 (7.9) 8 (3.7) 36 (10.6) 5 / 6 9 (1.6) 2 (0.9) 7 (2.0) Anti-HBc antibody in HVC 580/587 0.013 Negative 375 (64.7) 160 (70.8) 215 (60.7) Positive 205 (35.3) 66 (29.2) 139 (39.3)
HCV viral load (in HCV and HCV-HBV) 604/605 0.53
Negative 200 (33.1) 80 (34.6) 120 (32.2) Positive 404 (66.9) 151 (65.4) 253 (67.8)
Sustained virologic response (in HCV and HCV-HBV)
604/605 0.98
No 473 (78.3) 181 (78.4) 292 (78.3) Yes 131 (21.7) 50 (21.7) 81 (21.7)
HCV viral load (in HCV) 586/587 0.57
Negative 189 (32.3) 76 (33.6) 113 (31.4) Positive 397 (67.7) 150 (66.4) 247 (68.6)
41
Characteristics at baseline Number of patients Study population n=739 Group 1 n=280 Group 2 n=459 P–value
Sustained virologic response (in HCV) 586/587 0.99
No 464 (79.2) 179 (79.2) 285 (79.2) Yes 122 (20.8) 47 (20.8) 75 (20.8) HBV genotype 32/152 0.43 A 13 (40.6) 6 (50.0) 7 (35.0) B 2 (6.3) 2 (16.7) 0 C 3 (9.4) 1 (8.3) 2 (10.0) D 9 (28.1) 2 (16.7) 7 (35.0) E 4 (12.5) 1 (8.3) 3 (15.0) F 0 0 0 G 1 (3.1) 0 1 (5.0)
HBV viral load (in HVB and HCV-HBV) 152/152 0.74
Negative 113 (74.3) 41 (75.9) 72 (73.5) Positive 39 (25.7) 13 (24.1) 26 (26.5)
HBV viral load (in HBV) 134/134 0.86
Negative 100 (74.6) 37 (75.5) 63 (74.1) Positive 34 (25.4) 12 (24.5) 22 (25.9)
Previous or current antiviral therapy 736 0.008
No 46 (6.3) 9 (3.2) 37 (8.1)
Yes 690 (93.7) 271 (96.8) 419 (91.9)
HIV co-infection 734 0.13
No 693 (94.4) 269 (96.1) 424 (93.4) Yes 41 (5.6) 11 (3.9) 30 (6.6)
History of extra-hepatic cancer 739 47 (6.4) 20 (7.1) 27 (5.9) 0.50
History of cardiovascular event 739 78 (10.6) 34 (12.1) 44 (9.6) 0.27 † P-value computed by the following clustering of categories of the variable Alcohol Consumption : 1 - “0” or “<10; 2 - “10-50; 3 = “> 5
42
3.4. Relationships between overall survival, specific survival and care
environment
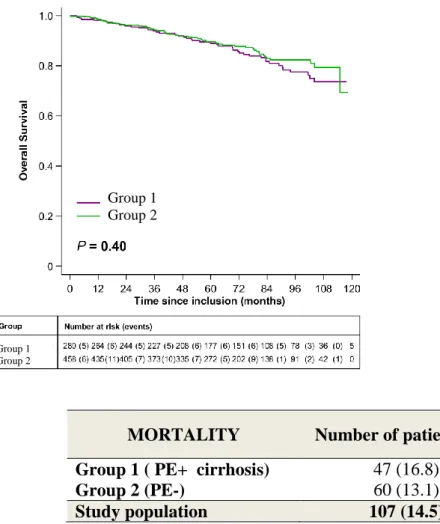
Regarding overall survival, there was no significant difference between the 2 groups, respectively 93.9% at 3 years and 85.7%, at 6 years of follow-up for Group 1 and 94.4% at 3 years and 87.8%, at 6 years of follow-up for Group 2 (p=0.40, Figure 3).
Figure 3 - All-cause mortality (number, survival)
MORTALITY Number of patients (%)
Group 1 ( PE+ cirrhosis) 47 (16.8)
Group 2 (PE-) 60 (13.1)
Study population 107 (14.5)
Death causes are indicated in Table 3. Mortality due to infection was observed in 13 patients in Group 1 and 16 patients in Group 2 to 6 years of follow-up (4.8% versus 3.5%, p=0.65).
Group 1 Group 2
Group 1 Group 2
43
Mortality from cardiovascular events affected 1 patient in each group at 6 years of follow-up (p=0.73 for survival without cardiovascular mortality). Similarly, mortality from non-HCC cancers was observed in 3 patients in Group 1 and 6 patients in Group 2 at 6 years of follow-up (p=0.66).
Table 3 - Details of death causes
3.5. Median follow-up in each group
Median follow-up of the total population studied was 69.5 months [IQR: 46.1 - 93.7] and 72.8 months [IQR: 50.4 - 96.5] for survivors at the end of the cohort. Median follow-up was
significantly longer in Group 1 than in Group 2:75.5 months [IQR: 47.5-98.7] versus 67.3
Death causes Study population n=107 Group 1 (PE+ cirrhosis) n=47 Group 2 (PE-) n=60 Hepatic failure 13 (13.7) 5 (12.5) 8 (14.6) Renal failure 1 (1.0) 0 1 (1.8)
Ascitic fluid infection 0 0 0
Gastrointestinal bleeding 10 (10.5) 5 (12.5) 5 (9.1)
HCC 23 (24.2) 10 (25.0) 13 (23.6)
Severe infection without ascites 11 (11.6) 6 (15.0) 5 (9.1)
Extra-hepatic cancer 9 (9.5) 3 (7.5) 6 (10.9)
Cardiovascular event 2 (2.1) 1 (2.5) 1 (1.8)
Other extra-hepatic event 18 (18.9) 7 (17.5) 11 (20.0)
Cholangiocarcinoma 3 (3.2) 1 (2.5) 2 (3.6)
Hepatic event / Alcoholic hepatitis 5 (5.3) 2 (5.0) 3 (5.5)
44
months [IQR: 45.2 - 89.8], p = 0.026) as well as in survivors at the end of the cohort (78.7 months [IQR: 51.7 - 101.0] versus 69.4 months [IQR: 49.7 - 92.3], p = 0.014).
3.6. Relationship between a sustained virological response and care
environment
There was no sustained virological response difference to anti-viral treatment between Group 1 and Group 2 among the 542 patients with DNA HBV or RNA HCV positive at baseline (28.1% versus 30.7% at 3 years, 52% versus 58% at 6 years, p = 0.83).
3.7. Relationships between co-morbidities and care environment
There was no significant difference between the two groups in incidence of alcohol
withdrawal, smoking cessation and overweight treatment. Those data was hardly exploitable due to many missing data and the small numbers of studied people especially for alcohol addiction.
Out of the 5 active drug addicts (3 in Group 1 and 2 in Group 2), 4 to 5 patients (80.0%, 2 from each group) stopped their consumption at the first follow-up visit (approximately 6 months after inclusion in the study). Therefore, no weaning incidence curve for drug addiction was performed.
45
3.8. Relationships between hepatic events and care environment
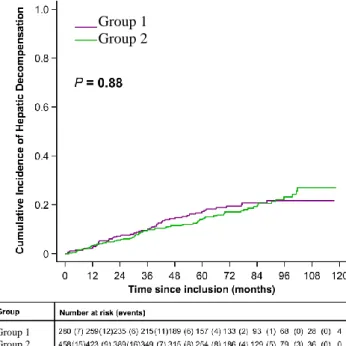
There was no difference in hepatic decompensation incidence between Group 1 and Group 2 (9.6% at 3 years and 19.5% at 6 years versus 9.5% at 3 years and 17.1% at 6 years; p=0.88, Fig.4). Group 1 had 17 patients with hepatic encephalopathy, 12 with PHT- related
gastrointestinal bleeding and 36 with ascites. Group 2 had 22 patients with hepatic
encephalopathy, 15 with PHT- related gastrointestinal bleeding and 59 with ascites (Table 4). Moreover, the incidence of ascetic fluid infection was very low without any difference
between none of the groups (1.3% at 6 years for the 2 groups, p=0.69) (Fig.4).
Figure 4 - Incidence of hepatic events (ascites or digestive bleeding by portal
hypertension or hepatic encephalopathy)
HEPATIC EVENTS Number of patients (%)
Group 1 (PE+ cirrhosis) 49 (17.5)
Group 2 (PE-) 76 (16.6) Study population 125 (16.9) Group 1 Group 2 Group 1 Group 2
46 Table 4 – Detailed incidence of hepatic events
3.9. Relationships between imaging delay and care environment
Abdominal ultrasound (US) monitoring median time was 6.3 months [IQR: 6.0 - 8.0] in Group 1, 6.5 months [IQR: 6.0 - 8.2] in Group 2 (p = 0.032) for a total of 6.4 months [IQR: 6.0 - 8.2] in total population.
3.10. Relationships between initial curative treatment of hepatocellular
carcinoma, ultrasound monitoring and care environment
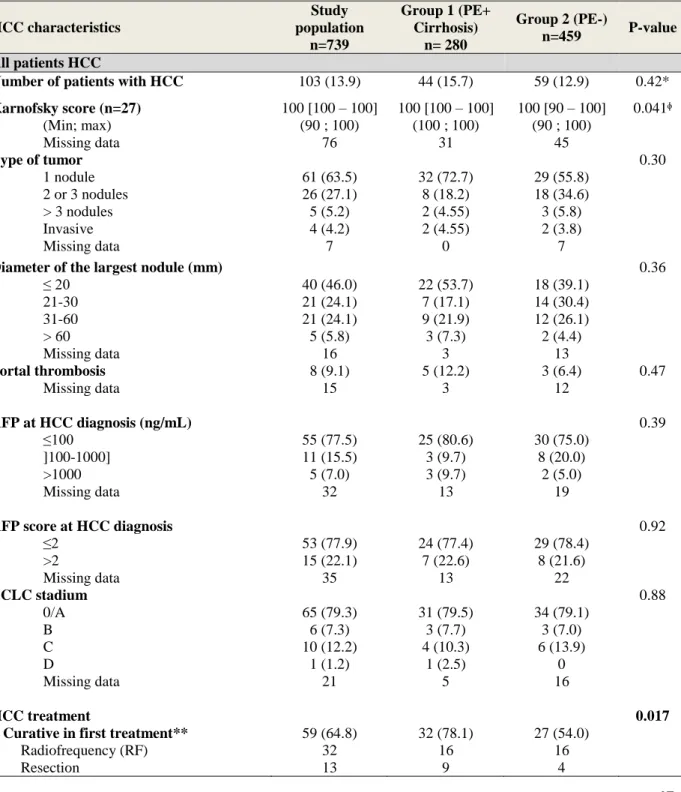
As for hepatocellular carcinoma (HCC) care, the incidence of initial curative treatment was significantly greater in Group 1 than in Group 2 (n = 32, 78.1% of HCCs versus n = 27, 54% of HCCs, p = 0.017) whereas the incidence of HCC was similar in both groups (8.6% at 3 years and 15.7% at 6 years follow-up for Group 1 versus 7.7% at 3 years and 13.7% at 6 years follow-up for Group 2, p = 0.42, Table 5). With no significant difference, initial characteristics of HCCs in Group 1 were more commonly associated with one single nodule (n = 32, 72.7% versus n = 29, 55.8%, p = 0.30), with a diameter less than or equal to 20 mm (n = 22, 53.7% versus n = 18, 39.1%, p = 0.36) and with an AFP rate less than or equal to 100 ng / ml (n= 25, 80.6% versus n=30, 75.0%, p = 0.39, Table 5). There were 16
47
radiofrequencies in each group, 9 liver resections and 3 liver transplantations (LT) in Group 1; 4 liver resections and 4 LT in Group 2.
Table 5 – HCC characteristics description (overall and according to support
management (all HCC patients)
HCC characteristics Study population n=739 Group 1 (PE+ Cirrhosis) n= 280 Group 2 (PE-) n=459 P-value All patients HCC
Number of patients with HCC 103 (13.9) 44 (15.7) 59 (12.9) 0.42*
Karnofsky score (n=27) 100 [100 – 100] 100 [100 – 100] 100 [90 – 100] 0.041ᶲ (Min; max) (90 ; 100) (100 ; 100) (90 ; 100) Missing data 76 31 45 Type of tumor 0.30 1 nodule 61 (63.5) 32 (72.7) 29 (55.8) 2 or 3 nodules 26 (27.1) 8 (18.2) 18 (34.6) > 3 nodules 5 (5.2) 2 (4.55) 3 (5.8) Invasive 4 (4.2) 2 (4.55) 2 (3.8) Missing data 7 0 7
Diameter of the largest nodule (mm) 0.36
≤ 20 40 (46.0) 22 (53.7) 18 (39.1) 21-30 21 (24.1) 7 (17.1) 14 (30.4) 31-60 21 (24.1) 9 (21.9) 12 (26.1) > 60 5 (5.8) 3 (7.3) 2 (4.4) Missing data 16 3 13 Portal thrombosis 8 (9.1) 5 (12.2) 3 (6.4) 0.47 Missing data 15 3 12 AFP at HCC diagnosis (ng/mL) 0.39 ≤100 55 (77.5) 25 (80.6) 30 (75.0) ]100-1000] 11 (15.5) 3 (9.7) 8 (20.0) >1000 5 (7.0) 3 (9.7) 2 (5.0) Missing data 32 13 19
AFP score at HCC diagnosis 0.92
≤2 53 (77.9) 24 (77.4) 29 (78.4) >2 15 (22.1) 7 (22.6) 8 (21.6) Missing data 35 13 22 BCLC stadium 0.88 0/A 65 (79.3) 31 (79.5) 34 (79.1) B 6 (7.3) 3 (7.7) 3 (7.0) C 10 (12.2) 4 (10.3) 6 (13.9) D 1 (1.2) 1 (2.5) 0 Missing data 21 5 16 HCC treatment 0.017
- Curative in first treatment** 59 (64.8) 32 (78.1) 27 (54.0) Radiofrequency (RF) 32 16 16
48 HCC characteristics Study population n=739 Group 1 (PE+ Cirrhosis) n= 280 Group 2 (PE-) n=459 P-value All patients HCC
LT without Chimio.Embol. before 3 1 2 LT with Chimio.Embol. before 4 2 2 Other (microwave, cyberknife) 4 3 1 RF + Alcoholisation (concurrent) 1 1 0 RF + Resection (concurrent) 2 0 2 - Palliative in first treatment 32 (35.2) 9 (21.9) 23 (46.0)
Comfort treatment 8 3 5
Chimioembolization(Chimio.Embol.) 16 4 12 Chimio.E.+Alcoholisation(concurrent) 1 0 1
Sorafenib 2 0 2
Other palliative treatment 3 1 2
No treatment 2 1 1
- Missing data 12 3 9
Delay between HCC diagnosis and treatment start (month)
1.6 [0.8 – 3.4] 1.7 [1.2 – 4.0] 1.5 [0.6 – 2.9] 0.21
Delay between HCC diagnosis imaging
dateand previous one (month) 6.3 [5.4 – 9.2] 6.4 [5.8 – 8.5] 6.3 [5.3 – 11.3] 0.79
Ratio : Nb imaging performed/theoretical nb between inclusion and HCC diagnosis (%) 100 [75.0 – 100] 100 [73.2 – 100] 100 [75.0 – 100] 0.84 * Log-rank test
** Including Cyberknife, electroporation, microwave; unspecified radiotherapy was classified as palliative treatment.
ᶲ not interpretable because there is a lot of missing data
3.8. Analysis to compare overall survival and hepatic decompensation with
environment care adjusted with a propensity score
As shown in Table 6, there were also no significate difference between Group 1 and Group 2 to overall survival (p = 0.63) and to hepatic events (p = 0.77) with adjust by propensity score.
49 Table 6 – Overall survival and hepatics events adjusted with a propensity score
Not adjusted Adjusted with a propensity
score
Hepatic events HR [95% CI] P-value HR [95% CI] P-value
Patient education
Group 2 (PE-) Ref Ref
Group 1 (PE+ cirrhosis) 0.97 [0.68 ; 1.39] 0.88 0.92 [0.53 ; 1.61] 0.77
All causes of death HR [95% CI] P-value HR [95% CI] P-value
Patient education
Group 2 (PE-) Ref Ref
Group 1 (PE+ cirrhosis) 0.85 [0.58 ; 1.25] 0.40 0.85 [0.45 ; 1.63] 0.63
3.11. Additional analyses of factors influencing the initial HCC treatment
In view of favourable results for univariate analysis of initial curative HCC treatment in Group 1 compared to Group 2, we performed additional analyses. In univariate analysis and then in multivariate analysis adjusted with a propensity score, the factors influencing
significantly the initial curative HCC treatment were presence of PE offering (or belonging to Group 1) with HR= 5.34[1.30; 21.93] (p=0.020), imaging delay less than 7 months with HR=5.07 [1.35; 19.06] (p=0.016) and no history of liver decompensation with
HR=19.74[2.49; 156.31] (p=0.005). These results are shown in Appendix C.
Patients developing a HCC in Group 1 had a significantly higher likelihood of having an initial curative HCC treatment than patients developing a HCC in Group 2 in univariate and multivariate analysis adjusted with a propensity score.
50
4. Discussion
To analyze the health care system impact for patients with viral cirrhosis B and C on management of cirrhosis and its complications, the CIRVIR cohort was an opportunity. In Fact, this cohort allowed an accurate description of liver disease progression and hepatic events of patients with initially compensated viral cirrhosis B and C in metropolitan France since 2008 up to 2012 : 50% mortality rate by liver decompensation and HCC occurrence between 2.5 and 3.5% per year and infection rate [59] were similar to that found in the current epidemiological studies [57].
Up to now, benefit of PE has been demonstrated in health care of chronic viral hepatitis C treatment by literature[38] data, allowing a better sustained virological response in case of educational support (OR = 2.5, Larrey and al. 2012). This lack of difference in our study between patients included in group1 and others can be explained by 3 factors: firstly significantly more genotype 2 and 3 HCV and treatment naïve patients in the group without any PE environment, items promoting the RVS (OR = 2.9 and OR = 2.3 respectively, Larrey 2012), secondly RVS over 80% for hepatitis C since the end of 2013 and elaboration of educational program that did not suit exactly with educational problematic evolution with the arrival new direct antiviral agent in HCV [60]–[64] and thirdly the absence of knowledge at an individual level of patients implication in educational program available in their centers. Our retrospective analytical study did not link presence or not of care environment including PE program with overall survival of patients with viral cirrhosis B and C. Despite a significantly more important median follow-up in the group with care environment including PE program (75.5 months [IQR: 47.5 - 98.7] versus 67.3 months [IQR: 45.2 - 89.8]; p=0.026), this result was also negative adjusted with a propensity score (p=0.63). Total mortality was a