HAL Id: hal-00829235
https://hal-polytechnique.archives-ouvertes.fr/hal-00829235
Submitted on 5 May 2014
HAL is a multi-disciplinary open access
archive for the deposit and dissemination of
sci-entific research documents, whether they are
pub-lished or not. The documents may come from
teaching and research institutions in France or
abroad, or from public or private research centers.
L’archive ouverte pluridisciplinaire HAL, est
destinée au dépôt et à la diffusion de documents
scientifiques de niveau recherche, publiés ou non,
émanant des établissements d’enseignement et de
recherche français ou étrangers, des laboratoires
publics ou privés.
Mid-infrared electric field characterization using a
visible charge-coupled-device-based spectrometer
Kevin Kubarych, Manuel Joffre, Amy Moore, Nadia Belabas, David Jonas
To cite this version:
Kevin Kubarych, Manuel Joffre, Amy Moore, Nadia Belabas, David Jonas. Mid-infrared electric field
characterization using a visible charge-coupled-device-based spectrometer. Optics Letters, Optical
Society of America - OSA Publishing, 2005, 30 (10), pp.1228-1230. �10.1364/OL.30.001228�.
�hal-00829235�
Mid-infrared electric field characterization using a
visible charge-coupled-device-based
spectrometer
Kevin J. Kubarych and Manuel Joffre
Laboratoire d’Optique et Biosciences, Centre National de la Recherche Scientifique, Unite Mixte de Recherche 7645, INSERM U 451, Ecole Polytechnique, Ecole Nationale Supérieure de Techniques Avanćees,
91128 Palaiseau, France
Amy Moore, Nadia Belabas, and David M. Jonas
Department of Chemistry and Biochemistry, University of Colorado at Boulder, Boulder, Colorado 80309-0215
Received November 15, 2004
We characterize ultrashort mid-infrared pulses through upconversion by using the stretched pulses obtained from the uncompressed output of a chirped-pulse amplifier. The power spectrum thus translated into the visible region can be readily measured with a standard silicon CCD camera-based spectrometer. The spec-tral phase is also characterized by a variant of zero-added-phase specspec-tral phase interferometry for direct electric field reconstruction. This is a general method that provides a multiplex advantage over conventional infrared detector array-based methods. © 2005 Optical Society of America
OCIS codes: 320.7100, 120.5050, 120.6200.
The IR spectral region is rich in chemical information relating directly to molecular structure and dynamics and benefits from being free of the complications of excited electronic state dynamics. Progress in ul-trafast IR spectroscopy has recently begun a rapid acceleration largely because of the conceptual break-through of adopting two-dimensional (2D) techniques analogous to those used in nuclear magnetic reso-nance spectroscopy. Central to these techniques is the measurement of the field of the generated nonlin-ear optical signal. Although 2D spectroscopy can be readily implemented in the visible spectral range with high-resolution silicon CCD cameras,1–4 most advances in 2D IR spectroscopy have relied either on time-consuming scanning in either the frequency5or time domains6,7or on expensive HgCdTe detector ar-rays of ,64 pixels.8,9Although progress may be ex-pected in IR detector arrays, their multiplex advan-tage is limited by the IR diffraction limit.
In this Letter we report a novel approach to IR spectroscopy based on upconverting a mid-IR pulse with the uncompressed output of a Ti:sapphire chirped-pulse amplifier (CPA), effectively translating the IR spectrum into the visible. We note that the up-conversion approach for detecting mid-IR spectra with a CCD camera has been reported previously,10 although it was based on the use of a narrowband visible pulse obtained by frequency doubling a pico-second mode-locked Nd:YAG laser. Highly stretched 800- nm pulses are readily available from most Ti:sapphire CPA systems. Further, it is straightfor-ward to determine the spectral phase as well as the spectral amplitude with a simple extension of this frequency conversion: By upconverting the IR test pulse with two time-delay replicas of the 800-nm stretched pulse in a noncollinear geometry, two sheared pulses are generated in the visible s,700 nmd. Since this approach requires only one
test pulse, it is possible to measure the pulse in situ, and thus it has been previously denoted zero-additional-phase (ZAP) spectral phase interferometry for direct electric field reconstruction (SPIDER).11,12 It has been demonstrated to be a powerful variant of the SPIDER technique13 for the measurement of near-IR11 or UV pulses.12 It is particularly notewor-thy that the results presented in this Letter used only ,5mJ of energy in each 800- nm chirped pulse, derived from the zero-order diffraction from the com-pressor grating in a CPA system, thus yielding sub-stantial linear chirp with no additional stretcher from a beam that is typically unused.
Figure 1 shows the experimental diagram for our apparatus. The distinguishing feature of ZAP SPIDER is that there is only a single test pulse and two replicas of the stretched pulse. In this case, the shear, V, is determined by the time delay between the two stretched pulses, denotedtV. To introduce a
Fig. 1. Upconversion and ZAP SPIDER apparatus. Two chirped 800- nm pulses (5 mJ each, 150 ps) are derived from the zero-order diffraction of the CPA compressor and mixed noncollinearly with the 1 - mJ mid-IR pulses in a 425- mm MgO : LiNbO3 crystal. The signals are imaged on
the slit (set at 8 mm) of a grating spectrometer (GS). Inset, upconversion beam geometry of mid-IR (white) and stretched (black) pulses.
1228 OPTICS LETTERS / Vol. 30, No. 10 / May 15, 2005
time delay, t, between the two upconverted visible pulses, it is necessary to separate them spatially by using a slightly noncollinear beam geometry (inset of Fig. 1). The two sheared pulses are then imaged non-collinearly onto the entrance slit s8mmd of a mono-chromator. Selecting only the central fringe of the re-sulting spatial interference pattern (25-mm period) provides the spectral interference necessary for a SPIDER measurement. The spectrum was dispersed by the first order of a 600- groove/ mm grating in a 0.46- m spectrometer (SPEX HR 460) and was re-corded with a 25.4- mm-wide 13403 100 pixel silicon CCD camera with 16- bit, 2 - MHz analog-to-digital conversion (Roper Scientific Evry, France).
The mid-IR pulses were created with a b-barium borate, white-light-seeded optical parametric ampli-fier generating signal and idler beams that were sub-sequently difference frequency mixed in a 1 - mm GaSe crystal, resulting in 1 -mJ, 5.1-mm pulses. The 1 / e2beam diameter of the mid-IR pulses was 1.5 mm
at the 425-mm-thick MgO : LiNbO3(5% MgO,u= 46°, type I) crystal. The ,150- ps stretched pulses were obtained from the zero-order diffraction in the com-pressor of our 1 - kHz Ti:sapphire regenerative ampli-fier (Spectra-Physics Hurricane). In contrast to pre-vious implementations of ZAP SPIDER—where the dispersion of a small amount of glass was used to stretch the pulses to only 2 ps11,12—the upconverted signal experiences negligible spectral broadening s,0.3 cm−1d. A telescope (not shown) adapts the
di-ameter of the stretched pulse to roughly 2 mm, and a long-focal-length lens loosely focuses the two beams roughly 20 cm downstream of the upconversion crys-tal. With 5mJ in each stretched pulse the upconver-sion signal was visible to the eye.
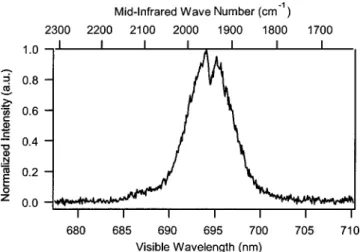
To determine the unknown spectral phase of the mid-IR pulse, the contribution of the delay between the two frequency-shifted pulses, vt, must be sub-tracted from the phase difference.13This subtraction can be done by measuring a background spectral in-terferogram in the absence of any spectral shear, that is, withtV= 0, and thus V = 0. By adjusting the time delay, tV, in the stretched pulse interferometer so that the two upconverted spectra are identical, the phase determined from this background interfero-gram is given only by time delay t and can be sub-tracted from subsequent SPIDER phase measure-ments (with V Þ 0). Since any change in tV does not affect delayt, one is free to choose any spectral shear after having recorded the background interferogram. One difficulty of ZAP SPIDER with a highly chirped mixing pulse is the determination of the ab-solute frequency of the mid-IR pulse. Knowledge of the upconverted signal frequency does not uniquely determine the IR frequency unless one has precise knowledge of which frequency from the chirped pulse coincided with the IR pulse. The most accurate deter-mination is a reference-free method using time-domain interferometry (i.e., Fourier transform spec-troscopy). For this Letter, however, we have determined the absolute mid-IR frequency by using a vibrational transition, that of carbon monoxide bound within the protein hemoglobin (HbCO), since
this transition is very narrow s,12 cm−1dand its
fre-quency is well known to be 1951 cm−1.14 Figure 2
shows the upconverted spectrum after transmission of the mid-IR pulse through a 5 - mM sample of HbCO (optical density 0.18 at 1951 cm−1).14 The sample
path length was 50mm with 2 - mm-thick CaF2 win-dows. The upper horizontal scale shows the fre-quency in wave numbers obtained by converting from the wavelength and subtracting a constant offset such that the CO vibration was centered at 1951 cm−1. All the spectra shown here were obtained
with an exposure time of 1 ms and a total readout time for our laser-synchronized CCD system of 1.5 ms. Although these measurements are not rigor-ously single shot, the measured signal levels indicate that single-shot operation is possible with faster de-tection.
The ZAP SPIDER trace of an unshaped mid-IR pulse is shown in Fig. 3(a). From the interferogram of the unsheared pulse (not shown), the delay between the two chirped pulses was determined to be 2.8 ps. The shear was set to be 1 THz. The observed fringe contrast of 0.6 results from a combination of imper-fect alignment of the interferometer and finite slit width. The recovered amplitude and phase are shown in Fig. 3(b). As expected,15 the output of the difference-frequency generation is largely transform limited. The mid-IR pulses were shaped by using ei-ther a 6.3- cm block of CaF2or a 6 - mm plate of Ge—
two oppositely dispersive materials. Figure 4 shows the recovered phase and amplitude of the shaped pulses traversing the different transparent media with the unshaped phase of Fig. 3 subtracted, yield-ing the phase introduced by the material. Compari-son with the calculated phase shows excellent agreement.16As a measure of the very high spectral resolution, only one quarter of the phase points are shown in Figs. 3 and 4. There were typically 200 well-determined phase points in a spectrum with a pixel-size-limited mid-IR spectral resolution of 1.4 cm−1 (Dl = 0.07 nm at 693 nm). This resolution
compares favorably with that achievable with HgCdTe detector arrays. Moreover, since the camera
Fig. 2. Spectrum of mid-IR pulses after transmission through 5 mM of a solution of HbCO in a D2O buffer
so-lution. The frequency axis was shifted to the center of the peak of the absorption feature at 1951 cm−1.
used here has 100 rows of pixels, it is straightforward to measure simultaneously an upconverted mid-IR reference spectrum to record time-resolved, pump– probe differential absorption spectra. Alternatively, the multiplex advantage gained by upconversion can be used to extend the range of array-detected mid-IR spectra.
One of the distinct advantages of the present up-conversion approach is that it can be fully integrated with interference-detected 2D IR spectroscopy based on spectral interferometry.1–7,9 The nonlinear signal and a phase-locked external local oscillator are col-linearly upconverted with a single chirped 800- nm pulse, yielding a spectral interferogram. Blocking the signal beam and unblocking the second chirped pulse allows the local oscillator to be fully characterized by ZAP SPIDER. Such an implementation also permits the time-domain interferometry required for absolute frequency determination.
Multiplex limitations to the widespread adoption of 2D vibrational spectroscopy have been addressed by implementing an upconversion method for shifting mid-IR pulses into the visible. Moreover, their ampli-tude and phase have been measured by an in situ technique that requires only the typically unused zero-order compressor output. The wide transmission bandwidth of MgO : LiNbO3allows efficient detection of all fundamental vibrational frequencies above 1820 cm−1 sl , 5.5mmd, whereas lower frequencies
can be measured using other crystals (e.g., AgGaS2). Finally, upconversion can be seamlessly integrated into a spectral-interferometry-based implementation of 2D IR spectroscopy with the added capability of
in situ ZAP SPIDER characterization of the local
os-cillator electric field.
This work was partially supported by the U.S. Air Force Office of Scientific Research Multidisciplinary University Research Initiative (grant F49620-02-1-0381) and the Human Frontier Science Program. K. Kubarych’s e-mail address is kevin.kubarych @polytechnique.fr.
References
1. L. Lepetit and M. Joffre, Opt. Lett. 21, 564 (1996). 2. J. D. Hybl, A. A. Ferro, and D. M. Jonas, J. Chem.
Phys. 115, 6606 (2001).
3. M. L. Cowan, J. P. Ogilvie, and R. J. D. Miller, Chem. Phys. Lett. 386, 184 (2004).
4. T. Brixner, T. Mancal, I. V. Stiopkin, and G. R. Fleming, J. Chem. Phys. 121, 4221 (2004).
5. O. Golonzka, M. Khalil, N. Demirdoven, and A. Tokmakoff, Phys. Rev. Lett. 86, 2154 (2001).
6. M. T. Zanni, M. C. Asplund, and R. M. Hochstrasser, J. Chem. Phys. 114, 4579 (2001).
7. N. Belabas and M. Joffre, Opt. Lett. 27, 2043 (2002). 8. P. Hamm, M. Lim, W. F. DeGrado, and R. M.
Hochstrasser, J. Chem. Phys. 112, 1907 (2000). 9. M. Khalil, N. Demirdoven, and A. Tokmakoff, Phys.
Rev. Lett. 90, 047401 (2003).
10. E. J. Heilweil, Opt. Lett. 14, 551 (1989).
11. P. Baum, S. Lochbrunner, and E. Riedle, Opt. Lett. 29, 210 (2004).
12. P. Baum, S. Lochbrunner, and E. Riedle, Opt. Lett. 29, 1686 (2004).
13. C. Iaconis and I. A. Walmsley, Opt. Lett. 23, 792 (1998).
14. A. C. Dong and W. S. Caughey, Methods Enzymol. 232, 139 (1994).
15. C. Ventalon, J. M. Fraser, and M. Joffre, Opt. Lett. 28, 1826 (2003).
16. P. I. Klocek, Handbook of Infrared Optical Materials (Marcel Dekker, New York, 1991).
Fig. 4. ZAP SPIDER retrieved phase after transmission through 6.3 cm of CaF2(squares) and 6 mm of Ge (circles)
with the calculated phase shown for comparison (solid curves). Normalized amplitude shown for reference (dashed curve). The phase of the unshaped pulse (Fig. 3) has been subtracted from the measured results.
Fig. 3. ZAP SPIDER measurement of the mid-IR pulse. (a) Normalized interferogram and (b) retrieved phase (circles) and normalized amplitude (solid curve).