Caractérisation d’un gène de résistance contre la tordeuse des
bourgeons de l’épinette (Choristoneura fumiferana) chez
l’épinette blanche (Picea glauca (Voss.) Moench).
Mémoire
Gaby Germanos
Maîtrise en sciences forestières
Maître ès sciences (M.Sc.)
Québec, Canada
iii
Résumé
Lors d’une épidémie localisée de tordeuse des bourgeons de l’épinette (Choristoneura fumiferana), certaines épinettes blanches (Picea glauca (Voss.) Moench) furent épargnés. L’expression d’un gène, Pgβglu-1, codant pour une enzyme de type bêta-glucosidase est liée à la production d’acétophénones s’accumulant dans les aiguilles des arbres peu défoliés. La variation de l’expression de Pgβglu-1 semble relèver d’une régulation inhérente et unique aux arbres résistants.
Nos résultats permettent d’établir une corrélation entre l’expression du gène, l’accumulation des acétophénones actives et le stade le plus destructif de l’insecte. Ils montrent aussi que le niveau d’expression de Pgβglu-1 est transmis entre les générations d’arbres et peut être induit. Les séquences d’ADN codants du gène ont été obtenues, mais aucune différence n’a été observée permettant de différencier les résistants des non-résistants.
Une connaissance plus approfondie du phénomène pourrait aider au développement d’une lutte intégrée visant à mitiger les dégâts causés par la tordeuse en période d’épidémie.
v
Abstract
A localized spruce budworm (Choristoneura fumiferana) outbreak that took place in a white spruce plantation (Picea glauca (Voss.) Moench) left some trees almost untouched while many others had severe defoliation. Expression of agene coding for a beta-glucosidase enzyme was identified (Pgβglu-1) and was linked to the accumulation of two acetophenones in the foliage of resistant trees. We propose that the expression variation of
Pgβglu-1 involve regulation that is unique to resistant trees.
Our results establish a correlation between gene expression, the accumulation of biologically active acetophenones and the most destructive larval instar of the insect. Our results also show that Pgβglu-1expression is genetically transmitted and can be induced. Coding DNA sequences of the gene were obtained but no differences were observed that could differentiate between resistant and non-resistant trees.
A deeper understanding of the phenomenon could help in the development of an integrated management aiming to mitigate damage caused during outbreaks.
vii
Table des matières
Résumé ... iii
Abstract ... v
Table des matières ... vii
Liste des figures ... ix
Liste des tableaux ... xi
Remerciements ... xiii
Avants-propos ... xv
Chapitre 1 – Introduction ... 1
La tordeuse des bourgeons de l’épinette ... 2
L’épinette blanche ... 5
Les interactions entre plantes et organismes nuisibles ... 7
Survol des mécanismes de défense des plantes ... 8
Le rôle des β-glucosidase dans la défense... 10
Les composés phénoliques ... 11
Mise en contexte ... 12
Le gène candidat ... 13
Hypothèses et objectifs ... 14
Chapitre 2 – Characterization of a novel resistance phenomenon agaisnt spruce budworm (Choristoneura fumiferana) in white spruce (Picea glauca (Voss.) Moench) ... 17
Résumé ... 19
Abstract ... 21
Introduction ... 23
Materials and methods ... 25
Plant material sampling and preparation ... 25
RNA and DNA extraction and quality control ... 26
cDNA preparation and RT quantitative PCR ... 27
Comparative sequencing and PCR ... 28
viii
Statistical analyses ... 30
Results ... 32
Gene sequencing and structure analyses ... 32
Heritability and inducibility ... 34
Seasonal fluctuation ... 39
Discussion and conclusion... 42
Genetics and evolutionary implications ... 42
Ecological and physiological implications of acetophenone-based SBW resistance ... 44
Concluding remarks ... 47
Acknowledgments ... 48
Chapitre 3 – Conclusions et perspectives ... 49
Analyses complémentaires ... 50
Perspectives et applications pratiques ... 53
ix
Liste des figures
Figure 1.1 : Aires de répartition... 6 Figure 1.2 : Acétophénones impliqués dans la résistance. ... 12 Figure 2.1: Comparison of gene structure between Picea glauca’s Pgβglu-1 and most
similar homologs in Oryza sativa and Arabidopsis thaliana. ... 34 Figure 2.2: Expression level of the Pgβglu-1 gene in trees from R and N-R mothers... 37 Figure 2.3: Expression level of the Pgβglu-1 gene in trees from eight different mothers. ... 38 Figure 2.4: Temporal variation of Pgβglu-1 expression and acetophenones concentration. 41
xi
Liste des tableaux
Table 2.1:Primer sequences used for quantitative PCR analysis and sequencing assays ... 31 Table 2.2: Average fold change of the expression of Pgβglu-1 gene for each family pre and post induction time ... 38
xiii
Remerciements
Je voudrais tout d’abord remercier mon directeur de recherche, le Dr John Mackay, pour m’avoir permis de réaliser ce projet dans son laboratoire et m’avoir encadré tout au long de mon cheminement. Je voudrais aussi remercier le Dr Éric Bauce pour avoir accepté d’agir comme co-directeur de mon projet et d’avoir mis à ma disposition matériel et expertises complémentaires pour le mener à bien.
Je tiens aussi à remercier les professionnels de recherche, Isabelle Giguère et Sébastien Caron, qui ont grandement participé à ma formation scientifique et m’ont beaucoup aidé tout au long de ma maîtrise que ce soit pour des conseils, des questions techniques, du travail de terrain ou de la révision de textes scientifiques. Je voudrais aussi remercier tous les membres du laboratoire du Dr John Mackay ainsi qu’André Gagné du CEF pour l’assistance que j’ai reçu lors d’échantillonnages et de préparation de présentations. Un merci spécial à Patrick Lenz et Mébarek Lamara qui ont récolté les semences qui ont été utilisées pour produire les semis de mes expériences. Je n’oublie pas non plus Geneviève Parent pour l’aide précieuse en ce qui concerne l’analyse de mes données ainsi que la finalisation de mon projet.
J’exprime ma reconnaissance envers Martin Charest qui m’a aidé pour tous les échantillonnages sur le terrain, l’expertise sur la tordeuse ainsi que certaines expériences en laboratoire. Je voudrais aussi mentionner les conseils donnés par le Dr Armand Séguin et Denis Lachance pour l’élaboration de protocoles.
xv
Avants-propos
Ce projet a été financé par Génome Québec, Génome Canada, le FQRNT, le CRSNG et réalisé dans le cadre du projet SMarTForests. Il a été exécuté sous la direction du Dr John Mackay et la co-direction du Dr Éric Bauce.
Ce mémoire est séparé en trois chapitres. Le premier est une introduction composée d’une revue de littérature sur la tordeuse des bourgeons de l’épinette et son hôte principal, l’épinette blanche ainsi que sur différents mécanisme de défense contre les insectes et pathogènes chez les plantes. Une brève mise en contexte du projet est aussi présentée.
Le deuxième chapitre est en anglais et est présenté sous la forme d’un manuscrit scientifique. Il serait en partie transmis à une revue scientifique très prochainement mais non pas dans le format ici présent. Les expériences sur la structure du gène, sur l’héritabilité et l’induction ont été réalisées par l’auteur (Gaby Germanos). La partie sur la fluctuation saisonnière a été réalisée avec l’aide de Martin Charest et Geneviève Parent qui ont élaboré le protocole d’extraction des composés phénoliques et d’analyse par HPLC. Geneviève Parent a aussi exécuté les analyses statistiques pour cette même section. L’obtention des données d’expression et d’acétophénones a été réalisée par l’auteur.
Finalement, le troisième chapitre résume les conclusions du mémoire et propose quelques perspectives de recherche et d’applications pratiques en lien avec la résistance contre la TBE.
1
Chapitre 1 – Introduction
Durant un épisode de tordeuse des bourgeons de l’épinette (Choristoneura
fumiferana) (TBE) qui eut lieu au début des années 2000, certains arbres d’une plantation
d’épinettes blanches (Picea glauca (Voss.) Moench) affectée furent visiblement épargnés (Daoust & al, 2010). Des études subséquentes sur les arbres concernés et leurs confrères défoliés ont révélé la présence de deux acétophénones, toxiques pour la tordeuse, dans les aiguilles des arbres intacts (Delvas et al, 2010). La découverte de ces arbres résistants encouragea des études approfondies afin de découvrir les bases génétiques ainsi que les mécanismes moléculaires impliqués dans la résistance et mena à la découverte du gène
Pgβglu-1. Bien que plusieurs questions soient soulevées suite à cette découverte, certaines
ont été jugées primordiales pour la suite des recherches sur ce phénomène et feront donc l’objet de ce mémoire. Premièrement, quelle est la structure du gène Pgβglu-1 et existe-t-il une différence dans la séquence génomique transcrite entre les arbres ayant un phénotype résistant et les défoliés? Deuxièmement, est-ce que l’expression différentielle observée est génétiquement transmissible à la progéniture ou dépend-elle de l’environnement? Enfin, nous allons évaluer si l’expression du gène concerné est sujette à des variations au courant de la saison et si l’accumulation des acétophénones biologiquement actives est corrélée à l’expression.
Les travaux réalisés vont nous permettre d’approfondir les connaissances par rapport aux questions ciblées. Ces dernières ont été jugées prioritaires car elles touchent trois des facettes les plus importantes pour la possibilité de retombées pratiques.
2
La tordeuse des bourgeons de l’épinette
Les épidémies d’insectes ravageurs constituent la perturbation qui cause les plus grandes perte de biomasse forestière au Canada. La tordeuse des bourgeons de l’épinette est considérée comme un des insectes défoliateurs les plus destructifs d’Amérique du Nord et un des organismes les plus nuisibles aux forêts de pins et d’épinettes du continent (Fleming, 2000). Les superficies touchées et la sévérité des épidémies ont augmentés au cours du 20e siècle (Blais, 1983) et la dernière épidémie majeure, de 1973 à 1987, a causé la perte de près d’un demi-milliard de m3 de bois, en mortalité et réduction de croissance, au Québec seulement. Les superficies touchées par la tordeuse ont augmentées continuellement durant la dernière décennie jusqu’à atteindre plus de 3 millions d’hectare de forêt touchée en 2013, la moitié étant gravement touchée (71 à 100 % de perte des pousses de l’année) (Ministère des ressources naturelles, 2013). Il est donc de plus en plus important de raffiner nos méthodes de lutte contre la tordeuse afin de limiter les dommages causés lors des épidémies et arrêter ou même inverser la tendance croissante en ce qui concerne la sévérité et les étendues affectées.
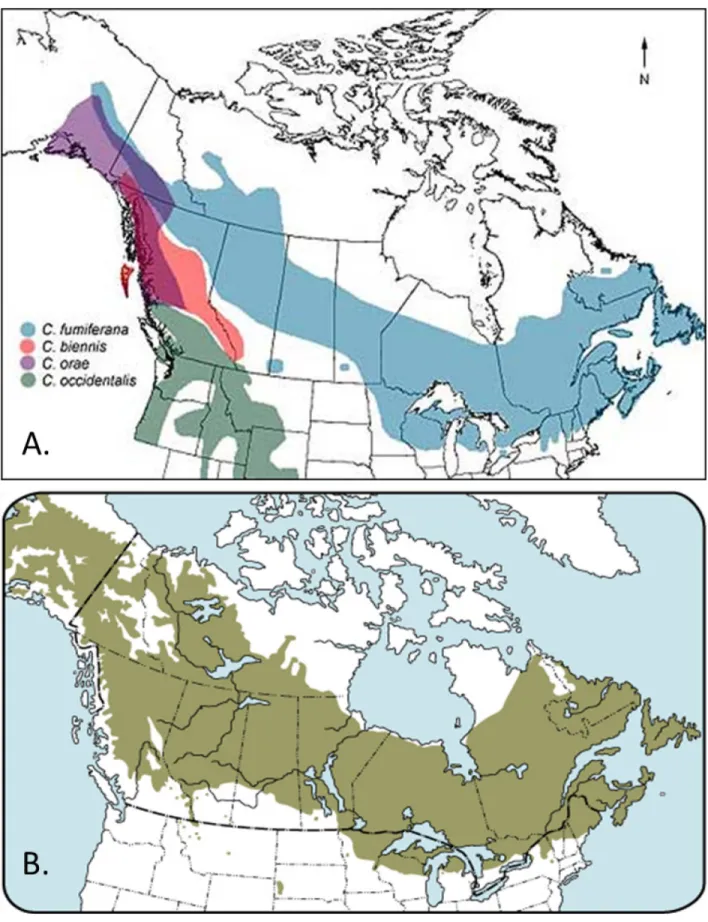
La TBE est un insecte de l’ordre des Lépidoptères, qui mesure 10 à 12 mm avec une envergure de 21 à 30 mm. Sa distribution ainsi que celle de différentes espèces sont présentée à la figure 1.1 A. Son corps est brun foncé et ses ailes sont grises avec des taches plus foncées, le mâle et la femelle sont pratiquement identiques et aussi nombreux (Kucera et Orr, 1980). L’adulte, ou stade papillon, vit seulement une semaine et la ponte a lieu à peine une journée après l’accouplement. LA TBE passe par six stades larvaires et la grande majorité de la nourriture ingurgitée l’est durant le cinquième et sixième stade (Carisey &
3
Bauce, 1997). Le 2ème stade larvaire passe l’hiver en diapause dans un hibernaculum et émerge au printemps et commence alors à s’alimenter.
Il existe un contrôle naturel de la TBE exercé par ses différents prédateurs, parasitoïdes et certains pathogènes. Les principaux prédateurs sont des oiseaux alors que les parasitoïdes sont principalement deux espèces de guêpes (Tranosema rostrale et Elachertus
cacoeciae) et une mouche (Actia interrupta) (Ressources Naturelles Canada, 2012; Kucera
et Orr, 1980). Cependant, en considérant seulement des TBE se nourrissant sur des sapins baumiers (Abies balsamea), 43 parasitoïdes primaires et 21 entomopathogènes furent identifiés sur l’insecte (Eveleigh & al, 2007). La durée d’une épidémie non combattue est imprévisible puisque plusieurs facteurs entre en jeux, la température et la quantité de précipitations ont, par exemple, une multitude d’effets sur l’insecte (Gray, 2013). Il est d’ailleurs nécessaire, pour des raisons économiques et d’aménagement du territoire, que des mesures de contrôle des populations de TBE soient utilisées.
La principale méthode utilisée de nos jours, et la seule utilisée au Québec depuis 1987 (Ministère des ressources naturelles, 2012), est l’épandage d’insecticide biologique, plus précisément, de la bactérie Bacillus thuringiensis var. kurstaki (B. t.). Ce bacille produit une delta-endotoxine, une protéine toxique pour la tordeuse et quelques autres Lépidoptères (Bravo & al, 2007). Appliquée sur les, les aiguilles toxines sont ingérées par les chenilles et entraînent des dégâts au système digestif de celles-ci suivi d’une septicémie (Bravo & al, 2007). La pulvérisation vise non pas à éradiquer la tordeuse mais bien à éviter la mortalité et les pertes de croissance des arbres souffrant continuellement de défoliation.
4
C’est au printemps que l’épandage a lieu et seulement après avoir analysé chaque cas et déterminé le traitement à prescrire (Ministère des ressources naturelles, 2012).
Avant 1987, les principaux insecticides utilisés étaient le fénitrothion (O,O-Dimethyl O-(3-methyl-4-nitrophenyl) phosphorothioate) et le matacil (4-(dimethylamino)-3-methylphenyl methylcarbamate). Le premier s’est avéré toxique pour certains pollinisateurs comme les abeilles (Okada & Hoshiba, 1970; Kevan, 1975) et le dernier pour plusieurs organismes comme les petits pollinisateurs, les mouches, les jeunes saumons de l’atlantique et certains invertébrés marins et d’eau douce (Thomson & al. 1985; McLeese & al, 1980). Au Québec, ces insecticides ne sont plus utilisés dû à leur toxicitée. Il est cependant nécessaire de trouver de nouvelles méthodes pour limiter les dégâts causés par la tordeuse. L’utilisation de résistances déjà présentes dans la nature afin d’introduire des arbres résistant dans des plantations serait une option efficace, durable et peu coûteuse qui est en accord avec le principe de lutte intégrée (Alfaro & al, 1995).
Contrairement à ce qu’indique son nom, la tordeuse des bourgeons de l’épinette a une préférence pour le sapin baumier et c’est l’espèce qui est la plus sévèrement endommagée (Candau & Fleming, 2011; Kucera et Orr, 1980). Mis à part ce dernier, l’épinette blanche est la deuxième espèce la plus atteinte suivie par l’épinette rouge (Picea
rubens) et la noire (Picea mariana) (Nealis and Régnière 2004). D’autre espèces de conifères comme l’épinette de Norvège (Picea abies), le mélèze laricin (Larix laricina), le pin gris (Pinus banksiana) et la pruche du Canada (Tsuga canadensis) peuvent être touchés mais représente une proportion négligeable des arbres attaqués par la TBE (Ressources Naturelles Canada, 2012; Candau & Fleming 2011). L’épinette noire est moins affectée que
5
d’autres membres du genre Picea principalement à cause des aiguilles des années précédentes qui ne représentent pas une source alimentaire adéquate pour les larves qui émergent de diapause (Blais 1957; Nealis and Régnière 2004).
L’épinette blanche
L’épinette blanche est un des arbres le plus répandus au Canada (figure 1.1 B). C’est une des principales espèces qui composent la forêt boréale mais on le retrouve aussi jusqu’au sud des grands lacs. Il est parmi les arbres d’Amérique du Nord ayant la répartition atteignant la plus haute latitude. On le retrouve souvent à la limite arctique des arbres jusqu’à 69° nord. Il peut être planté dans une multitude de sols et de conditions climatiques (Beaulieu, 1996).
L’épinette blanche détient un rôle économique très important au Canada et au Québec. Dans cette province uniquement, 25 millions de plants sont utilisés pour le reboisement à chaque année (Gosselin, 2013). Le bois est utilisé comme matériaux de construction divers, planches, contreplaqués, cadres, et autres. Il est aussi très utilisé pour la pâte à papier (Forestry innovation investment, 2012). Son rendement de 4,6m3/ha par année, en fait un candidat de choix pour son utilisation comme matériel de construction et explique que ce soit l’une des premières essences ayant été ciblée par un programme d’amélioration génétique qui fut mis en place dès la fin des années 50 (Beaulieu, 1996).
6
Figure 1.1 : Aires de répartition
A. Tordeuse des bourgeons de l'épinette. (https://cfs.N-Rcan.gc.ca/projects/107) B. Épinette blanche (http://tidcf.N-Rcan.gc.ca/trees/factsheet/38)
7
Les interactions entre plantes et organismes nuisibles
Il est généralement accepté qu’une grande partie de la diversité qu’on observe dans le domaine du vivant, a été généré par la coévolution entre les espèces et leurs prédateurs, parasites et pathogènes (Thompson, 1994). La pression exercée par les organismes nuisibles pour les plantes ainsi que l’impossibilité de se mouvoir a généré un éventail impressionnant et diversifié de défenses chimiques et morphologiques (Morant & al, 2008; Rausher, 2001).
Plusieurs enzymes et composés chimiques impliqués dans les défenses végétales ont une multitude d’autres fonctions. Certaines études remettent en question la possibilité que les insectes et pathogènes s’attaquant aux plantes soient assez nombreux et sévères pour appliquer une pression évolutive résultant en des mécanismes de défense (Rausher, 2001). Par exemple, les flavonoïdes jouent un rôle dans la reproduction de certaines plantes et la protection contre les UV. Une forte corrélation entre les plantes résistantes et des niveaux élevés de flavonoïdes est remarquée chez plusieurs espèces (Koes et al, 1994). Les β-glucosidases constituent un autre exemple avec un grand nombre de rôle physiologiques dont tous les processus impliquant la transformation de cellulose en glucoses et leur action activatrice de certains composés liés à la défense (Morant, 2008; Hill & Reilly, 2008). Cependant, des études récentes ont obtenus des résultats montrant que les herbivores, insectes, bactéries, virus et champignons qui s’attaquent aux plantes génèrent bel et bien une pression suffisante à l’élaboration ou la modification de moyens de défenses (Rausher, 2001; Züst, 2012). Il y a donc une certaine incertitude en ce qui concerne les forces qui
8
dirige les interactions entre les organismes pathogènes ou les herbivores et leurs hôtes mais plusieurs cas sont étudiés de manière spécifique due à la valeur élevée des plantes touchées.
Les mécanismes de défenses naturels des plantes restent néanmoins souvent les méthodes les plus efficaces pour les protéger des herbivores et parasites indigènes avec qui ils partagent un historique de coévolution (Broekgaarden & al, 2011). C’est d’ailleurs pourquoi on cherche de plus en plus à remplacer les pesticides et que la recherche sur les résistances naturelles aux pathogènes et insectes ravageurs chez les plantes est un domaine de plus en plus documenté (Todesco & al, 2010; Alfaro et al, 2008; Yanchuk et al et al, 2008; Clancy et al 2002; Alfaro et al, 1996; Broekgaarden & al, 2011).
Survol des mécanismes de défense des plantes
Les végétaux ne possèdent pas de système immunitaire comme on le voit chez les animaux. Cependant, ils ne sont pas totalement impuissants face aux maladies et aux organismes nuisibles. Les arbres, ou de manière plus générale, les plantes, ont développé plusieurs mécanismes de défense contre les pathogènes et herbivores afin de limiter les dégâts, arrêter une infection ou tout simplement tuer ou affaiblir les organismes qui s’en nourrissent (Freeman & Beattie, 2008).
Les mécanismes de défenses des plantes peuvent être séparés en deux grandes catégories, les mécanismes constitutifs et les réponses induites. Les mécanismes constitutifs sont assez diversifiés. Les parois cellulaires, les cuticules cirées, l’écorce et les épines sont
9
des exemples de mécanismes constitutifs qui agissent d’une manière physique en offrant à la plante de la rigidité et de la protection. Ce type de défense est surtout utile contre les herbivores mais certains d’entre eux, lorsque intacts, peuvent aussi agir comme barrière empêchant l’intrusion de pathogène (Freeman & Beattie, 2008; Kessler & Baldwin, 2002). Les plantes peuvent aussi produire des métabolites secondaires, comme par exemple les composés phénoliques, toxiques qui affectent suffisamment les herbivores pour qu’ils arrêtent l’ingestion des tissus toxiques. Le désavantage des défenses constitutives est le coût nécessaire à la production et l’entretient de ces dernières, même en absence d’herbivores ou de pathogènes. Dans le cas de substances toxiques, elles ont parfois une certaine toxicité pour la plante aussi et un coût additionnel doit donc être investit pour le stockage des précurseurs (Kessler & Baldwin, 2002). Il est plus avantageux pour une plante qui subit des attaques répétées, d’investir dans des défenses constitutives, que pour une plante qui n’est qu’occasionnellement ciblée (Wittstock & Gershenzon, 2002).
Les réponses induites représentent un mécanisme de défense efficace du point de vue des coûts investis car les produits toxiques, par exemple, ne sont synthétisés que lors d’une attaque. Cependant, c’est une méthode qui peut s’avérer risquée lorsque l’infection ou la destruction des tissus est trop rapide ou cause trop de dommages pour que la plantes puisse se défendre de manière efficace (Wittstock & Gershenzon, 2002). Certains mécanismes induits font intervenir l’action des β-glucosidases pour la libération de composés actifs.
10
Le rôle des β-glucosidase dans la défense
Les β-glucosidases, plus précisément celles appartenant à la famille 1 des glycosides hydrolases, sont des enzymes très répandues qui sont présentes dans plusieurs domaines du vivant. Elles catalysent l’hydrolyse des liens glycosidiques β entre un glucide et un substrat tel un phénol glycosylé (Morant & al, 2008; Hill and Reilly, 2008). L’enzyme ne fait pas preuve de haute spécificité par rapport au substrat glycosylé (Hill and Reilly 2008). Chez les plantes, elles jouent un rôle dans un grand nombre de processus physiologiques de base tel que la lignification et la dégradation des parois cellulaires ainsi que l’activation de phytohormones et de composés chimiques impliqués dans la défense de l’organisme. L’addition d’un ose à un aglycone a plusieurs effets, comme l’augmentation de sa solubilité dans l’eau et de sa stabilité chimique, une réduction de sa réactivité chimique et une modification de son activité biologique (Jones & Vogt, 2001). C’est d’ailleurs pourquoi certains métabolites secondaires sont présents sous une forme glycosylée dans la cellule. Un des rôles de la β-glucosidase dans les situations de défense est donc d’activer des composés biologiquement inertes présents dans la cellule pour les rendre actifs. Dans certains cas l’enzyme est déjà synthétisée et entreposée dans un organite séparé des glycosides. Lorsque la cellule est endommagée par une attaque, il survient un mélange du milieu cellulaire ce qui déclenche la réaction rendant les tissus touchés toxiques (Morant & al, 2008).
11
Les composés phénoliques
Les phénols, ou composés phénoliques, sont un type de composés organiques constitués d’un groupe hydroxyle lié à un groupement hydrocarbure aromatique. Ils sont produits par une multitude de végétaux et qui occupent une panoplie de fonctions comme antipathogènes, précurseurs de polymères structuraux et molécules signalétiques (Hammerschmidt, 2005). Ils font partie des métabolites secondaires les plus abondants dans les tissus végétaux. La concentration en composés phénoliques est très variable selon la saison, l’individu et le stade de développement (Boeckler & al, 2011). Les phénols sont surtout étudiés pour leur rôle dans les situations de stress (Kraus & Spiteller, 1996; Lokke, 1989) ainsi que pour leur association à la résistance contre les infections fongiques, bactériennes et virales chez plusieurs plantes incluant un grand nombre d’arbres de l’hémisphère nord (Harbrone, 1980; Witzell & Martin, 2008; Li, 2002; Maher, 1994). Chez les pins, la présence de phénols a été associée à la grande résistance aux champignons que possède le duramen. Certains flavonoïdes, stilbènes et acétophénones retrouvée dans le phloème de membres des genres Pinus et Picea ont été liés à la résistance contre des champignons associés à des coléoptères xylophages comme le dendroctone du pin (Dendroctonus ponderosae) (Witzell & Martin, 2008). Il existe un grand nombre de familles de phénols mais, ce sont des acétophénones (figure 1.2) qui ont été impliquées dans la résistance contre la TBE. Malgré la versatilité des composés phénoliques et leur rôle important dans la défense contre les insectes et pathogènes, très peu d’exemples de sélection pour des concentrations élevées de phénols existe dans les programmes d’amélioration d’arbres (Witzell & Martin, 2008).
12
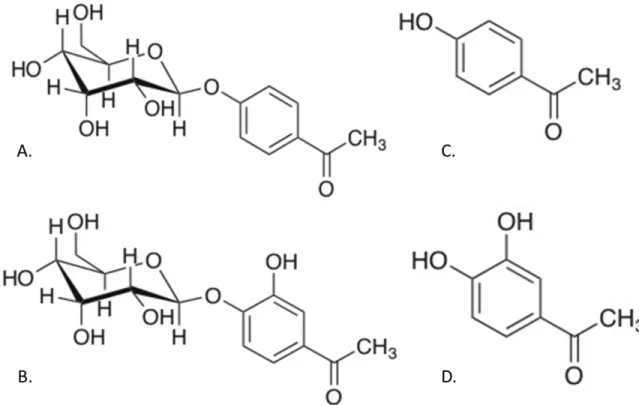
Figure 1.2 : Acétophénones impliqués dans la résistance à la TBE.
A. Picéine B. Pungénine C. Picéol D. Pungénol
Mise en contexte
Daoust & al (2010), ont découvert l’existence d’épinettes blanches ayant subi très peu de défoliation, en comparaison aux autres arbres de la même plantation, suite à une attaque sévère de la tordeuse entre 1998 et 2007. Ces auteurs ont montré une composition chimique des feuilles plus élevée en phénols, tannins et deux monoterpènes (myrcene et α-pinene) dans le feuillage des arbres dits « résistants ». Les monoterpènes auraient un rôle dissuasif sur la TBE et son action serait liée étroitement avec la cire épicuticulaire présente sur les aiguilles. Des expériences ultérieures, ont permis de mettre en évidence un autre
13
facteur majeur de cette résistance naturelle à la TBE (Delvas & al, 2011). La présence de deux phénols, toxiques pour la tordeuse, contribue à expliquer la faible défoliation des arbres identifiés comme résistants. À l’aide de chromatographie en phase liquide à haute performance, les composés qui différaient entre les deux classes phénotypiques ont été identifiés.
Dans le cas des arbres non-résistants, deux glucosides phénoliques, la picéine [3-(b-D-glucosyloxy)-hydroxy-acetophenone] et la pungénine [3-(b-D-glucosyloxy)-4-hydroxy-acetophenone] furent détectés. Chez les arbres résistants, en plus de la picéine et de la pungénine aussi présentes, la forme aglycone était retrouvée, soient, les acétophénones pungénol (3’,4’-hydroxy-acetophenone) et picéol (4’-hydroxyacetophenone) (figure 1.2). Dans des analyses subséquentes il fut déterminé que les acétophénone actives présentes chez les arbres résistants réduisaient le taux de survie des larves, retardaient leur développement et réduisait la masse de la pupe (Delvas & al, 2011).
Le gène candidat
Le gène qui produit la protéine qui catalyserait la transition des acétophénones glycosylés en leur forme biologiquement active est identifié Pgβglu-1. Ce dernier fait partie du groupe des glycosides hydrolases de famille 1 qui renferme une multitude de gènes mais celui ciblé par notre étude c’est avéré être exprimé de façon différente entre les deux classes phénotypiques observées et ce, sans ambiguïté. À l’aide d’une biopuce regroupant des sondes représentant près de 24 000 gènes de l’épinette blanche (Raherison & al 2012), les niveaux d’expression entre les arbres résistants et non-résistants furent comparés. Le
14
gène de la βglu-1 est celui pour lequel la plus grande différence d’expression fut observée. Ce dernier, avait une expression 773 fois plus élevé chez les arbres résistants. À titre de comparaison, les deuxièmes et troisièmes gènes dans la liste étaient exprimés 92 fois et 15 fois plus. Le deuxième gène ayant la plus grande différence d’expression entre les deux classes d’arbres faisait aussi partie de la famille des glycosides hydrolases. L’activité de la protéine a, par la suite, été confirmée par des expériences encore non-publiées (Mageroy et al, en préparation).
Hypothèses et objectifs
Le principal objectif de ce projet est de caractérisé le gène Pgβglu-1 et d’étudier son rôle ainsi les mécanismes impliqués dans le phénomène de résistance contre la TBE chez l’épinette blanche.
La première hypothèse veut qu’il existe une ou plusieurs différences dans la séquence du gène Pgβglu-1 qui pourraient expliquer les différents phénotypes observés chez les arbres matures.
La deuxième hypothèse est qu’il existe une corrélation temporelle du niveau
d’accumulation des transcrits du gène Pgβglu-1, de l’accumulation des acétophénones dans les aiguilles et des stades larvaires de la TBE responsables de la défoliation.
15
Enfin, la troisième hypothèse est que l’expression différentielle du gène Pgβglu-1 qu’on observe chez les arbres mature est un trait transmissible à la progéniture et non due uniquement à des facteurs de l’environnement.
17
Chapitre 2 – Molecular characterization and expression
of a novel resistance gene agaisnt spruce budworm
(Choristoneura fumiferana) in white spruce (Picea glauca
(Voss.) Moench)
Gaby Germanos1, 2, Geneviève Parent1, 2, Isabelle Giguère1, 2, Martin Charest1, Éric Bauce et John
Mackay1, 2
1Centre d’étude de la forêt, Département des sciences du bois et de la forêt, Université Laval, Québec, Qc, Canada G1V 0A6
2Institut de biologie intégrative et des systèmes, Université Laval, Québec, Qc, Canada G1V 0A
19
Résumé
Lors d’une épidémie localisée de la tordeuse des bourgeons de l’épinette (TBE) dans le sud du Québec au début des années 2000, certains arbres d’une plantation d’épinette blanche affectée furent largement épargnés. Le faible taux de défoliation observé chez ces arbres a été associé à différents facteurs, notamment, l’accumulation dans les aiguilles de composés chimiques toxiques pour la tordeuse. Un gène (Pgβglu-1) codant pour une bêta-glucosidase a été identifié comme étant lié à la production de certains de ces composés chimiques, les acétophénones. Notre hypothèse est que la variation de l’expression du gène relève d’une régulation inhérente et unique aux arbres résistants. Des analyses comparatives ont été menées et trois volets principaux seront présentés en lien avec l’hypothèse de base. Nos résultats permettent d’établir une corrélation entre l’expression du gène, l’accumulation des acétophénones actives et le stade le plus destructif de l’insecte. Les expériences d’héritabilité sur des semis montrent que l’expression de la progéniture est transmise par la mère. Des tests d’inductions menés en conditions contrôlées sur ces mêmes semis ont révélés une réponse variable entre les familles atteignant jusqu’à une augmentation de 200% de l’expression. Les séquences d’ADN codant du gène ont été obtenues pour 14 arbres matures ayant subi l’épidémie de 1998 à 2007 et aucune différence n’a été observée permettant de différencier les arbres résistants des non-résistants. Une connaissance plus approfondie du phénomène pourrait aider au développement d’une lutte intégrée visant à mitiger les dégâts causés par la tordeuse en période d’épidémie, notamment par l’utilisation d’arbres résistants.
21
Abstract
During a localized spruce budworm (Choristoneura fumiferana) outbreak in the south of Quebec some trees of a white spruce plantation (Picea glauca (Voss.) Moench) were left almost untouched while many others had severe defoliation. The low levels of defoliation observed in those trees were attributed to many factors, one of them being the accumulation in the needles of chemical compounds, toxic for the budworm. A gene (Pgβglu-1) coding for a beta-glucosidase enzyme was identified and was linked to the accumulation of acetophenones. We propose that the expression variation of Pgβglu-1 involves a regulation that is unique to resistant trees. Comparative analyses were conducted to test this hypothesis. Our results showed a correlation between gene expression, the accumulation of biologically active acetophenones and the most destructive larval instar of the insect. Heritability experiments on seedlings also show that Pgβglu-1expression in the progeny is influenced by the mother. Induction tests conducted in controlled conditions on the same seedlings revealed a varying response between families reaching a maximum increase of 200% in expression. Coding DNA sequences of the gene were obtained for 14 mature trees that suffered the 1998-2007 outbreak but no differences were observed that could differentiate the resistant from the non-resistant. Our results indicate that understanding the underlying cause of Pgβglu-1gene expression variation could help in the development of an integrated management aiming to mitigate damage caused during outbreaks, notably by using resistant trees.
23
Introduction
The spruce budworm (SBW) is one of the most destructive defoliating insect in North-America (Fleming, 2000). The severity of outbreaks and the magnitude of areas afflicted have been on the rise during the 20th century (Blais, 1983). The most recent outbreak, which lasted from 1973 to 1987, reached a peak in 1975 when over 35 million hectares of forest were estimated to have severe SBW damage in the province of Quebec (Ministère des ressources naturelles, 2013). The same outbreak caused the loss of approximately half a billion of cubic meter of wood from mortality and reduced growth, again in Quebec alone (Coulombe et al., 2004). In 2013, the surface under SBW defoliation was estimated to 3 206 024 hectares representing a 44% increase from 2012 (Ministère des ressources naturelles, 2013).
From 1998 to 2007 (Bauce, unpublished) a localized SBW outbreak that took place in a white spruce plantation (Picea glauca (Voss.) Moench) located in the south of Quebec left some trees almost untouched while many others had severe defoliation (Daoust et al. 2010). The spruces from the plantation were separated in two phenotypic classes, the undamaged trees, with less than 30% of needle loss, were considered resistant (R) and the more heavily defoliated trees as non-resistant (N-R). Subsequent experiments revealed the accumulation of two acetophenones, piceol and pungenol in the foliage of R trees; the compounds were not detected in N-R trees. In contrast, their precursors, picein and pungenin, were found in the foliage of both R and N-R trees. Feeding tests with the insect confirmed that the two compounds found exclusively in R needles were toxic for the SBW, causing growth loss and death 49 % of the larvae (Delvas et al. 2011).
24
The Pgβglu-1 was shown to accumulate transcripts in R trees at levels almost 773 times those observed in N-R trees (Mageroy et al., in preparation). Pgβglu-1 is a member of the glycosyl hydrolase family 1, a family of enzymes known to catalyze the hydrolysis of the glycosidic bonds between a glycosyl residue and a molecule to which it is bound (Hill and Reilly, 2008). The differential expression (DE) of Pgβglu-1 is proposed to be linked to the difference in acetophenones levels described in R and N-R trees. The discovery of this gene is believed to play an important role in the resistance and is a major step forward in understanding host-parasite interactions related to the SBW.
Naturally occurring resistance to insects in trees is a widely researched topic, especially for species that yield an economical value (Alfaro, 2008; Yanchuk et al et al, 2008; Clancy et al 2002; Alfaro et al, 1996). However, resistance against the SBW is not well understood and the underlying genetic or molecular mechanisms remain unknown. In order to establish the potential for using natural resistance traits for the benefit of forest health, several research questions must be addressed, including gene sequences and regulation, heritability and population diversity in host species including white and other spruces, as well as firs. This paper addresses several of these issues. We aimed to determine the structure and the complete sequence of the Pgβglu-1 gene, evaluate the genetic heritability of the DE and finally study the fluctuation in Pgβglu-1 gene expression and acetophenone accumulation during the growth season in relation to the SBW life cycle and to tree phenology. Our findings reinforce the hypothesis that the Pgβglu-1 has a major role to play in SBW resistance.
25
Materials and methods
Plant material sampling and preparation
Progeny of seven resistant (R) and six non-resistant trees (N-R) were obtained by growing plants from open-pollinated seeds that were collected in September 2011 (120 to 200 seeds per tree), cleaned and stored at -20° C. Seeds were germinated and plants (seedlings) grown in standard conditions for P. glauca: high density polyethylene 110 ml pots, a standard potting mix of peat, perlite and vermiculite (60%, 20%, 20%, respectively) and fertilized weekly with 20/20/20. The plants were grown in a plastic greenhouse from June 2012 to April 2013, which represents an extended growth period. Half of them were then placed in cooled growth rooms for hardening off and put through a rest period of 13 weeks while the others were kept in growing condition in 1,7L pots. The seedlings were taken out of the growth rooms then transferred to 1.7 L pots in July 2013 and placed in an open end plastic house for growth.
The 4th of september, 20 trees from 8 families were sampled for the heritability experiment. After sampling, four families were selected and 20 trees of each were moved to a different greenhouse where they were sprayed with a jasmonic acid solution, a stress response regulator in plants (McConn & al, 1997; Germain & al, 2012), in attempt to induce expression of the Pgβglu-1 gene. The solution was 500 μM of jasmonic acid stock solution in water. The stock solution was 500mM of acid jasmonic in ethanol. Two and a half hours separated the inductions and the saplings were sampled 5 hours after the first, flash frozen in liquid nitrogen and kept frozen until further manipulations.
26
Plant material for the experiment on mature trees was obtained from 48 years old white spruces (Picea glauca (Moench) Voss) in a plantation near Drumondville in Saint-Cyrille-de-Wendover (QC, Canada) during the summer of 2013. Tissue samples were collected from 10 randomly selected trees and consisted of current year needles from the median part of the foliage. Sampling was conducted 7 times during summer at the following dates: May 28, June 6, 18 and 27, July 24, August 13 and September 16. The samples were immediately frozen in liquid nitrogen after collection and kept at -80°C until further use.
Frozen needles were ground using a MixerMill 300 (Retsch, Haan, Germany) and steel grinding balls cooled in nitrogen. The fine powder obtained was then kept at -80°C until RNA and phenolic compounds extractions.
RNA and DNA extraction and quality control
Total RNA was extracted following the method of Chang and al.(1993) with minor modifications described in (Pavy et al. 2008). Total RNA concentrations were determined spectrophotometrically using a NanoDrop 1000 (Thermo Scientific, Wilmington, DE, USA) and their quality were assessed using the Agilent 2100 Bioanalyzer with RNA 6000 Nano LabChips (Agilent Technologies Inc, Santa Clara, CA, USA).
27
Genomic DNA was extracted using a DNeasy Plant Mini Kit (QIAGEN, Venlo, Netherlands) following the instruction of the manufacturer. Total DNA concentrations were determined spectrophotometrically using a NanoDrop 1000 (Thermo Scientific) and DNA integrity was assessed with agarose gel electrophoresis.
cDNA preparation and RT quantitative PCR
Complementary DNAs (cDNA) were prepared from 500 ng of total RNA using the first strand cDNA synthesis system (LifeTechnologies, Carlsbad, CA, USA) following manufacturer’s instructions. RT qPCR mixtures contained QuantiFast SYBR Green PCR kit (QIAGEN) and were as follow: 1× master mix, 300 nM of 5' and 3' primers, and target cDNA (5 ng) in a final volume of 15μl. Reactions were setup using an epMotion 5075 pipetting robot (Eppendorf, Hamburg, Germany) and amplifications were carried out in a LightCycler 480 (Roche, Penzberg, Germany). Cycling was performed as follows: an initial 15-min activation step at 95°C, followed by 50 cycles of 94°C for 10 s and 62°C for 1 min; a single fluorescent read was taken after each cycle immediately following the annealing and elongation step at 62°C. Melting curve analysis was performed at the end of cycling to ensure single product amplification of the appropriate melting temperature (method from Boyle et al. 2009).
The elongation factor alpha (ef1a– BT102965), the cell division cycle cdc2 gene (BT106071), and a gene encoding a cytoplasmic ribosomal protein PgRPL3A-1 (BT115036) were used as endogenous control sequences to normalize the RNA abundance of candidate genes. The selection method for the reference genes is described in Beaulieu et
28
al. (2013). The numbers of molecules (transcripts) were calculated using the LRE methodology (Rutledge and Stewart 2008) adapted for Excel (Boyle et al. 2009).
Comparative sequencing and PCR
Primers for the Pgβglu-1 gene (BT114253) were designed based on the white spruce gene sequence cataloguereported by Rigault et al. (2011), using the Primer3Plus software (http://www.bioinformatics.nl /cgi-bin/primer3plus/primer3plus.cgi) and
Oligonucleotide Properties Calculator (http://www.basic.northwestern.edu/biotools/oligocalc.html) to verify the complementarity
of the primers. The primers were also blasted against the catalogue to verify their specificity and were then used for PCR on genomic DNA sampled in 2010 from 7 resistant and 7 non-resistant adult trees from the Drummondville plantation. The amplification was conducted with the Platinum taq DNA polymerase High Fidelity (LifeTechnologies, Carlsbad, CA, USA) following the instructions provided by the manufacturer for the mixture preparation. The PCR program consisted of: 5 minutes at 94 °C followed by 35 cycles of 15 seconds at 94 °C and 1 minute at 62 °C and a final elongation step of one minutes at 68° C. Amplicons were sent the IBIS’ sequencing platform (Pavillon Charles-Eugène-Marchand, Université Laval, Québec) where they were purified with ExoSAP-IT® For PCR Product Cleanup (Affymetrix, Santa Clara, CA, USA) and sequenced with the Sanger method. The results were aligned and analyzed with BioEdit software (http://www.mbio.ncsu.edu/bioedit/bioedit.html).
29
Acetophenone extraction and high performance liquid chromatography analysis
Phenolic compounds were extracted from 50-100 mg of fine needle powder which had been kept at -80° C. Each sample was mixed with 600 µl of 70% MeOH containing 1 mg/ml of benzoic acid (internal standard) and incubated at 4°C on an agitation plate for 6 hours. The samples were then centrifuged at 13 000 rpm for 10 minutes. Afterward, the supernatant was removed and kept at -80° C while 600 µl of MeOH with benzoic acid was added again. The mix was then stored at 4°C on the agitation plate. The same steps were repeated 24 hours after the initial storage. The reaction was stopped for the last time at 48 hours and the supernatant was retrieved.
The Variant Prostar HPLC used for quantification was equipped with a UV detector 325, an autosampler 420 and a solvent delivery module 240. The acetophenones were separated through a Polaris MetaGuard 4.6mm precolumn and a Polaris 250 x 4.6 mm C18-A (C18-Agilent Technologies Inc, Santa Clara, CC18-A, USC18-A) column both heated at 62°C. The liquid phase consisted of solvent A: distilled H2O with 0.2% of formic acid (HCO2H) and solvent B: acetonitrile (CH3CN) and 0.2% of formic acid. The following gradient was used: 0.0-0.5 minutes, 100-95% A, 5.0-10.0 minutes, 78-65% A, 13.0-16.0 minutes, 50-5% A, 17.0-17.1 minutes, 5-95% A and finally 18.0-20.0 minutes, 100% A. The flow rate was 1.5 ml per minute.
30
Statistical analyses
Analyses were performed with the R 3.0.1 software (R Foundation for Statistical Computing, Vienna, Austria) for the section on heritability and induction data and SAS 9.3 software (SAS institute, Cary, NC, USA) was used for the analysis of the seasonal fluctuation. The level of significance for every statistical tests was α = 0.05.
An analysis of variance (ANOVA) was performed on the expression data from the seedlings from eight families and on the fold change between pre and post induction time. A logarithmic transformation was applied on gene expression data used, except fold change, to meet the assumption of normality and homogeneity of variance. Duncan’s new multiple range test was used to establish differences between each of the eight families used in the heritability experiment and to compare the fold change between the four families used in the induction experiment.
A student t-test was used to compare overall expression of R and NR progeny. Paired student t-tests were used for each of the four families of the induction experiment to evaluate the expression contrast between pre and post induction time.
Effect of the date on expression levels and acetophenone accumulation was analyzed with a mixed procedure ANOVA. An autoregressive correlation term of order 1
31
was included to correct for serial correlation of the data. Differences between least squares means was then assessed with a Tukey-Kramer test.
Assays Primer ID Sequences (5' -->3') Tm Position3 Position3 Primer Pair
cDNA cloning and analysis in cDNA in gDNA
RT-qPCR1 βglu-E1-F GCCCAGGCTAATATATCACAGCAAG 64,1 1091 --- βglu-E1 βglu-E1-R GTTGTCGAAATCACCATACCCTGTC 64,9 1264 --- βglu-E1 Comparative sequencing2 βglu-P1-F GCGATGAGATTTGGTTCCACTGTAG 65,1 --- 8 βglu-P1 βglu-P1-R GAAGCTGGAACCTGATAAGCAGATG 64,5 --- 700 βglu-P1
βglu-S1-F CGCCTTCAACTACGCTATAAATTCTG 63,3 -57 486 βglu-S1
βglu-S1-R GACCAGGAAATAGAAAAACGATAGAGG 62,6 335 1256 βglu-S1
βglu-S2-F GGATGTTGCGGTAGATCAATACCAC 64,7 240 1007 βglu-S2
βglu-S2-R CGTAGCCATATAATGTAAAGGTCAGCG 64,7 709 1932 βglu-S2
βglu-S3-F CTTTCGGAGACCGTGTGAAGTATTG 65,1 557 1780 βglu-S3
βglu-S3-R GTTTGAGTATGGCACCATCCAGTTC 65,0 834 2155 βglu-S3
βglu-S4-F CACATAGCGCCGCTGTCAAAAC 67,0 731 1954 βglu-S4
βglu-S4-R GTGGGATTGTTGACCGTAAAGTATG 62,7 1053 2530 βglu-S4
βglu-S5-F GTCGGGGAAGTACCCTGATTCTATG 65,0 907 2384 βglu-S5
βglu-S5-R TTTATCACTTCCCTCAATCCAGCAG 64,7 1194 2925 βglu-S5
βglu-S6-F AACGGAGTTTACGTTGGATCCTCTG 65,6 1118 2731 βglu-S6
βglu-S6-R CCTTATGGCTTCAAGTAGGGATGATAG 63,4 1354 3204 βglu-S6
βglu-S7-F ACTGAGACAGGGTATGGTGATTTCG 64,6 1235 2966 βglu-S7
βglu-S7-R CCAAGTGCAGTTGCAGGAATAAATG 65,8 1549 3488 βglu-S7
βglu-S8-F CGAGTGGATATGACTATCGCTTTGG 65,0 1413 3352 βglu-S8
βglu-S8-R CATGGACCTCAACAACAATCTGAG 63,0 1705 3644 βglu-S8
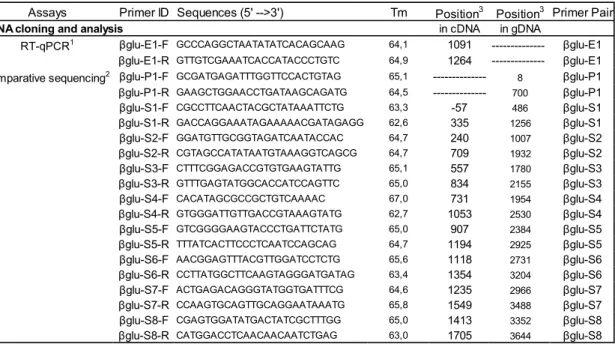
Table 2.1:Primer sequences used for quantitative PCR analysis and sequencing assays.
1 Primers used in RT-qPCR assays for cDNA amplifications of R and N-R trees to determine the RNA transcript levels of the Pgβglu-1 gene.
2 Primers used for PCR amplification and sequencing of the Pgβglu-1 cDNA and genomic sequences.
3 Position was determined relative to the first coding ATG in the cDNA (negative values are in the 5'-UTR), and relative to the first nucleotide of the available genomic sequence.
32
Results
Gene sequencing and structure analyses
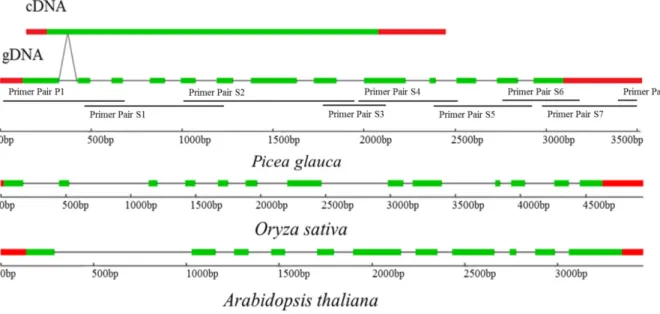
The P. glauca Pgβglu-1 cDNA sequence has been reported (MacKay, unpublished: Genbank) and a partial mRNA sequence was previously released (Rigault et al. 2013). In the present study, genomic DNA sequences representing the transcription unit (complete CDS, 3’ and 5’ UTRs) and a short stretch of upstream flanking 5’ DNA were isolated to enable comparative analyses. The sequences were obtained for 14 trees (7 R and 7 N-R) by PCR amplification followed by amplicon sequencing (see methods for details). The 5’ flanking sequence was obtained from a scaffold of the P. glauca genome assembly (Birol et al., 2013). Exons and introns were identified and positioned by alignment of the amplified genomic fragments against the cDNA (Figure 2.1). The resulting genomic sequence was 3514 bp in length; it contained 13 exons (total of 2121 bp) and 12 introns (1393 bp).
The P. glauca βglu-1 gene was most similar to A. thaliana beta-glucosidase 40 (BGLU40) and a close homolog was also identified in Oryza sativa (Os04g0474900). The amino acid sequences were conserved at 49% and 53% of the sites with A. thaliana and O.
sativa, respectively. Gene structures were very similar between the three species, except
that A. thaliana had 11 exons instead of 13 as found in P. glauca and O. sativa (Figure 2.1). As might be expected, coding sequences similarity was much higher when compared with homologs identified in other conifers, including loblolly pine (Pinus taeda: 86%) and Sitka spruce (Picea sitchensis: 76%). Several other similar sequences belonging to glycosyl hydrolase family 1 were found in the P. glauca (Rigault et al., 2011) and A. thaliana and O.
33
sativa, representing 26, 14 and 7 closely resembling genes, respectively.
Comparative sequence analyses aimed to search for genetic differences between R and N-R trees that could be related with the DE and to insect resistance. Our hypothesis was that the DE of Pgβglu-1 that was described (Mageroy, in preparation) was caused at least in part by genetic variations between the trees with R and N-R phenotypes. The data did not reveal any polymorphisms within the Pgβglu-1 gene that could discriminate between R and N-R trees or shed light on the mechanisms involved in the DE. While a number of SNPs were found, they represented variations in individuals within each group and did not follow the pattern that we had predicted based on the phenotypes of the trees. An AMOVA (Analysis of Molecular Variance) showed that the large majority of the variance (96%) was within each of the phenotypic classes and not between them. This observation indicates that the cause of the DE is not related to variations within the DNA sequences that were analyzed but may be located elsewhere in the genome.
34
Figure 2.1: Comparison of gene structure between Picea glauca’s Pgβglu-1 and most similar homologs in Oryza sativa and Arabidopsis thaliana.
Position of primers that were used for amplification and comparative sequencing of
Pgβglu-1. The gene from A. thaliana represented is BGLU40 and the gene from O. sativa
is Os04g0474900. Green boxes represent exons, lines represent introns and the res boxes represent the TUR. For primer names, position and sequence, see Table 1.1.
Heritability and inducibility
Transcript accumulation was determined by RT-qPCR with gene specific probes as an indicator of the Pgβglu-1 gene expression. Six-month old open-pollinated offspring of from both the R and N-R trees were tested and none of them expressed the gene. We hypothesized that expression may be age or size dependent, or alternatively require induction. Further testing was carried out on one year old plants, part of which were allowed to continue growing freely in the greenhouse and part of which were put through a dormancy cycle before continuing their growth. Results obtained from plants that were larger in size or that had begun a second growth season showed that some of the trees in each of the groups had a significant level of expression of the Pgβglu-1 gene. These results
35
indicated that emergence from a rest period or reaching a superior size is not necessary for expression but might be sufficient and that trees as young as one year old can accumulate
Pgβglu-1 transcripts. Only the one year old spruces that were in growth conditions during
the winter were used for the following experiments for uniformity purpose.
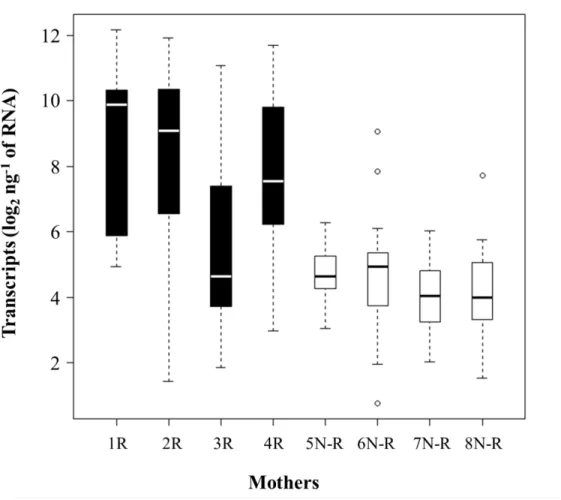
The expression level of the Pgβglu-1 gene in o-p progeny (n=75), of four R and four N-R mother-trees, was determined and compared. The objective was to establish if the DE observed in the parents was passed down to the next generation. The average transcript accumulation level in trees from R mother-trees was 18 times more than those from N-R mother-trees (T-test, p value < 0.001; figure 2.2). Individual o-p families were then compared to evaluate the pattern of inheritance in more detail (fig 2.3). The means of three of the four R families were significantly higher than their N-R families (ANOVA, F-value = 13.12, p-value <0.001). Considering that only the phenotype of the mother-tree was known, i.e. R or N-R and that we observed a significant difference in transcript accumulation between their offspring, the data strongly indicate that the DE is heritable. The data also indicated that expression among the progeny of R trees is highly variable and some of the progeny have very low expression, which is easily explained by the fact that they resulted from wind pollination likely involving several male parents.
We also observed that even among the seedlings from R mothers, transcript levels were 5 to 10 times inferior to the levels detected in mature test trees. We hypothesized that the higher expression in the parents could result from after effects or induction of gene expression following the recent outbreak of SBW in the plantation. Alternatively, the offspring may have been simply too young to have high Pgβglu-1 expression. We tested
36
whether Pgβglu-1 expression was inducible in young trees by using two families from R mothers and two from N-R mothers among those analyzed in the heritability experiment were used. Transcripts accumulation was measured before and after induction with jasmonic acid, a stress response regulator in plants (McConn & al, 1997; Germain & al, 2012). The induction aimed to test the hypotheses that gene expression was inducible. Three of the families showed a significant increase in expression after induction, and the progeny of one N-R mother (8N-R) did not respond to the treatment. While statistically significant (p-value < 0.05), the increased gene expression in the progeny of 5N-R was much lower than in the two R families (table 2.2). Average variation in expression was also significantly different between the 1R family and the two N-R families. Following induction, transcript accumulation in some seedlings reached similar levels as observed in mature R trees.
37
Figure 2.2: Expression level of the Pgβglu-1 gene in trees from R and N-R mothers.
(n = 75, 8 families, 4 R and 4 N-R with approximately 20 individuals per family) Student t-test p value < 0.0001. Expression levels were quantified by qPCR.
38
Figure 2.3: Expression level of the Pgβglu-1 gene in trees from eight different mothers.
(n = 75, 8 families, 4 R and 4 N-R with approximately 20 individuals per family) ANOVA F value = 13.12, p value < 0.0001. Expression levels were quantified by qPCR.
Trees Average fold change Group
1R***
3.27
a
3R**
2.05
ab
5NR*
0.94
b
8NR
0.30
b
Table 2.2: Average fold change of the expression of Pgβglu-1 gene for each family pre and post induction time.
Families with the same letter are not significantly different after induction.
Asterisk by the name of the trees represent whether or not this family saw a significant increase in expression after induction.
39
Seasonal fluctuation
Mature R (n=5) and N-R (n=5) trees as described here were sampled throughout the growing season to assess if the level of expression of the Pgβglu-1 gene varied along with phenology. We hypothesized that expression should be timed to allow accumulation of acetophenones during larval stages associated with the heaviest level of feeding. The five N-R trees did not accumulate transcripts of the gene in considerable amounts and the number of transcripts did not fluctuate during the sampled period. The R trees, however, accumulated high levels of transcripts early in the beginning of the season. The expression dramatically increased between the 6th and 18th of June (figure 2.4). From June 18th until the end of the season, expression levels of the Pgβglu-1 gene were significantly higher in R tree than in N-R.
Determinations of acetophenone concentrations in the needles revealed that piceol and pungenol begin to accumulate at approximately the same time in R trees and vary somewhat through the summer. Piceol was not present in significant amount in N-R trees while pungenol accumulated slightly but at levels much lower than in R trees. The concentrations of piceol and pungenol in R needles at the third point (June 18) seen on figure 2.4 were not statistically different from those measured in N-R trees. Picein levels also varied considerably during the season, starting at very low levels and accumulating to high levels by the end of June, but were not different between R and N-R trees.
The aglycon concentrations in R trees were over two times the concentrations that were previously shown to reduce larval survival and pupal mass (Delvas, 2011). The peak of expression and acetophenone accumulation were closely timed with the sixth larval stage
40
of the SBW as was observed on the field site from 1999 to 2007. It is at the sixth instar that the SBW eats 90% of the food it ingests during the entirety of its larval phase (Carisey & Bauce, 1997). These results show that the differences observed between the R and N-R trees during the outbreak are associated with expression levels of the Pgβglu-1 gene and that expression was highly variable during the studied time span. The correlation between the highest level of transcript accumulation, the presence of the biologically active acetophenones and the most destructive larval instar of the SBW are indicative of a synchronism between the biological life cycle of the pest and the expression of the resistance phenotype.
41
Figure 2.4: Temporal variation of Pgβglu-1 expression and acetophenones concentration.
2013 growing season (n=10, 5 R and 5 N-R), Fifth and sixth larval instar, pupae and adult are also represented at the time points during which they occur. “**” R is significantly higher than all N-R determinations, “*” R is significantly higher than N-R points at same date. Black circles represent resistant trees and white circles represent non-resistant trees.
42
Discussion and conclusion
The SBW is indigenous to eastern North America and is natural pest of spruce and fir forests. The present study showed that the DE Pgβglu-1 between R and N-R trees could be passed down to progeny and increased via induction with jasmonic acid. The role and genetic control of Pgβglu-1 expression and accumulation of biologically active acetophenones in SBW resistance was supported by their profiles in R trees during the growing season as it matched with critical phases during the SBW life cycle monitored on the same site over 10 years. The complete sequences of the transcription unit of the
Pgβglu-1 gene was obtained for both R and N-R trees but were insufficient to discriminate between
them, suggesting that the underlying molecular mechanisms may be located in flanking DNA sequences or at independent loci. Our findings are discussed in regard to their evolutionary implications and the ecophysiological factors influencing the SBW-spruce interactions.
Genetics and evolutionary implications
The genetic mechanisms underlying the differences between R and N-R trees described in the present study remain unexplained. While polymorphisms within the gene have been ruled out as having a causal role in expression, our analyses only represent a first step in the identification of responsible factors. There are many ways by which expression can be regulated and we only explored variation within the gene itself, as it could result in premature termination of transcription (e.g. through non-sense mediated mechanisms) or decreased RNA stability. The promoter and cis regulatory sequences such as enhancers found in 5’ flanking regions, for instance, play a central role in regulation of expression
43
(Juven-Gershon & Kadonaga, 2010) and polymorphisms in this region have been shown to alter expression of the neighboring gene in many organisms (Yu & al, 2001; Bélanger & al, 2005; Zhang & al, 2008). It would be reasonable to direct efforts toward finding a genetic difference between the R and N-R trees in the promoter region of the Pgβglu-1 gene. The accumulation of multiple copies of the gene – i.e. copy number variation (CNV) - could also explain the high levels of expression we observed in some trees. However, the DE was extremely contrasted and it seems unlikely that a dosage effect as is usually expected when CNV is the principal cause of DE would be sufficient to result in such differences unless a separate mechanism such as the suppression of expression is involved (Woodwark & Bateman, 2011; Perry & al, 2007).
The SBW resistant phenotype that we investigated would appear to confer a selective advantage considering that attack by the SBW during outbreaks is frequently lethal when sustained over several years. Therefore, one can wonder why the trait (i.e. accumulation of acetophenones) is not yet fixed in the white spruce population. Because of the small sample of trees studied it is not possible to infer how frequent or variable it is in the population. Our work provides an indication that it is likely to be heritable from indirect evidence based on inheritance of the Pgβglu-1 gene expression. This is a prerequisite for the trait to be maintained in the population but is not sufficient as such. Other analyses suggest that high levels of variation in the trait is not unique to the trees studied here (Parent et al., unpublished) but the sampling of additional locations will be required to make inferences pertaining it’s abundance, maintenance and mode of transmission in population.
44
The synthesis and accumulation of picein, piceol and pungenin in other members of the Picea genus, such as Norway spruce (Picea abies) (Witzell & Martin, 2008; Münzenburger, 1990; Lokke, 1989), and the amino acid sequence similarity between
Pgβglu-1 and a closely related gene in loblolly pine suggest that it is unlikely that the
resistance is a newly acquired trait. Another explanation of the lack of fixation would be trade-offs associated with the production and accumulation of biologically active acetophenones that would confer a superior fitness to N-R trees between outbreaks. An example of a known trade-off is the late budburst of some Douglas-fir (Pseudotsuga
menziesii var. glauca [Beissn.] Franco) that confers protection against western spruce
budworm (Choristoneura occidentalis) defoliation but results in a reduced competitive ability (Chen & al, 2003). In white spruce, the accumulation of phenolic aglycons could alsohave negative impacts on the tree fitness, associated with cellular toxicity (Wittstock & Gershenzon, 2002). The production of piceol and pungenol could also represent a high energy cost for individuals that produce them and have an impact on their growth or biomass production.
Ecological and physiological implications of acetophenone-based SBW resistance
Accumulation of secondary metabolites after wounding by an insect or a pathogen is quite common in many plants and is a well-studied topic (Reymond and Farmer, 1998). An extensive review of the phenolic metabolites and their role in northern tree defenses against insects, fungi, virus and bacteria showed just how widespread these compounds are and the vast array of pathogens that trigger their accumulation (Witzell & Martin, 2008). In the present study, the trees did not have significant levels of SBW feeding during the year
45
of sampling nor for the five previous years as no larvae or damage to the trees was observed. This indicates that the resistance mechanism is likely to be constitutive, at least in part. R trees do not rely on insect feeding as a short term trigger for the production of piceol and pungenol but our results also indicate that they can respond with enhanced expression of Pgβglu-1 following induction in controlled conditions. Our data indicated that the regulation of the Pgβglu-1 gene and accumulation of the biologically active acetophenones are strongly dependent on phenology. Our findings relating to temporal accumulation are to be expected for a resistance trait under selection given the thousands of years of co-evolution between the insect and its host. There are few examples documenting such a specific and closely related relation between a single gene, biologically active compounds and a pest.
There is uncertainty about the effects of current and future climate changes on boreal species such as spruces and firs in regard to interactions with the SBW, especially during outbreaks. Temperature has been shown to be one of the main factors influencing budburst and early spring phenology (Canell & Smith, 1983; Fu & al, 2012; Hannerz, 1999, Morecroft & Keith, 2009). It is reasonable to think that temperature also plays a major role in the activation of the process which results in accumulation of piceol and pungenol. If that is the case, then climate variation could have impacts on the interaction between spruce and fir host and their pests including SBW.
The SBW, like many insects, depends on temperature to initiate emergence from postdiapause state (Régnière, 1990; Tauber & al., 1986) which means that the phenology of resistant trees may remain synchronized with the life cycle of the insect even through