EAGLES
J.-P. DESCY, L. ANDRÉ, C. DELVAUX, L. MONIN, S. BOUILLON, C. MORANA, A. V. BORGES, F. DARCHAMBEAU, F. ROLAND, E. VAN DE VYVER, E. VERLEYEN, C. STEIGÜBER, W. VYVERMAN, Y. CORNET, N. PONCELET, I. TOMAZIC, N. VAN LIPZIG, W. THIERY, J. GUILLARD, D. DOCQUIER, N. SOUVERIJNS, P. ISUMBISHO, P. YONGABO, L. NYINAWAMWIZA
Biodiversity - Terrestrial ecosystems
Promotors
Jean-Pierre Descy, University of Namur Luc André, Royal Museum for Central Africa
Steven Bouillon, K U Leuven Alberto Borges, University of Liège
Wim Vyverman, Ghent University Yves Cornet, University of Liège
Nicole van Lipzig, KU Leuven Jean Guillard, UMR CARRTEL France
Authors
Claire Delvaux, Royal Museum for Central Africa Laurence Monin, Royal Museum for central Africa
Cédric Morana, KU Leuven
François Darchambeau, University of Liège Fleur Roland, Univerity of Liège
Elie Verleyen, Ghent University Evelien Van de Vyver, Ghent University
Claas Steigüber, Ghent University Nadia Poncelet, University of Liège
Igor Tomazic, University of Liège Wim Thiery, KU Leuven David Docquier, KU Leuven Niels Souverijns, KU Leuven
Pascal Isumbisho, ISP-Bukavu, DR Congo Parfait Yongabo, University of Rwanda Laetitia Nyinawamwiza, University of Rwanda
(SSD)
FINAL REPORT
East African Great Lake Ecosystem Sensitivity to changes
EAGLES
Published in 2015 by the Belgian Science Policy Avenue Louise 231 Louizalaan 231 B-1050 Brussels Belgium Tel: +32 (0)2 238 34 11 – Fax: +32 (0)2 230 59 12 http://www.belspo.be
Contact person: Georges Jamart +32 (0)2 238 36 90
Neither the Belgian Science Policy nor any person acting on behalf of the Belgian Science Policy is responsible for the use which might be made of the following information. The authors are responsible for the content.
No part of this publication may be reproduced, stored in a retrieval system, or transmitted in any form or by any means, electronic, mechanical, photocopying, recording, or otherwise, without indicating the reference:
J.-P. Descy, L. André, C. Delvaux, L. Monin, S. Bouillon, C. Morana, A. V. Borges, F. Darchambeau, F. Roland, E. Van de Vyver, E. Verleyen, C. Steigüber, W. Vyverman, Y. Cornet, N. Poncelet, I. Tomazic, N. van Lipzig, W. Thiery, J. Guillard, D. Docquier, N. Souverijns, P. Isumbisho, P. Yongabo, L. Nyinawamwiza. East African Great Lake
Ecosystem Sensitivity to changes. Final Report. Brussels : Belgian Science Policy 2015 –
COORDINATOR:
P1. Jean-Pierre Descy, Laboratory of Freshwater Ecology, URBE, Department of Biology,
University of Namur, rue de Bruxelles 61, B-5000 Namur. Belgium. [email protected]
OTHER PARTNERS:
- P2. Luc André, Royal Museum for Central Africa (RMCA), Leuvensesteenweg, 13,
B-3080 Tervuren, [email protected]
- P3. Steven Bouillon, Katholieke Universiteit Leuven (KU Leuven), Department of
Earth and Environmental Sciences, Celestijnenlaan 200E, B-3001 Leuven, [email protected]
- P4. Alberto Borges, Université de Liège, Chemical Oceanography Unit, Institut de
Physique (B5a), B-4000 Liège, [email protected]
- P5. Wim Vyverman, Ghent University, Ghent University, Krijgslaan 281-S8, B-9000
Ghent, [email protected]
- P6. Yves Cornet, Geomatics Unit, University of Liège, Allée du 6 Août, 17 (B5a),
B-4000 Sart-Tilman, Belgium, [email protected]
- P7. Nicole van Lipzig, KU Leuven, Department of Earth and Environmental Sciences,
Celestijnenlaan 200E, B-3001 Leuven. Belgium. [email protected] - P8. Jean Guillard, UMR CARRTEL France, 75, avenue de Corzent, F-74203
Thonon-les-Bains cedex, [email protected]
AUTHOR(S):
Jean-Pierre Descy1, Luc André2, Claire Delvaux2, Laurence Monin2, Steven Bouillon3, Cédric Morana3, Alberto V. Borges4, François Darchambeau4, Fleur Roland4, Evelien Van de Vyver5, Elie Verleyen5, Claas Steigüber5, Wim Vyverman5, Yves Cornet6, Nadia Poncelet6, Igor Tomazic6, Nicole van Lipzig7, Wim Thiery7, Jean Guillard8, David Docquier7, Niels Souverijns7, Pascal Isumbisho9, Parfait Yongabo10, Laetitia Nyinawamwiza10
Numbers in superscript refer to partner institution (1: Coordinator, 2: Partner 2, etc), except for:
- 9: Subcontracting 1 – Pascal Isumbisho, ISP-Bukavu, DR Congo, [email protected] - 10: Subcontracting 2 – Laetitia Nyinawamwiza, College of Agriculture, Animal Sciences
and Veterinary Medicine (CAVM), University of Rwanda, [email protected]
TABLE OF CONTENT
SUMMARY ... 9
Context ... 9
Objectives ... 9
Main conclusions... 10
Output for sustainable development ... 13
Keywords ... 14
1. INTRODUCTION ... 15
1.1 Context ... 15
1.2 Objectives ... 15
1.3 Expected outcomes ... 16
2. METHODOLOGY AND RESULTS ... 19
2.1. Exploitation of existing data ... 19
2.1.1. Data base management ... 19
2.1.2 Data mining ... 19
2.1.3. Sediments ... 20
2.2. In situ studies (2011-2014) and acquisition of new data ... 20
2.2.1. Water column monitoring of physical, chemical, biological variables ... 20
2.2.1.1 Mixolimnion monitoring ... 20
2.2.1.2 Greenhouse gas distribution in the water column of Lake Kivu ... 23
2.2.1.3. Complementary measurements ... 26
2.2.1.4 Water geochemistry, Biogenic silica, incubation experiments and Silicon isotopes in the water column ... 28
2.2.1.5 Remote sensing ... 49
2.2.1.6 Fish surveys ... 60
2.2.2. Carbon pathways through the planktonic food web ... 74
2.2.2.1. Characterization of the different organic matter pools ... 74
2.2.2.2. Significant production of DOC by phytoplankton in Lake Kivu and its uptake by heterotrophic prokaryotes ... 78
2.2.3. Carbon and nutrient cycling in the redoxcline of Lake Kivu ... 78
2.2.3.1. Aerobic methanotrophy ... 79
2.2.3.2. Anaerobic methanotrophy ... 80
2.2.3.3. Chemoautotrophic and anoxygenic photoautotrophic pathways of CO2 fixation in the redoxcline of Lake Kivu ... 82
2.2.3.4. Denitrification, anaerobic ammonium oxidation and dissimilative reduction of nitrate to ammonium ... 84
2.2.3.5. The importance of methanotrophy and chemoautotrophy in the ecosystem functioning of Lake Kivu ... 86
2.2.4. Sediment core retrieval – new cores and analyses ... 87
2.2.4.1. Materials and methods... 87
2.2.4.2. Results and discussion ... 90
2.3. Laboratory studies (2011-2014) ... 99
2.3.1 Diatom cultures ... 99
2.4.2.2 Lake hydrodynamics and ecological simulations for the period 2002-2013 ... 119
2.4.3 Past changes ... 120
2.4.3.1 Past climate and ecology ... 120
2.4.4 Prediction of future changes & ecosystem responses ... 121
2.4.4.1 Climate projections ... 121
2.4.4.2 Effects of methane exploitation ... 125
3. POLICY SUPPORT ... 127
4. DISSEMINATION AND VALORISATION ... 133
5. PUBLICATIONS ... 135
5.1 Publications of the teams ... 135
5.1.1 Peer review (published and in press) ... 135
5.2 Co-publications ... 136
5.2.2 Others ... 136
6. Acknowledgements ... 141
7. References ... 143
ACRONYMS and ABREVIATIONS
AATSR Advanced Along-Track Scanning Radiometer
aer_opt Aerosol option for atmospheric correction in SeaDAS AGL: African Great Lakes
Aqua NASA Earth Observing Satellite (EOS/ PM-1) launched 2002 AVHRR Advanced Very High Resolution Radiometer
AWS: Automatic Weather Station BT Brightness temperature
chl-a Chlorophyll-a
CMIP5: Coupled Model Intercomparison Project Phase 5 CORDEX: CO-ordinated Regional Downscaling EXperiment
COSMO: COnsortium for Small-scale MOdelling numerical weather prediction model COSMO-CLM: COSMO model in CLimate mode
COSMO-CLM2: COSMO-CLM2 coupled to the Community Land Model COST733: Weather type classification software
CTL: COSMO-CLM² control simulation (reanalysis downscaling) ENVISAT ENVIronment SATellite from European Space Agency FUT: COSMO-CLM² future simulation (GCM downscaling) HIS: COSMO-CLM² historical simulation (GCM downscaling) HPLC High Performance Liquid Chromatography
K490 Diffuse Attenuation Coefficient at 490 nm wavelength LakeMIP: Lake Model Intercomparison Project
LSWT Lake Surface Water Temperature Lw Water-leaving radiance
MCSST Multi-Channels Sea Surface Temperature MODIS Moderate Resolution Imaging Spectroradiometer
MUMM Management Unit of the North Sea Mathematical Models NASA National Aeronautics and Space Administration
NIR Near Infrared
NLSST Non Linear Sea Surface Temperature
NOL: COSMO-CLM² no-lakes simulation (reanalysis downscaling) OBPG Ocean Biology Processing Group
OC Ocean Color
REE Rare Earth Elements Rrs Remote sensing reflectance RS Remote Sensing
RTM Radiative Transfer Model
SeaDAS Software suite developed by NASA for the processing visualization, analysis and quality control of ocean color data
SUMMARY Context
Large East African Rift lakes have been changing rapidly during the last decades. They typically have a relatively high productivity compared to large temperate lakes and sustain active fisheries providing local populations with a relatively cheap source of proteins. However, human-induced changes, including climate change, can have significant negative effects on primary production of these lakes, as shown for Lake Tanganyika. It is likely that these decreases in primary production have affected secondary producers and fisheries, but, before being able to predict the extent of the primary productivity changes and how they affect whole ecosystem production, an improved understanding of ecosystem function and food web processes is required.
Lake Kivu, despite its relatively small size (2370 km2) among the East African Great Lakes, is of particular interest for several reasons : on the one hand, the lake mixolimnion responds to the same atmospheric forcing as the other Rift lakes, with a relatively weak thermal stratification, so that a great sensitivity to changes in the regional climate is expected; on the other hand, the deep waters of the lake, separated from the surface by a salinity gradient, present a unique structure due to geothermal inflows, with increases of temperature and salinity by steps, and very large amounts of dissolved carbon dioxide and methane, particularly below 270 m depth. Nowadays methane harvesting appears as a means for reducing the risk of gas eruption while producing energy for the surrounding countries, but the extraction should be made in such a way as to avoid harmful consequence for the other lake resources, including fisheries. It is then relevant to complete studies on the lake ecosystem, in order to understand its present functioning and how and why it changed in the past, and to predict future changes as a result of natural changes (climatic, volcanic,…) and of anthropogenic impacts, as those which may result from large-scale methane exploitation.
Objectives
The general objective of the EAGLES project was to understand, monitor and forecast how the ecosystem of a large African lake, Lake Kivu, responds to human-induced changes, in order to predict the effects of environmental changes on the goods and services provided by the ecosystem.
The first objective, exploitation of existing data, consisted mainly in the synthesis of the data acquired in the period 2002-2010 in previous research and cooperation projects. It resulted in a database including limnological variables, plankton, fish abundance and meteorological data that allowed a very good view of the knowledge on Lake Kivu, unique for an East African great lake. In relation with this work, a synthesis of the knowledge of Lake Kivu limnology and biogeochemistry was published in a book printed by Springer in its “Aquatic Ecology Series”.
monitoring sites - Gisenyi, Rwanda) and Ishungu (DR Congo) – from 2011 to mid-2014 on a monthly basis at least. In addition, we organised six field campaigns including several Belgian and foreign teams, in July 2011, February 2012, October 2012, May 2013, September 2013, and August 2014. During these field cruises, sampling and field experiments took place in both study sites. The main activities were devoted to detailed process orientated investigations on carbon and nutrient pathways in the mixolimnion and in the chemocline, such as on the carbon pathways in the microbial food web, methane oxidation, the nitrogen cycle, complementing the monitoring of variables. Sediment core collection was also carried out, in order to allow paleolimnological studies based on several proxies, and fresh diatom algae were collected for laboratory culturing in Belgium. Also a new state-of-the-art automatic weather station was installed on an offshore platform. This objective was largely fulfilled and the data were organised into several data bases: a CTD data base and a phytoplankton pigment data base, combining the data acquired during the project with those from the previous studies, allowing investigation of the changes that have occurred in the lake mixolimnion since 2002 (Ishungu) or since 2005 (Gisenyi).
A third objective was to determine ecophysiological requirements of key diatoms isolated from Lake Kivu by conducting laboratory studies on isolated taxa in pure cultures, under conditions mimicking those prevailing in the lake (light, temperature, nutrient concentration). These cultures would also allow the study of Si isotopic fractionation by different species The final step was devoted to data processing and modeling, in order to:
• link atmospheric variability and lake physics: two-way interaction between atmospheric conditions on the one hand and lake temperature and water column structure on the other hand, aiming to understand/simulate the regional climate and variability of seasonal mixing processes, and to forecast long term changes,
• link physical processes with biological and ecological (e.g. nutrient availability) processes: diversity and biomass of plankton, fate of primary production in the planktonic food web, CH4 fluxes, fish abundance and fisheries yield,
• predict future changes of ecosystem processes and resources, as a result from fisheries management, exploitation of methane from the deep waters, and climate change (linking global climate to regional climate).
Finally, we examined how the methodologies used and developed in the research project could be applied to other large African lakes, particularly Lake Tanganyika.
Main conclusions
The exploitation of the existing data and the acquisition of new data have led to several key insights on various components and processes of the ecosystem of Lake Kivu. Among the most notable results is a general view of the carbon transfer through the food web, including the microbial food web and the estimates, on an annual basis of the main flows of organic matter. This allowed to show that:
• contrary to the assumptions made from a planktivore introduction in the pelagic zone of the lake, the efficiency of the planktonic food web is in a range comparable to that of the other East African great lakes of similar trophic status;
• the relatively low fish yield in Lake Kivu stems for a low efficiency at the zooplankton-fish interface.
The study of the ecological processes, based on experiments conducted in the field, showed that Lake Kivu is net autotrophic, which is a quite different view of the functioning of an oligotrophic lake from that presented in the current limnological literature. This conclusion may be applicable to other tropical large lakes where nutrient availability is mainly governed by internal loading. The interannual variability of phytoplankton production can be high, probably explaining variations at the consumer level, including fish. This variability is greatly influenced by the regional climate, as shown by teleconnections with indices determined in the tropical ocean. Another key result pertaining to the fate of primary production in tropical oligotrophic lakes is that a large fraction of phytoplankton production occurs as dissolved production (excretion of organic molecules) which are used by heterotrophic bacteria, thereby fuelling the microbial food web. In Lake Kivu, this fraction amounts to ~50 % of the total primary production. Complementary measurements using sediment traps allowed investigating the fate of particulate primary production: the average percentage of this production exported to the deep waters was ~8 %, with substantial variation (2.7 – 22.2 %), and all phytoplankton groups contributed to the sediment flux.
Another result, more specific to Lake Kivu, is that the emissions of CO2 and CH4 to the
atmosphere are low, despite the very large amount of dissolved CH4 and CO2 in the deep
waters. This paradox stems from the fact that microbial transformation of the CH4 diffusing
upward occurs in the oxycline. Chemoautotrophic processes are also significant in the lake’s carbon budget: notably, the nitrogen fluxes to the surface waters is largely dependent on microbial activities and in the balance between nitrification and denitrification in the oxycline. The geochemical studies in the surface and deep waters yielded several results pertaining to the mineral composition of the lake waters and to the diatom productivity and its control by phosphorus availablity. For instance, they confirmed that most of the solutes of the Lake Kivu waters are mainly controlled by the hydrothermal alteration of the volcanics along the northern shoreline, the most probable recharge source for these hydrothermal fluids being the surface water of the lake itself, locally mixed with magmatic-derived and meteoritic-derived fluids. The annual quick changes in Ba distribution and P/Na as well as the rapid
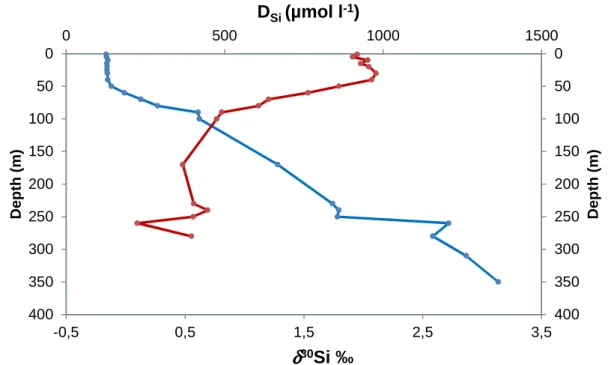
δ30Si - D
Si re-equilibration of the upper chemocline after the diatom mineralization
demonstrate that the lake water mixing is more dynamic than previously thought. The strong P limitation that controls the diatom productivity throughout the year is dependent of a “bathtub ring” oxic-anoxic precipitation at the mixolimnion-chemocline interface. The strong Si-Ba correlation and the strong Ba depletion of the surface waters when the diatom productivity was larger indicate that the Ba cycle is partly controlled by the Barite precipitation and dissolution consecutive to the decay of diatom biomass. The changes in
δ30Si vs D
Si are very sensitive to the global seasonal diatom productivity and mineralization in
Lake Kivu.
been based on a dataset from Lake Tanganyika. Several constraints (on stray light, cloudiness) had to be reduced in the filtering of the computed values; consequently, the final time series and the validation of the results were not directly representative of the in situ measurements. However, the spatio-temporal aggregation of the computed chlorophyll a values greatly reduced the effect of local highly inaccurate values. Such temporally aggregated time series can efficiently be exploited for analysis with other environmental factors, particularly to assess variations at a seasonal scale.
Similar uncertainties were encountered when determining lake water surface temperature from the MODIS products. The model was adjusted using daily data with low radiative perturbation, resulting in high uncertainty in situations of high radiative perturbation. The results from our model were affected by the same anomalies than ARC-Lake dataset, with lower spatial and temporal amplitude than the reality. However weekly aggregated time series provided results that are in the range of the in situ measurements.
The fishery survey conducted in the Rwandese part of the lake showed that Limnothrissa
miodon, the “Tanganyika sardine “remains the major species caught in the pelagic zone of
Lake Kivu, despite the recent introduction of Lamprichthys tanganicanus. If Limnothrissa and
Lamprichthys adults do compete for large zooplankton and have significant niche overlap, it
seems that Lamprichthys did not invade the pelagic zone but preferred the littoral zone. The fishery survey, together with the hydroacoustic surveys, show that seasonal variations of the catches may be related to resource-dependent variations in the sardine stock, rather than resulting from overexploitation. The fact that the catches are greatest at the beginning of the rainy season, after reduced catches in the dry season months, may result from greater abundance of large zooplankton following the phytoplankton peak, allowing growth to the young fish. Hence, the variation of the catches over the year should be seen as a natural phenomenon depending on the lake functioning, and not a result of poor fishery management. The hydroacoustic surveys, completing those conducted in 2008 and those from the “Biological baseline of Lake Kivu”, show that is little seasonal variation of the fish stock and that no significant change of the sardine stock occurred since the end of the 1980’s.
Geochemical, fossil diatom and fossil pigment analyses were carried out on sediment cores. Although there is significant uncertainty regarding the age of the sediment layers, the upper 27 cm of the cores showed that substantial changes of productivity occurred in a period of about 150 years BP, depending on changes in nutrient supply, most likely driven by changes of the stratification/mixing regime in the mixolimnion. The peaks of diatom productivity and changes in their community structure are neither triggered nor boosted by the hydrothermal activity. Between 5 and 3 cm an increase of magmatic-related elements as well as carbonate deposition is evident which is related to hydrothermal activity. Given the uncertainties on the age of these layers, it is not possible to detect a change that could be related to the introduction of the Tanganyika sardine.
Modelling lake hydrodynamics and ecology, in the present conditions (period 2002-2012) was an important component of the project. Lake hydrodynamics were simulated using the one-dimensional lake model FLake, which was extensively evaluated and tested over two African Great Lakes. Careful forcing data correction and model configuration allowed for the
correct representation of mixed layer depths and water temperatures of Lake Kivu. However, while lake surface temperature predictions are robust, bottom temperatures appear very sensitive to perturbations in the external parameters and meteorological driving data. Constraints on the applicability of the model are therefore identified: while this model is a suitable tool for lake surface temperature parameterizations in climate models, it cannot be used to study climate change influences on lake stratification and hydrodynamics. In addition, the skill of the FLake model is benchmarked against six other lake models. FLake demonstrates good predictive skill relative to the other models in terms of water column temperatures and lake enthalpy change, but its limitations in terms of representing stratification and hydrodynamics are confirmed by sensitivity experiments. Finally, a process study established the primary control of dry-season evaporative-driven cooling on seasonal mixed layer dynamics.
Evaluation of the COSMO-CLM2 regional climate model simulation with optimized configuration reveals good performance compared to both in situ and satellite observations, notably for lake surface temperatures and precipitation. Comparison to a no-lakes simulation indicates that the four major African Great Lakes nearly double the annual precipitation amounts over their surface, but hardly exert any influence on precipitation beyond their shores. Most of the lakes also cool the annual mean near-surface air, this time with pronounced downwind influence. The lake-induced cooling happens during daytime, when the lakes absorb incoming solar radiation and inhibit upward turbulent heat transport. At night, when this heat is released, the lakes warm the near-surface air. The comparison also reveals the profound lake influence on atmospheric dynamics and stability: the example of Lake Victoria shows how lakes induce circular airflow with over-lake convective inhibition during daytime, and the reversed pattern at night.
The coupled one-dimensional hydrodynamic-ecosystem model DYRESM–CAEDYM was used as a platform for developing ecological and biogeochemical modeling of Lake Kivu ecosystem. The model reproduced the seasonal stratification of the mixolimnion in the lake during the period 2002-2013 and the seasonal nutrient upwelling, as well as the seasonal alternation between cyanobacteria and diatoms. Simulations of the operation of a methane power plant were also carried out: it showed that the oxic layer of the lake would be reduced, as result of a substantial increase of chlorophyll a, and that a shift phytoplankton composition would occur.
Output for sustainable development
The first key output of EAGLES is relevant to the lake’s monitoring and management in a context of environmental changes driven by climate change and aquatic resources exploitation. We provide a compilation of data (prior and from the project) and insight on the status of the lake ecosystem, that is developed in the top 60 m of the water column.
account those natural, climate-related, variations, by adapting the fishing effort to the fish production that could be predicted from monitoring the planktonic resources. Therefore we recommend to conduct fisheries surveys over the whole lake, in parallel with periodic hydroacoustic surveys. Moreover, as effects from variations of climate-driven plankton productivity are expected, the data from the fish surveys should be examined together with the data on weather, limnology and plankton. Such analyses could be useful to achieve predictions of the fish yield and for regulating the sardine fishery in order to ensure its sustainability.
In addition to variations of the lake’s productivity related to climate variability, an impact of the large-scale methane exploitation is expected, as demonstrated by model simulations, with severe alteration of water quality and ecosystem status. Therefore, we recommend to carry out long-term monitoring of limnological and planktological variables around the power plants and at reference lake sites.
Remote sensing (RS) can also be recommended for monitoring future changes affecting seasonal cycles and trends. Aggregated time series (weekly for the whole lake) of ocean color (providing estimates of surface chlorophyll a) and LSWT (allowing estimates of the surface temperature of the lake) clearly show the seasonal cycles. Therefore, RS could be used for assessing long term trends under several conditions.
The strong imprint of the lakes on the hydrological cycle additionally highlights the vulnerability of local communities to lake-induced precipitation and storm activity. On the short term, we therefore recommend the installation of early warning systems for over-lake thunderstorms (or their improvement at locations where they are already present). This may, for instance, be achieved through operational numerical weather prediction systems capable of accounting for the relevant lake-atmosphere interactions. Such prediction systems should moreover operate at sufficiently high resolution to resolve the relevant mesoscale atmospheric processes. Insights from our analyses may thereby provide useful information for improving the skill of these predictions systems.
The climate model projections for the end-of-the-century underline the major role for Lake Victoria in modulating precipitation changes. Under a high-emission scenario (RCP8.5), over-lake extreme precipitation may intensify up to three times faster towards 2071-2100 relative to 1981-2010 compared to the projected change over the surrounding land (after isolation from the mean change). In the context of climate change and lake-induced weather hazards, we therefore strongly recommend the development of climate change adaptation strategies in the African Great Lakes region, in particular measures aiming at enhanced navigation safety for the fishermen operating on their surface.
For defining adaptation measures aiming at conserving present-day ecosystem functioning in the context of climate change (and methane exploitation in the case of Lake Kivu), rigorous testing through model simulations and case studies is required before any implementation can be considered.
Keywords
1. INTRODUCTION
1.1 Context
Large East African Rift lakes have been changing rapidly during the last decades. They typically have a relatively high productivity compared to large temperate lakes and have active fisheries providing local populations with a relatively cheap source of proteins. However, human-induced changes, including climate change, can have significant negative effects on primary production of these lakes, as shown for Lake Tanganyika (Verburg et al., 2003 ; Stenuite et al., 2007 ; Tierney et al., 2010). It is likely that these decreases in primary production have affected secondary producers and fisheries, but, before being able to predict the extent of the primary productivity changes and how they affect whole ecosystem production, an improved understanding of ecosystem function and food web processes is required.
Lake Kivu, despite its relatively small size (2370 km2) among the East African Great Lakes, is of particular interest for several reasons : on the one hand, the lake mixolimnion responds to the same atmospheric forcing as the other Rift lakes (e.g. Sarmento et al., 2006), with a relatively weak thermal stratification (Spigel and Coulter, 1996), so that a great sensitivity to changes in the regional climate is expected; on the other hand, the deep waters of the lake, separated from the surface by a salinity gradient, present a unique structure due to geothermal inflows, with increases of temperature and salinity by steps, and very large amounts of dissolved carbon dioxide and methane, particularly below 270 m depth (see Schmid and Wuëst, 2012). Nowadays methane harvesting appears as a means for reducing the risk of gas eruption while producing energy for the surrounding countries (e.g. Nayar, 2009), but the extraction should be made in such a way as to avoid harmful consequence for the other lake resources, including the fishery (Wüest et al. 2012). All this makes it even more relevant to complete studies on the lake ecosystem, in order to understand its functioning and how and why it changed in the past, and to predict future changes as a result of climate change and other anthropogenic impacts, as those which may result from large-scale methane exploitation.
1.2 Objectives
The general objective of the EAGLES project is to understand, monitor and forecast how the ecosystem of a large African lake, Lake Kivu, responds to human-induced changes, in order to predict the effects of environmental changes on the goods and services provided by the ecosystem.
hydroacoustics, meteorological data and sediment archives (biogeochemical and biological proxies).
Data time series have been extended by new datasets of the same variables acquired during the period of the project (2011 – mid 2014) (WP2). New in situ studies were also conducted in order to increase our present understanding of ecosystem biodiversity and functioning (WP2). This part of the project includes monitoring of the mixolimnion by regular sampling and measurements, field experiments for determining the carbon and nutrient pathways within the planktonic food web, studies of past and present plankton productivity using, respectively, sediment and water column proxies, and surveys of fish stocks and of fisheries yield.
Laboratory studies (WP3) have been undertaken to determine ecophysiological requirements of key diatoms isolated from Lake Kivu and for studying Si isotopic fractionation by different species under conditions mimicking those prevailing in the lake (light, temperature, nutrient concentration).
The final step was devoted to data processing and modeling (WP4), in order to:
• link atmospheric forcing and the lake physics: relation between atmospheric conditions and lake temperature and water column structure, aiming to understand/simulate the variability of seasonal mixing processes and forecast long term changes,
• link physical processes with biological and ecological (e.g. nutrient availability) processes: diversity and biomass of plankton, fate of primary production in the planktonic food web, fish abundance and fisheries yield,
• predict future changes of ecosystem processes and resources, as a result from fisheries management, exploitation of methane from the deep waters, and climate change (linking global climate to regional climate).
Finally, we examined how the methodologies used and developed in the research project could be applied to other large African lakes, particularly Lake Tanganyika.
The objectives of WP5 (Network coordination and dissemination) were 1) to organise the general project planning and the coordination among the various work packages, 2) to establish contacts with other relevant national and international programs, 3) to ensure data and information exchange among the partners and other national and international scientific communities, and 4) to valorise and disseminate the project outputs.
1.3 Expected outcomes
- Historical databases (acquired by some partners on other projects and from data mining/rescue) on water column and sediment chemistry and biology
- New datasets and databases on chemistry and biology of the water column and sediments, including paleo-reconstructions
- Remote sensing reconstructed time series (surface temperature, Chla and K490 raw) - Statistics on fish stocks and fisheries (2011 to 2013)
- Coupled hydrodynamic-ecosystem Kivu model on present day functioning and analysis of future impacts (climate change, CH4 extraction)
- Advice for sustainable management of fisheries and CH4 extraction in L. Kivu
2. METHODOLOGY AND RESULTS
2.1. EXPLOITATION OF EXISTING DATA 2.1.1. Data base management
The Lake Kivu EAGLES database has been created and uploaded to the main EAGLES web site (http://www.eagles-kivu.be). It presently contains the following items:
• The EAGLES logo
• The original proposal (i.e. the full text of the project)
• The presentations of the different partners at the first African and European follow-up committees organized at Kigali in July 2011 and at BELSPO office in Dec 2011 and March 2013
• All data (vertical CTD casts and measurements on samples from different depths) from the monitoring at the two sites sampled by the African subcontractants, as well as of the six field campaigns of the Belgian network (July 2011, January 2012, September-October 2012, May 2013, August-September 2013, and July-August 2014)
• All data on vertical profiles from previous Belgian projects (CAKI, supported by FNRS, and ECOSYKI project, supported by CUD)
• All data on phytoplankton biomass and composition as determined from the analysis of marker pigments by HPLC, from 2002 to 2010, to which the data collected till mid-2014 were subsequently added
• A collection of “grey literature” (MSc and PhD theses and reports from students who participated in studies on Lake Kivu)
• A collection of published papers by members of the EAGLES teams All data were checked for units, headings and major errors (quality check level 1).
2.1.2 Data mining
Data and metadata from 5 previous field campaigns (CAKI project, 2007-2010) were compiled and were made available from the project web page with a restricted access (1.1). These data include CTD casts and biogeochemical data, as well as data on fish stocks from two hydroacoustic campaigns carried out in 2008. The restricted page also provides pdfs of available grey literature documents (PhD thesis and Master thesis), and previous publications on Lake Kivu from members of the EAGLES consortium. Meteorological data in the Lake Kivu area were compiled from the Rwanda meteorological agency, the ISP-Bukavu weather station and weather stations from RMCA.
The gathering of the existing data in the database has allowed a synthesis on various components and processes of the ecosystem of Lake Kivu. Whenever needed, statistical
2014) as well as the edition as a peer-reviewed book of a synthesis on the limnology and biogeochemistry of the lake (Descy et al. 2012).
2.1.3. Sediments
The dataset obtained from a previous paleolimnological analysis of a 40-cm sediment core (Knops 2009) has been stored in the Kivu database. The data include the relative abundance of diatom taxa, pigment concentrations (Chla and derivatives from in situ degradation, carotenoids, bacteriochlorophylls), concentrations of organic matter, carbonates, total nitrogen and phosphorus concentrations, and fossil invertebrate remains.
2.2. IN SITU STUDIES (2011-2014) AND ACQUISITION OF NEW DATA 2.2.1. Water column monitoring of physical, chemical, biological variables
2.2.1.1 Mixolimnion monitoring
The monitoring of the water column has been carried out on a monthly or fortnightly basis in the Ishungu basin (28.9775°E, 2.3374°S; RD Congo) and in the main basin off Gisenyi (29.23745°E, 1.72504°S; Rwanda), the two monitoring sites located respectively in the southern and northern part of the lake. The main limnological variables have been recorded by vertical CTD profiles, and samples for phytoplankton pigments analysis were collected every 5 m from 0 to 20 m, and every 10 m from 20 to 60 m. In the regular monitoring performed by the local subcontractors, sampling for nutrient analysis has been limited to one fixed mixolimnion depth (10 m), whereas detailed nutrient profiles have been obtained during the field campaigns of the Belgian network. For the analysis of phytoplankton pigments, the techniques have been described in Sarmento et al. (2007). HPLC analysis allows to obtain an estimate of total phytoplankton biomass (chlorophyll a concentration) with a great precision, as well as the concentrations of specific marker pigment (chlorophylls other than chlorophyll a and carotenoids), which allow an estimate of the biomass of major phytoplankton groups. The CHEMTAX software (Mackey et al., 1996) was used to process the pigment data and to calculate the contribution of these groups (phyla or classes) to chlorophyll a, following a procedure described in Sarmento et al. (2007).
The results from the analyses of the samples collected in 2011 and 2014 have been stored in the EAGLES database. The database includes limnological data (CTD casts, concentrations of nutrient and dissolved gases), biological data (phytoplankton biomass and composition at the class level, zooplankton biomass, ...), and ecological (primary production, CH4 oxidation
rates, ...) and biogeochemical (δ13C-DIC, δ13C-POC, ...) variables.
The CTD vertical profiles acquired during the project at the two sites allow to assess the physical status of the water column, depending mainly on the seasonal cycle. Figure 1 provides an example extracted from the data base, showing how temperature and oxygenation changed in the water column between the rainy season (March) and the dry season (August). In the rainy season, the water at the top of the mixolimnion was warmer and less dense, which created a stratification affecting the distribution of dissolved substances (oxygen, nutrients). As shown in fig. 1, the oxic layer was reduced to the top 30
m (or less) in the rainy season (blue line), as vertical mixing was reduced to this top layer. The conditions changed dramatically in the dry season: as a result of cooling of the top surface layers, the density difference between the surface and deep layers of the mixolimnion disappeared, allowing deeper vertical mixing that enabled re-oxygenation down to 50 m or deeper. The deeper mixing also affected nutrient and plankton distribution, as well as the biogeochemical cycles (see 2.1.2, 2.2 and 2.3). Seasonal variations of conductivity and pH were relatively limited compared to temperature and oxygen, but varied vertically within the chemocline, creating contrasting conditions for the microbial communities involved in the biogeochemical cycles (see below).
Fig. 1. Examples of vertical profiles of limnological variables, extracted from the CTD data base. Top left: water temperature; top right: dissolved oxygen; bottom left: specific conductivity at 25°C; bottom right: pH. Red line: dry season conditions; blue line: rainy season conditions. Note the change in oxycline position between rainy and dry seasons.
Fig. 2: Example of a variable stored in the EAGLES database. (A) Areal phytoplankton biomass (mg chlorophyll a m-2) and (B) vertical distribution of phytoplankton biomass (mg chlorophyll a m-3) in the Ishungu basin from 2002 to 2014
Phytoplankton composition also exhibited seasonal and interannual variations during the study period, as described in Sarmento et al (2012), but remarkable changes occurred in the lake sonce the beginning of 2012, as shown in fig. 3. Cyanobacteria had a median biomass near 40 mg m-2 in the north basin of the lake in the period 2005-2008 (Sarmento et al., 2012), which was reduced to 16 mg m-2 in the period 2012-2014. Their seasonal variation was also reduced. By contrast, an important increase of green algae has occurred in recent years, as illustrated in fig. 3. Microscope examination allowed identification of these green algae as
desmids that were present before in the lake (Cosmarium laeve, considered as rare in the lake by Sarmento et al., 2007). These are relatively large, non-motile cells, which need turbulence to remain in suspension: accordingly, they tended to increase in the dry season, like diatoms.
Fig. 3. Relative contribution of the phytoplankton groups to chlorophyll a in the north basin of Lake Kivu, averaged for the period 2005-2011 (top) and for the 2012-2014 period.
2.2.1.2 Greenhouse gas distribution in the water column of Lake Kivu
The monitoring of Lake Kivu was performed in the Southern Basin, at the station of Ishungu (-2.3374 °N, 28.9775 °E), from February 2012 to October 2013. As mentioned above (see 2.1.1) Analysis of the vertical and seasonal variability of temperature and dissolved O2 concentrations allows to divide the annual cycle into two distinct limnological
periods. Rainy season conditions resulted in a thermal stratification within the mixolimnion (October-June) while the dry season was characterized by deeper vertical mixing of the water column down to the upper part of the permanent chemocline at 65 m (July-September) (Fig. 4). The vertical position of the oxycline varied seasonally: the oxic-anoxic transition reached its deepest point (65 m) during the dry season, then became gradually shallower after the re-establishment of the thermal stratification within the mixolimnion at the start of the following rainy season to finally stabilize at approximately 35m, corresponding to the bottom
Figure 4: Dissolved O2 concentrations (µmol L -1
; a), temperature (°C; b) and log CH4 concentrations
(nmol L-1; c) along the vertical profile from February 2012 to October 2013, at the station of Ishungu (South Basin).
The temporal variability of the vertical distribution of CH4 corresponded well with the
seasonal variation of the oxycline. The CH4 concentrations were very high in the
monimolimnion throughout the year (maximum of ~500 µmol L-1) but sharply decreased at the oxic-anoxic transition, to reach on average 62 nmol L-1 in surface waters.
F M A M J J A S O N D J F M A M J J A S O -70 -60 -50 -40 -30 -20 -10 0 22.6 23 23.4 23.8 24.2 24.6 25 25.4 25.8 -70 -60 -50 -40 -30 -20 -10 0 0.5 1 1.5 2 2.5 3 3.5 4 4.5 5 5.5 6 6.5 D e p th ( m ) D e p th ( m ) O 2 (µ m o l L -1 ) T e m p e ra tu re ( °C ) lo g C H 4 (n m o l L -1 ) D e p th ( m ) Months -70 -60 -50 -40 -30 -20 -10 0 0 50 100 150 200 250
Figure 5: CH4 concentrations at
5 m (nmol L-1) and SSI (a), CH4
fluxes (µmol m-2 d-1; b), wind speed (m s-1; c) and N2O fluxes
(µmol m-2 d-1; d) from February 2012 to October 2013, at the station of Ishungu (South Basin)
CH4 concentrations at 5 m perfectly followed the Schmidt Stability Index (SSI) seasonal cycle
(Fig. 5a), which illustrates the direct influence of the water column stratification on the C dynamics. This suggests that more CH4 diffuses to surface waters when anoxic waters, rich
in CH4, are closest to surface waters (high SSI, i.e. rainy season). Linked to this, CH4 fluxes
to the atmosphere (calculated based on wind speed and CH4 concentrations) were higher during the rainy season (Fig. 5b), especially in late rainy season, where higher wind speeds (Fig. 5c) were observed, due to the accentuation of the turbulence. However, in August and
C H4 a t 5 m ( n m o l L -1 ) 0 20 40 60 80 100 120 S c h m id t S ta b ili ty I n d e x ( J ) 0 200 400 600 800 1000 1200 CH4 SSI C H4 f lu x e s ( µ m o l m -2 d -1 ) 0 50 100 150 200 250 F M M J J A S O N D J F M A M J J A S O W in d s p e e d ( m s -1) 3 4 5 6 7 8 9 NCEP ISP A a b c Months N2 O f lu x e s ( µ m o l m -2 d -1 ) -3 -2 -1 0 1 2 3 4 d
cannot reach surface waters. This may be due to the occurrence of CH4 oxidation (see
section "2.3.1 Aerobic methanotrophy" below). Lake Kivu is a source of CH4 to the
atmosphere throughout the year, but the net flux is small compared with literature data from other lakes globally, despite its exceptionally high CH4 content in deep waters. Concerning
N2O fluxes (Fig. 5d), it seems that Lake Kivu alternates between a source and a sink for
atmospheric N2O. N2O can be produced by both nitrification and denitrification. Nitrification is
a source of N2O, while denitrification is usually a sink but can acts as a source in presence of
O2 at low concentrations. Denitrification rates have been quantified during different field
campaigns (see 2.2.3.5).
2.2.1.3. Complementary measurements
Six scientific field campaigns took place, including several teams of the Belgian network, as well as, on some instances, international scientists, from June-July 2011 August-September 2014.
Sediment trap deployment:
Sediment traps were installed during the third field campaign, in September 2012. The traps were deployed at 90 m depth from floating platforms till September 2014 in two sites in the main basin: off Gisenyi (1.0742°S, 29.2260°E) and off Kibuye (2.0972°S, 29.2028°E). Retrieval of collected material was performed on a monthly basis by the local Rwandese subcontractor. Analysed variables in the sediment trap material were phytoplankton pigments, POC, TN and TP content. In order to prevent organic matter degradation within the traps, their bottom was gently filled with a saline solution added with mercury chloride, to inhibit microbial activity. At trap retrieval, the particulate matter accumulated was collected and resuspended in a known water volume (usually 400 ml). At return to the local laboratory, the suspension was filtered on pre-combusted glass-fiber filters, dried and weighed. Further analyses were carried out in Belgium at UNamur (HPLC pigment analyses) and at KUL (PIC: particulate inorganic carbon; POC: particulate organic carbon; PON: particulate organic nitrogen; POP: particulate organic phosporus). Those analyses allowed to estimate the downward fluxes (as daily rates per square meter) of inorganic and organic carbon, nutrients, phytoplankton (as chlorophyll a), and the contribution of the main phytoplankton groups to sedimentation. Finally, a calculation of primary production in the water column based on chlorophyll a concentration, light penetration and average photosynthetic parameters (see Darchambeau et al., 2014) allowed the estimate of the “export ratio”, which is the ratio POC sedimentation rate : daily C fixation by photosynthesis..
Considering the data from both sites, the total sedimentation rate varied between 213 and 3911 mg DW m-2 d-1, with an average of 683 mg DW m-2 d-1, which compares well to the estimate of 786 mg DW m-2 d-1 at Ishungu in 2007 (Pasche et al., 2010). The wide range of variation depended largely on a single PIC sedimentation peak in March-April 2013 (Fig. 6), corresponding to an event of calcium carbonate precipitation. The POC sedimentation varied by a factor of ~5 at both sites and tended to be higher in the rainy season than in the dry season. The mean value was 63 mg C m-2 d-1, i.e. lower than that estimated by Pasche et al. (2010) at Ishungu (113 mg C m-2 d-1). Phytoplankton production followed a typical seasonal pattern with maxima in the dry season, particularly in 2014. The export ratio also followed a
seasonal pattern, logically related to that of POC sedimentation rate, with maxima in the rainy season (up to 22.2 %) and minima (up to 2.7 %) in the dry season. The mean export ratio for both sites is 8.1 %, indicating that most of the organic carbon resulting from phytoplankton particulate production was recycled in the mixolimnion.
Fig. 6. Variations of the sedimentation rate of particulate organic matter (POC) and of particulate inorganic matter (PIC) in Lake Kivu at both sites during the monitoring period. The frames indicate the dry season in 2013 and 2014.
As sedimenting POC is essentially composed of settling phytoplankton, it is expected that chlorophyll a followed a pattern similar to that of POC. However, chlorophyll a sedimentation rates were weakly related to that of POC, as a result of degradation processes occurring in the water column during sedimentation. The proportion of chlorophyll a degradation products (phaeophytins a and phaeophorbides a) in the trap material varied widely over time: this indicates that the chlorophyll a degradation processes varied greatly and did not follow a clear pattern. The data for the main carotenoid pigments, markers of the phytoplankton classes, were well correlated to chlorophyll a, indicating the contribution of diatoms, green algae, cyanobacteria and cryptophytes to sedimenting phytoplankton, as expected from the abundance of these classes in the water column.
The elemental ratios (C:N and C:P) obtained from PON and POP measurements in the trap material are shown in fig. 7. C:N and C:P ratios of Kibuye site were significantly higher than
column and to the development of the microbial plate in the redoxcline. We still know very little about the community ecology of this microbial plate and this should be the focus of future research (Llirós et al. 2012).
Fig. 7. Variation of the elemental ratios in the particulate matter collected the sediment traps deployed in Lake Kivu at both sites in 2012-2014..
2.2.1.4 Water geochemistry, Biogenic silica, incubation experiments and Silicon isotopes in the water column
The Silicon (Si) budget within those water layers has been long recognized to be influenced by uptake and mineralization of diatoms and inputs through subaquatic springs (e.g. Pasche et al., 2009, and references therein), but the intensity and origin of these fluxes remain poorly known. Vertical profiles of biogenic silica (BSi), dissolved silicon (DSi) and Si isotopic
composition (δ30Si) were therefore determined in three locations in order to (1) quantify the
diatom uptake in the mixolimnion and the diatom mineralization in the intermediate water mass; (2) investigate the composition and origin of the intermediate and deep water inflows linked to the subaquatic springs. The vertical distribution of conservative cations (Na+, K+), nutrient (P), and cations sensitive to precipitation dissolution (Mg2+, S, Ca2+, Mn, Sr2+, Ba2+, REE3+) was used as reference to constrain the source and mineralization processes. Several
incubation experiments were performed on the three sites to quantify the diatom production and dissolution rates.
The water profilings were carried out at the closure (September 18 – October 16 and August 20-September 6) of the dry season in 2012 and 2013 respectively to capture the end of the diatom productivity in response to the lake oscillation between the dry (May-September) and the rainy season (October-April) when deeper mixing supply the nutrients from the monimolimnion. They were focused on:
(a) a restricted basin (The Kabuno Bay, 48km2) which is shallower (maximum depth: 110 m) and isolated from the main deep Kivu Basin (2322km2) by a narrow shallow (~10m deep) connection. This location was chosen because there seems to be characterized by a much larger contribution of internal geothermal and meteoric water inputs to the whole water column than the main basin (Borges et al., 2011).
(b) At Ishungu and Gisenyi to compare the southern and northern parts of the main basin.
Methodology
At Kabuno, the sampling (down to 65 m in 2012 and 100 m in 2013) was mostly concentrated in the first 12 m to cross the very stable oxycline at about 10.5 m. At Ishungu, the profiling range from 0 to 100 m depth to look after the Si fluxes between the mixolimnion and the upper chemocline (every 5 m between the surface and 30 m depth, and every 10 m deeper). Off Gisenyi, the 5 major water masses were sampled continuously in 2013 from 0 to 350 m (every 5 meters between the surface and 30 m depth, and every 10 m deeper). In 2012, the sampling was continuous from 0 to 100 m, but discontinuous deeper with 7 stations (170, 230, 240, 250, 280, 310, 350 m).
A each depth, 155 ml of water were sampled. A water sample (125 ml) was immediately filtered through 0.2 µm PES membrane to separate the biogenic silica (BSi) from the
dissolved silica (DSi). The membranes were dried and the filtrates were stored in
polypropylene bottles. These samples will be used later for (i) natural biogenic and dissolved silicon isotopic composition and (ii) major cations analysis. Another water sample (30 ml) was stored unfiltered in polypropylene bottles and 70 µl of HNO3 were added. These
samples will be used later for trace element analyses.
For each depth within the mixolimnion another 500ml sample aliquot was stored in polycarbonate bottle and was spiked with 30Si in the form of Na2SiO3 solution, in a proportion
usually minimum 15% of the ambient DSi concentration. This minimized the perturbation on
the natural DSi contents and provided sufficient sensitivity for the isotopic measurement
(Fripiat et al. 2009). After the 30Si spiking and mixing, we realized an in-situ incubation: each labeled bottles was attached along a rope at its specific depth and then put in the lake for a 24h-period. At the end of the incubation period, the samples were filtered. The membranes were dried and the filtrates were stored in the polycarbonate bottles for further isotope dilution analyses.
Major cations, Dissolved silica (DSi) and Rare Earths (REE)
The concentrations of major cations and DSi were measured by inductively coupled plasma
optical emission spectrometry (ICP-AES). REE and Y concentrations were analysed by HR-ICP-MS (Element 2) in low-resolution mode with indium (In) as internal standard. Detection limits were about 25ppt for La, Ce and Nd, 5ppt for Pr, Sm, Gd, 3ppt for Eu, Dy and 1ppt for Ho, Er, Yb. Specific BaO interference on Eu and PrO and CeOH interferences on Gd were corrected based on the percentage of U oxides. When the Ba contents was too high (>2 µmol l-1), the Eu concentrations could not be accurately determined due to a too large BaO interference which significantly increase the detection limit. Typical accuracy is better than 5% for Y, Ba, La, Ce, Pr, Gd, Tb, Dy, Ho, Er, and Yb and below 10% for Nd, Eu, Sm and Lu. Normalized Ce and Eu anomalies were calculated as: Ce/Ce*=(La*Pr)1/2 ; Eu/Eu*=(Sm*Gd)1/2.
Silicon isotopic composition (δ30Si)
The water samples were first treated by photoozonolysis following the method described in Hughes et al. (2011) to mineralize the dissolved organic matter. Cation exchange resins (BioRad’s DOWEX 50W-X12) were then used to remove cations from sample solutions. Si isotopes were measured with a Nu Plasma MC-ICPMS (Nu Instruments) at the Université Libre de Bruxelles, operating in dry plasma mode with a Cetac Aridus II desolvating nebulization system. The mass bias was corrected through external Mg doping (Cardinal et al., 2003), and the long-term instrumental drift was corrected with the sample standard bracketing technique relative to the NBS28 silica sand standard (National Institute of Standards and Technology, RM #8546) or an equivalent in-house standard (Pro Analysis Quartz from Merck). All results presented in this study are reported relative to NBS28 following:
It was recently shown that anionic species, which are not removed by the cation exchange resin, could cause significant matrix effects (Hughes et al., 2011). In order to solve this issue, both samples and bracketing standards were doped with acids in large excess compared to the naturally occurring anion concentrations thereby hiding any natural variations of the anion matrix following the method of Hughes et al. (2011). The isobaric interference of 14N16O on the 30Si peak is resolved by using the pseudo-high resolution that consists of measuring on the low mass side of the peak, which is free of interference (Abraham et al., 2008). All replicates are total procedural replicates. The accuracy of the δ 30Si measurements was checked on a daily basis by measuring a diatomite reference material of known isotope composition. The long-term average analytical reproducibility and accuracy on this reference material for δ 30Si were of ±0.141 (±2rSD, n = 11). All results of the Si isotope measurements are in agreement with a mass dependent equilibrium fractionation line (δ 30Si = 1.93 δ 29Si).
1000 * 1 standard Si 28 Si 30 sample Si 28 Si 30 Si 30 δ −−−− ====
Biogenic silica (BSi)
The difficulty of the BSi measurement resides not only in the extraction efficiency of BSi, but
also in the correction for the dissolution of co-existing aluminosilicates (AlSi). In order to solve
this issue, we measured BSi and correction for AlSi interference following the method of
Ragueneau et al (2005). It consists of a double wet-alkaline digestion where the filter sample is submitted to a first digestion (0.2 M NaOH, pH 13.3) at 100°C for 40 min. At the end of this first leach, all the BSi and part of the AlSi have been converted into Si(OH)4. Si and Al
concentrations ([Si]1 and [Al]1) in the supernatant are analyzed. After rinsing and drying, the
filter is submitted to a second digestion, exactly identical to the first one, leading to the determination of the (Si:Al)2 ratio that is characteristic of the silicate minerals present in the
sample. A third digestion step was added to the original method to verify that no BSi was left
after the secpnd leach. The corrected biogenic silica concentration is thus given by [BSi]=[Si]1-[Al]1(Si:Al)2.
Incubation experiments
Measurements of BSi production and dissolution rates were determined to better understand
the Si cycle. The change in isotopic composition of the biogenic silica is used to estimate the production rate by measuring the enrichment in 30Si of the particulate phase. The dissolution rates were measured through the increase in 28Si in the dissolved phase due to the dissolution of initial biogenic silica. We followed the method of Fripiat et al (2009) for the simultaneous determination of the rates of production and dissolution of biogenic silica, using the 30Si-isotopic dilution technique with a high-resolution sector field inductively coupled plasma mass spectrometer (HR-SF-ICP-MS). Relative analytical precision of the isotopic measurement is better than 1%. To calculate the flux rates (production and dissolution of biogenic silica, respectively, ρP and ρD) we use the linear one-compartment model described
for production and dissolution (Cf. Fripiat et al., 2009). Measurements of real Si production rates were determined with an average relative precision of 10%. Due to the very high DSi
(especially in Kabuno), the ratio between the dissolved silicon and the added spike was inadequate and the estimates of the BSi dissolution rates were frequently below the detection
limit.
Results
Dissolved Cations (Na+, K+, P, Mg2+, S, Ca2+, Mn, Sr2+, Ba2+)
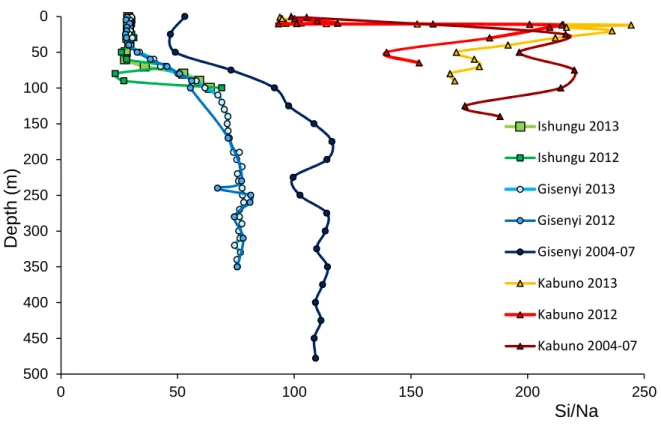
The main basin is chemically stratified, with 6 stepwise levels of concentrations for Na, Mg, K, Ca, Sr, P in agreement with previous studies (e.g. Schmid et al., 2005; Tassi et al., 2009; Pasche et al., 2009). In particular, our K+ data for Kisenyi [2012: 2.1-8.1 µmol l-1 ; 2013:2.0-8.0 µmol l-1] fits very well with those of Tassi et al. 2009 [2.1-8.3µmol l-1]. The very stable Na/K molar ratio (2.09-2.27), at all depths, in 2012 and 2013, and at both locations of the main basin (Ishungu and Gisenyi) points to vertical concentration patterns driven by subaquatic springs inputs issued from similar sources with physical mixing at low depths and dilution by surface runoff.
subaquatic springs could be slightly lower than that of the deep subaquatic springs. This difference between surface and deep waters was also observed in the 2004-07 sampling by Tassi et al. (2009), which recorded more scattered Na/K and Na/Mg molar ratios than ours in both Gisenyi and Ishungu, essentially due to larger contents in Na [2012: 4.5-18.0 mmol l-1 ; 2013:4.2-17.8mmol l-1; Tassi et al.: 4.7-20.4 mmol l-1]. These small but significant time-related changes in the Na/K and Na/Mg suggest that despite its permanent stratification, the lake is chemically dynamic on a relatively short term decadal basis.
A strong difference of cation sources between the Kabuno Bay is and the main Basin is very well illustrated in the Na/Mg versus Na/K with deep Kabuno water displaying low Na/Mg (<0.8) and Na/K (<1.7) compare to the Gisenyi and Ishungu Basins (Na/Mg>1.4; Na/K>2.05). With intermediate values (Na/Mg~1.2; Na/K~1.77), the 2013 surface water from the Kabuno Bay (<12m) is a mixture in roughly equal proportions between the deep Kabuno water layers and waters with chemical features very similar to those found in the surface of the main basin. In 2012, a similar picture was observed even if the proportion of the Kabuno deep water in the mixture was a bit larger.
Figure 8. Sr vs Ca behavior at Gisenyi, Ishungu and Kabuno (the 2004-07 data are from Tassi et al., 2009).
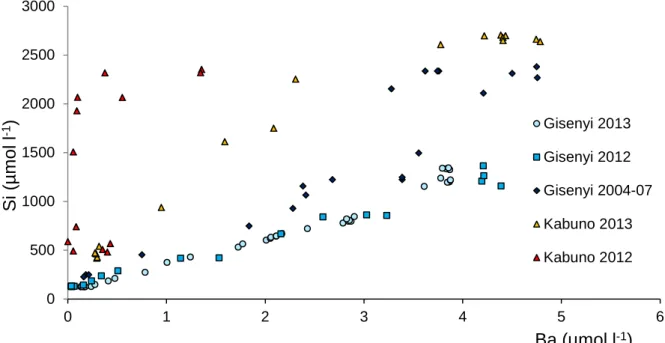
Ba does show most of the stepwise levels except the last two ones, the Ba content being stable at 3.85 µmol l-1 below 260 m. The 2012 Ba profiles from the 3 localities differ from the 2013’s ones by their much lower Ba contents in the mixolimnion (In Gisenyi: 0.036-0.066 µmol l-1 vs 0.14-0.24 µmol l-1, respectively) and their higher Ba contents in the deepest layers (In Gisenyi: 4.19-4.39 µmol l-1 vs 3.80-3.87 µmol l-1, respectively).
0 10 20 30 40 50 60 70 80 0 1 2 3 4 S r µ m o l l -1 Ca mmol l-1 Kabuno 2013 Kabuno 2012 Kabuno 2004-07 Ishungu 2013 Ishungu 2012 Gisenyi 2013 Gisenyi 2012 Gisenyi 2004-07 Sr/Ca=60 Sr/Ca=30 Sr/Ca=20 Sr/Ca=10
In the main basin, Sr, whose geochemical behavior is intimately associated with Ca-bearing minerals, shows a strong positive correlation with Ca (Figure 8) because CaCO3 precipitation
at the surface and its dissolution in the deepest strata control both element contents. The slight decoupling between Sr and Ca with depth (increase in Sr/Ca from 8 to 20, Figure 8) cannot be attributed to the carbonate dissolution in the deepest parts because all carbonates present higher mineral-water partition coefficient for Ca than Sr (DSr<DCa). In the Kabuno
Bay, these two cations are even more strongly decoupled below the mixolimnion (Sr/Ca>20, Figure 8) in accordance with the difference of cation source between the Kabuno deep water and the main basin waters.
The high N:P ratio in Lake Kivu compared to Lake Malawi and Tanganyika indicates that phytoplankton suffers of a strong P limitation throughout the year (Pasche et al., 2009; Darchambeau et al., 2014). So it is interesting to have a look to the P data normalized to a conservative cation like Na (Figure 9) to get rid of most of the variability linked to the long-term cation accumulation in the water column in order to accurately evaluate the recent change in P availability and remineralisation.
Figure 9. Depth profiling of the P/Na molar ratio in Lake Kivu.
At Gisenyi on a decadal perspective, the P/Na significantly fluctuates especially in the upper chemocline and the deepest reservoirs, showing that the P reservoir has dynamically changed through time. Likewise, in Kabuno, the P/Na profiles strongly differ from one year to another. In 2004-07, there is a relative P enrichment at the surface with depletions in depth. In 2012, P is quite depleted relative to Na at all depths. The 2013 profile contrasts strongly with the two previous ones since P/Na quickly growth below 12 m, showing that a high P reservoir has been generated in one year in the anoxic deep water.
The Mn and S depth profiles differ completely from those of other elements since they are 0 50 100 150 200 250 300 350 400 0 2 4 6 8 10 12 14 D e p th ( m ) P/Na Ishungu 2013 Gisenyi 2013 Gisenyi 2012 Gisenyi 2004-07 Kabuno 2013 Kabuno 2012 Kabuno 2004-07
Ishungu, Gisenyi and Kabuno respectively, due to the re-dissolution of the settling Mn-rich minerals. Below 180m, the concentration is stable around 5 µmol l-1. Three water layers with very low dissolved Mn content were detected during the high resolution profile sampled in 2013: at 90 m, 120 m and 190 m depth. These low values were also recorded in 2012 at 70-80 m and 170 m depth, but were not detected by the survey by Tassi et al in 2004-07. These 3 depths correspond to 2 among the 6 depths at which subaquatic springs enter the lake, on the basis of one-dimensional diffusive-advective model for salinity (Schmid et al., 2005): ~100 m and ~180 m. So, we suspect that these low Mn values trace these hydrothermal inflows in the lake in 2012 and 2013. This dilution by Mn-poor water may explain the drastic decrease in dissolved Mn from 2004 (~7 µmol l-1) to 2013 (~5 µmol l-1).
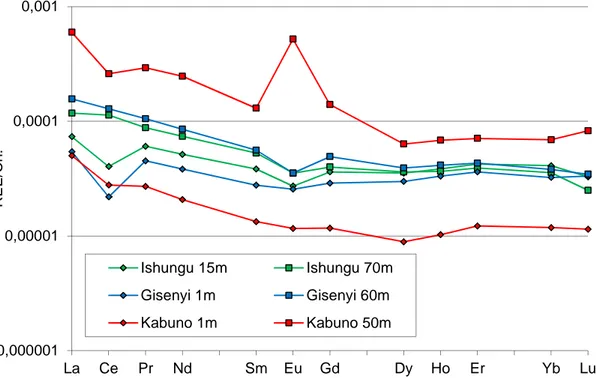
Rare Earth (REE)
At Ishungu and Gisenyi, REE are depleted in the epilimnion showing a significant negative Ce anomaly (Ce/Ce*<0.7) but relatively enriched in the upper chemocline with no or slight positive Ce anomalies (0.9<Ce/Ce*<1.1, Figures 10-11). The REE enrichment at the chemocline level is higher in Ishungu than in Gisenyi as shown by the Dy and Y concentration peaks at 50-60m. Below the chemocline, the REE contents decrease and the Ce anomaly is again present at roughly the same level than those observed in the surface water (0.7<Ce/Ce*<0.8, Figure 11). It has been long established that (1) among the REEs only Ce is reported to be present as a tetravalent species under ambient environmental conditions; (2) Mn oxides sorb Ce3+ and oxidize it as Ce4+ during the sorption process; (3) Ce is more tightly associated with Mn oxides than its neighboring REEs of La and Pr, resulting in the Ce positive anomaly in the REE patterns. So, the change in the intensity of the Ce anomaly and the coincidence of low and strong dissolved Mn and REE concentrations gradient between the mixolimnion and the upper chemocline reflects the Mn oxide precipitation in the surface water and their dissolution at the oxic-anoxic interface. Below the 255-261 m chemocline, the REE contents are very low under the detection limits. We could expect a fourfold decrease in the REE contents at the light of the Y changes which mimic the heavy REE behavior (especially Dy).