The World Bank Group
Social Protection and Labor Global Practice
Europe & Central Asia Region
PORTRAITS OF LABOR MARKET EXCLUSION 2.0
Country Policy Paper (CPP) for Croatia
Lead Authors: Mirey Ovadiya and Frieda Vandeninden
Project team: Aylin Isik-Dikmelik (Team Leader), Mirey Ovadiya (Team Leader),
Sandor Karacsony, Natalia Millán, and Frieda Vandeninden
July 2017
Public Disclosure Authorized
Public Disclosure Authorized
Public Disclosure Authorized
© 2017 International Bank for Reconstruction and Development / The World Bank 1818 H Street, NW
Washington, DC 20433 Telephone: 202-473-1000 Internet: www.worldbank.org
The findings, interpretations, and conclusions expressed here do not necessarily reflect the views of the Executive Directors of The World Bank or the governments they represent. The World Bank does not guarantee the accuracy of the data included in this work. The boundaries, colors, denominations, and other information shown on any map in this work do not imply any judgment on the part of
The World Bank concerning the legal status of any territory or the endorsement or acceptance of such boundaries.
The European Commission support for the production of this publication does
not constitute endorsement
of the contents which reflects the views only of the
authors, and the Commission cannot be held responsible for any use which may be made of the information contained therein.
Rights and Permissions
The material in this work is subject to copyright. Because the World Bank encourages dissemination of its knowledge, this work may be reproduced, in whole or in part, for noncommercial purposes as long as full attribution to this work is given. Any queries on rights and licenses, including subsidiary rights, should be
addressed to the Office of the Publisher, The World Bank, 1818 H Street NW, Washington, DC 20433, USA; fax: 202-522-2422; e-mail: pubrights@worldbank.org.
Photos: © World Bank
Acknowledgements
This report was produced by a World Bank team co-led by Aylin Isik-Dikmelik (Senior Economist) and Mirey Ovadiya (Senior Social Protection Specialist) including Sandor Karacsony (Social Protection Specialist), Natalia Millan (Economist), and Frieda Vandeninden (Economist).
This report is one of the twelve country specific papers produced under a joint European Commission (EC) World Bank and Organisation for Economic Cooperation and Development (OECD) project and applies a joint methodology on country specific cases as developed in OECD-World Bank (2016). This report would not have been possible without the financial and technical support of the EC’s Directorate General of Employment, Social Affairs and Inclusion. Katalin Szatmari (Policy Officer, Directorate C1-Social Investment Strategy), led the efforts from the Directorate General of Employment, Social Affairs and Social Inclusion. Herwig Immervoll (Senior Social Policy Economist, ELS/SPD) led the OECD team to undertake the activities under the project in six countries. The European Commission team included Suzanna Conze (Policy Officer, , formerly Directorate C1-Social Investment Strategy), Manuela Geleng (Head of Unit, Directorate C1-Social Investment Strategy), Ioana-Maria Gligor (Deputy Head of Unit, B5-Employment), Georgi Karaghiozov (Policy Officer, Directorate C1-Social Investment Strategy), Dora Krumova (Programme Manager, B5-Employment), Katharina Muhr (Policy Officer-Directorate C5-B5-Employment), Raya Raychinova (Program Assistant, B5-Employment), Alexandra Tamasan (Policy Officer, formerly Directorate C1-Social Investment Strategy), Georgios Taskoudis (Policy Officer, C4-Employment), Miriam Toplanska (Policy Analyst, Directorate C1-Social Investment Strategy), and Iva Zelic (Policy Officer, Directorate C5-Employment). The OECD team included James Browne, Nicola Düll, Rodrigo Fernandez, Daniele Pacifico, and Céline Thévenot. The team is grateful to the EC and OECD teams for the close collaboration exhibited under this project. Andrew D. Mason (Practice Manager, Europe and Central Asia Social Protection and Jobs Practice), Arup Banerji (Regional Director, European Union) and Cem Mete (Practice Manager, Europe and Central Asia Social Protection and Jobs Practice) provided overall guidance to the study. Peer review comments were received at various stages from Christian Bodewig (Program Leader), Aline Couduel (Lead Economist), Victoria Levin (Senior Economist), Matteo Morgandi (Senior Economist), Cristobal Ridao-Cano (Lead Economist), Victoria Strokova (Economist), Ramya Sundaram (Senior Economist); and Trang Van Nguyen (Senior Economist).
The team benefitted from extensive interaction and consultations with representatives of the Ministry of Labor and Public Employment Services. In particular, the team would like to thank Marko Pavic (State Secretary), Katerina Ivankovic Knezevic (former State Secretary), Darko Oracic, Petar Strizak, and Igor Vojnic), who provided guidance, data and specific inputs towards the finalization of the report. The team is also grateful to Predrag Bejakovic, Teo Matkovic, Danijel Nestic and Iva Tomic for their time and insights on labor markets and employment in Croatia.
Finally, the team is grateful to Eurostat for the provision of the EU-SILC micro data used in the analysis in this report.
Table of contents
Acknowledgements ...3
1. Introduction ...6
2. Country Context: Labor markets in Croatia ...7
3. Understanding employment barriers – a framework ... 14
3.1. Population of analysis: Individuals with potential labor market difficulties ... 14
3.2 Employment Barrier Indicators ... 18
4. Results of the analysis: portraits of labor market exclusion in Croatia ... 23
5. Analysis of priority groups for the Croatian labor market ... 29
6. Policies and programs targeting priority groups ... 34
6.1. Framework and approach ... 34
6.2. Overview of activation and employment support programs and policies ... 35
6.3. Capacity and adequacy of labor market interventions ... 42
6.4. Activation and employment support policies vis-à-vis priority groups needs ... 44
7. Conclusions and Policy Directions ... 47
References ... 49
Annex 1. Advantages and disadvantages of the EU-SILC Data ... 53
Annex 2 : Definitions of Employment Barrier Framework Indicators ... 55
Annex 3 Latent Class Analysis Results of EU SILC 2013 ... 58
Annex 4 : Application of Latent Class Analysis-- Model selection ... 61
Tables
Table 1. Characterization of target population according to barrier indicators (percent) ... 21Table 2. A cross-country comparison of barriers faced by the target populations ... 22
Table 3. Employment barriers faced by Population with Labor Market Difficulties in Croatia 2013 ... 24
Table 4. Employment barriers and socioeconomic characteristics for priority groups ... 31
Figures
Figure 1: Employment rate in Croatia between 2006 and 2015 (percent of working age population) ...8Figure 2: Unemployment rate in Croatia by gender...9
Figure 3: Activity rates by gender and age in Croatia and EU-28 ... 10
Figure 5: Long-term unemployment rate as a percentage of active population and by gender (percent of
active population) ... 12
Figure 6: Youth (15-24) unemployment rate in Croatia between 2006 and 2015 ... 12
Figure 7: Change in working age population in select European and Central Asian economies, 1970-2010 and 2010-2050 ... 13
Figure 8: Unemployment rate by education level (in percent of working age population) ... 14
Figure 9: The composition of working age population (left) and out-of-work (right)... 16
Figure 10: Labor market attachment status of working-age* population, Croatia and other EU countries under study (percent) ... 17
Figure 11: Composition of persistently out of-work population by labor market status, Croatia and other EU countries under study (percent of working age population) ... 18
Figure 12: Employment Barrier Framework ... 19
Figure 13: Latent groups within the Croatian target population ... 23
Figure 14. Distribution of number of barriers faced by individuals in each group ... 25
Figure 15: Linkages between Employment Barriers and AESPs ... 34
Figure 16: Labor market spending as percent of GDP (left axis) and share of ALMP spending as share of labor market expenditure (right axis) ... 39
Figure 17: Number of entrants per active labor market measure for 2007-2016 ... 41
Figure 18: Age, Educational Attainment, and Unemployment Duration of ALMP participants in 2016 ... 41
Figure 19: Group 3 Employment Constraints and Policy/Program response ... 45
Figure 20: Group 4 Employment Constraints and Policy/Program Response ... 46
Boxes
Box 1: Definition of target population ... 15Box 2. Definitions of employment barrier indicators used for Croatia ... 20
1. Introduction
Successful labor market inclusion requires a better understanding of who the labor market vulnerable are. People who are out of work are not all the same: they can be middle-aged individuals and early retirees, as well as young adults neither working nor receiving education. At the same time, there may be other types of vulnerability in the labor market: some people take part in temporary or unstable employment, work a reduced number of hours, or earn very low incomes despite being engaged in full time work. Considering the priorities of the inclusive growth pillar of the Europe 2020 Strategy1, and potential negative impacts of labor market vulnerability on long-term growth, it is worth examining who the labor market vulnerable in Europe are and why they are out of work or are precariously employed. While some statistics on broad groups (youth) exist, deeper analysis, in particular on the diverse barriers faced by the labor market vulnerable in conjunction with other characteristics, is needed and would constitute an important step forward towards better labor market inclusion.
In this context, Portraits of Labor Market Exclusion-2—a joint study between the European Commission (EC), the World Bank, and the Organization for Economic Cooperation and Development (OECD)2—aims to inform employment support, activation, and social inclusion policy making, through an improved understanding of labor-market barriers. Covering 12 countries3, the study builds on the previous joint EC and World Bank study to map the diversity of profiles of individuals who are out of work in six countries (Sundaram et al., 2014) and other analyses that characterize individuals with labor market difficulties (European Commission, 2012; Ferré et al., 2013; Immervoll, 2013). The study expands the previous analysis by looking at a broader group of labor market vulnerable beyond the out of work individuals to include: those in unstable employment, those with restricted hours, and those with near-zero incomes (i.e. individuals who are marginally employed). It also refines the analytical methodology by applying an employment barriers framework to facilitate policy making and country-specific application, and to provide a reference point for future methodological extensions.
Utilizing an advanced statistical method (latent class analysis), the study separates out of work and marginally employed individuals into distinct groups with respect to types of employment barriers faced.4 This approach facilitates discussions on the strengths and limitations of existing policy interventions for concrete groups of beneficiaries, and helps inform policy decisions on whether and how to channel additional efforts towards specific groups.
1Where all European governments have committed to increasing the employment rate (European Commission, 2010).
2 The activities of the “Understanding Employment Barriers” are financed through separate agreements between the EC
and the World Bank and the EC and the OECD respectively. The respective agreements with the EC are titled “Portraits of Labor Market Exclusion 2.0” (EC-World Bank) and “Cooperation with the OECD on Assessing Activating and Enabling Benefits and Services in the EU” (EC-OECD).
3 The existing analysis in Bulgaria, Estonia, Greece Hungary, Lithuania, and Romania is updated, broadened, and refined
with the new methodology; Croatia, Ireland, Italy, Poland, Portugal, and Spain are analyzed for the first time.
4 The latent class analysis uses EU-SILC rather than LFS data due to the opportunity to observe the labor market status
of each individual over the course of an entire calendar year as well as the richness of this data on socioeconomic characteristics. The delay in data availability indicates that certain changes in the structure of the labor market may have occurred since then. For a detailed discussion on the advantages and disadvantages of EU-SILC data, see Annex 1.The data used on the policy section is the most recent data available. With regards to data on LM policies and programs, we use the latest available data.
Addressing the same barrier may require a different set of policies according to the characteristics of the identified groups. For example, while not having recent work experience may be an employment barrier faced by many individuals, it may require a different approach for inactive mothers compared to young unemployed men. It is therefore important to relate each barrier to specificities of each group. Thus, the study further delves into the results of the latent class analysis (LCA) for the priority groups that are identified in close collaboration with the corresponding country counterparts. Consequently, the study presents a richer and deeper understanding of the barriers, beyond what could be glimpsed through traditional statistics. It also provides an assessment of the adequacy of the policies and programs that are available to respond to the needs of the priority groups.
The analysis focuses primarily on the supply-side constraints and corresponding policies. While the study recognizes the essential role demand plays in improving labor market outcomes, analysis of these constraints — which requires a comprehensive approach across multiple facets of the economy — is beyond the scope of this study.
The study provides a snapshot of the needs of the labor market vulnerable and relevant policies to inform strategic policy choices and directions. Operationalization of these policy directions (such as improvements in existing programs) requires a sequence of activities including further in-depth analysis using program-level administrative and expenditure data as well as the more commonly used profiling methods. Thus, the conclusions should be interpreted in this light.
This Country Policy Paper is one of twelve that is under study5, and analyzes the out of work and marginally employed population in Croatia along with existing activation and employment support policies and programs. The paper comprises consists of seven sections. Section 2 provides background on the Croatian labor market. Section 3 describes the framework and the statistical clustering methodology. Section 4 presents the results, including a description of the identified clusters according to labor market barriers and demographic and socio-economic characteristics. Section 5 expands on this information with a more detailed analysis of the groups that, together with the Government of Croatia, have been selected as priority groups for policy and program interventions. Section 6 analyzes the current policies and programs that address the needs of the prioritized groups. Finally, section 7 presents conclusions.
2. Country Context: Labor markets in Croatia
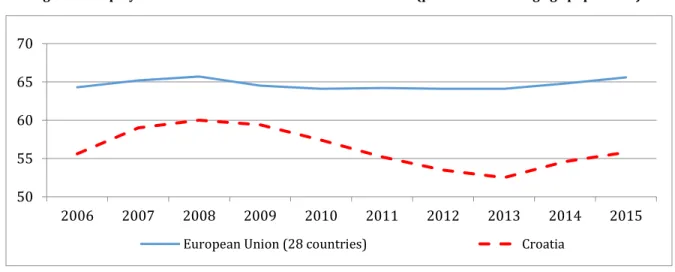
The labor market in Croatia experienced a prolonged downturn starting in 2010-11, but there are signs of recovery. After bottoming out at 52.5 percent in 20136, the employment rate has started recovering and stands at 55.8 percent. Despite partial recovery, employment still remains much lower than the EU average of 65.6 percent for the EU28 (Figure 1). The economic growth is expected to be robust and broad based in the short term with gross domestic product (GDP) growth forecast at 3.1 percent for 2017 and improvements projected in the labor market with stabilizing activity rates and further declines om unemployment rate (European Commission, 2017).
5 Six Country Policy Papers are led by the World Bank and include: Bulgaria, Croatia, Greece, Hungary, Poland, and Romania. The
Country Policy Papers led by OECD include: Estonia, Ireland, Italy, Lithuania, Portugal, and Spain.
6 Croatia has become a full member of the EU in July 2013. The structure of the labor force has likely changed due to
Figure 1: Employment rate in Croatia between 2006 and 2015 (percent of working age population)7
Source: Eurostat, LFS
Beyond high unemployment, several important labor market trends are concerning: long-term unemployment, youth unemployment, and relatively high inactivity, especially among women. The unemployment rate remains at a very high 16.3 percent, well above the EU28 average of 9.4 percent. Unemployment for youth and the low skilled, and the low activity rates weigh on economic potential. The gender gap is also worrying: starting in 2006 the number of unemployed women decreased constantly until reaching similar levels as men in 2012 before beginning to increase again in 2014. Overall 17 percent of active women are unemployed compared to 15.7 percent of men (Figure 2).
7The introduction section presents Eurostat Labor Force Survey (LFS) figures in which the working-age population
refers to individuals between 15 and 64 years of age. In the rest of the analysis, working age population is restricted to individuals aged 18 to 64 who are not in full time education or serving in the military.
50 55 60 65 70 2006 2007 2008 2009 2010 2011 2012 2013 2014 2015
Figure 2: Unemployment rate in Croatia by gender
Source: Eurostat, LFS
Only 66.8 percent of the working-age population is active, an improvement compared to the pre-crisis 65.6 percent but below the EU28 average of 70 percent. In addition, a relatively high 12 percent of the population aged 18 to 59 lives in households where no one works (Eurostat 2015). The activity rates of women and youth are particularly low (Figure 3). These high rates of inactivity effect youth and women who, even if relatively educated, lose skills while not working. Activity rates for both young men and women (15-24 years) and older men and women (50-64) are significantly lower than the EU average; for women, 10 and 12 percentage points respectively (Figure 3). In addition, a very low share of the employed work in part-time jobs (around 6 percent for both women and men compared to the EU average of 20 percent for men and women) (Figure 4). 15.9 17.2 0 2 4 6 8 10 12 14 16 18 20 2006 2007 2008 2009 2010 2011 2012 2013 2014 2015
Male Croatia Females Croatia
Figure 3: Activity rates by gender and age in Croatia and EU-28
Source: Eurostat
The gender gap with regards to activity is significant, especially for young and older women. The activity rate of young women is 10 percentage points lower than for young men, 28 versus 38 percent; while for older individuals, the difference is about 15 percentage points (Figure 3). Women also tend to retire earlier as the retirement age for women averaged 60.31 years from 2004 until 2015, reaching an all-time high of 61.25 in 2015; whereas retirement age for men averaged 65 years from 2004 until 20158. Retirement age for women is much lower than the EU average of 63. 5 years.
8 The official retirement age increased to 67 in April 2016 with a possibility to take early retirement at 64 years.
38.3 88.9 62.0 20 30 40 50 60 70 80 90 100 2006 2007 2008 2009 2010 2011 2012 2013 2014 2015 a. Males
HR age 15-24 years HR age 25-49 years HR age 50-64 years EU-28 age 15-24 years EU-28 age 25-49 years EU-28 age 50-64 years
28.2 83.5 47.5 20 30 40 50 60 70 80 90 100 2006 2007 2008 2009 2010 2011 2012 2013 2014 2015 b. Females
Figure 4: Part-time employment as a percentage of total employment by sex, EU Member States, 2015
Note: The EU-28 average is weighted.
Source: Eurostat
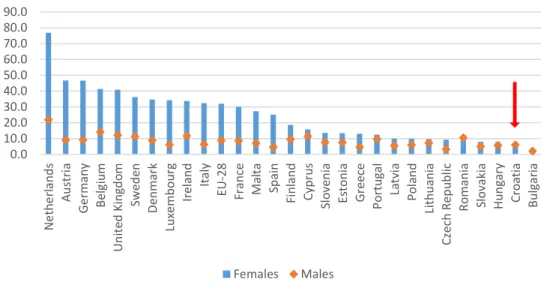
Long-term unemployment is relatively high, reaching 10.3 percent of the working age population in 2015, over twice as a high as the EU28 average of 4.5 percent, and the third highest among EU countries after Greece and Spain. Even though unemployment has fallen in recent years, long-term unemployment—unemployment lasting 12 or more months—has been “sticky”, even increasing between 2014 and 2015. Of the term unemployed, 42 percent have been jobless for over 24 months (very long-term unemployed). Long-long-term unemployment for women is 10.5 percent, slightly higher but similar to that of men at 10.1 percent (Figure 5).
0.0 10.0 20.0 30.0 40.0 50.0 60.0 70.0 80.0 90.0 N e th e rl an d s A u str ia G e rman y B el gi u m Un ite d Kin gd o m Sw ed en De n mark Lu xe mb o u rg Ire lan d Italy EU-28 Fran ce Mal ta Sp ain Fi n lan d Cyp ru s Sl o ve n ia Es to n ia G re ec e Po rt u gal La tv ia Po la n d Li th u an ia Cz ec h R ep u b lic Ro man ia Sl o vakia H u n gary Cro ati a Bu lg ar ia Females Males
Figure 5: Long-term unemployment rate as a percentage of active population and by gender (percent of active population)
Source: Eurostat, LFS
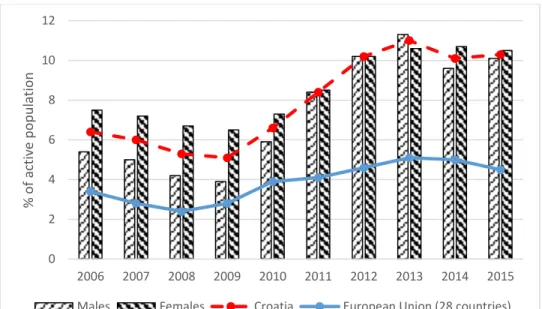
The unemployment rate for youth (15 – 24) is 43 percent, more than twice the EU average of 20.4 percent in 2015 (Figure 6). Young women are somewhat more affected by unemployment, with a rate of 44.5 percent versus 41.9 percent for young men. Similarly, the rate of young people neither in education nor training (NEET) of 18.5 percent is also well above the EU average of 12.0 percent (Eurostat, 2015). However, the gender divide is different. The NEET rate is particularly worrisome for males: in 2015 the NEET rate for males was 21.0 percent versus 15.8 percent for females. This is unusual for the EU where NEET rates tend to be higher for females, in part due to young child care responsibilities.
Figure 6: Youth (15-24) unemployment rate in Croatia between 2006 and 2015
0 2 4 6 8 10 12 2006 2007 2008 2009 2010 2011 2012 2013 2014 2015 % o f act iv e p o p u lat ion
Males Females Croatia European Union (28 countries)
0 10 20 30 40 50 60 2006 2007 2008 2009 2010 2011 2012 2013 2014 2015
Source: Eurostat
Demographic changes, including an aging population, is affecting the Croatian labor market. Low birth rates, longer life spans, emigration, and early retirement are shrinking the working age population. Croatia, similar to many EU countries, will continue to experience a shrinking base of young people entering the labor market; fertility rates decreased9 to an estimated 1.4 percent in 2016, below population replacement rates plus emigration10. Significant demographic shifts are projected to negatively affect the labor force, with the share of population over age 65 expected to almost double by 2050 (Schwarz et al., 2014) (Figure 7).
Figure 7: Change in working age population in select European and Central Asian economies, 1970-2010 and 2010-2050
Source: Schwarz et al, 2014
The crisis increased unemployment among those with less than secondary education; while reversing in 2014, unemployment rates are significantly higher for those with low education. The unemployment rate is highest at 22 percent among those with secondary education or lower, although improving since 2014. At 10 percent, unemployment is much lower for Croatians with tertiary education (university degree or equivalent non-degree) compared to lower education categories (Figure 8).
9 The average number of children that would be born per woman if all women lived to the end of their childbearing
years and bore children according to a given fertility rate at each age.
10 A rate of two children per woman is considered the replacement rate for a population, resulting in relative stability
Figure 8: Unemployment rate by education level (in percent of working age population)
Source: Eurostat, LES.
Despite positive economic signs, Croatia will need to improve employment support policies to address high unemployment and inactivity rates and the needs of its aging population. Overcoming these challenges requires addressing barriers that keep Croatians jobless. It also requires sharpening the focus of employment support and intermediation interventions.
3. Understanding employment barriers – a framework
Many young people are not working, along with old-age dependents and de-skilled inactive individuals, placing improvement of Croatia’s human capital must at the forefront of growth policies. While labor surveys statistics on broad groups such as “youth”, “older workers” and “retirees” exist, these groups are not homogenous and may face a variety of employment barriers. Detailed knowledge on the characteristics of these groups and obstacles they face are hard to find. Identification of groups with similar socioeconomic characteristics and employment constraints is fundamental for well-defined and comprehensive approach to policymaking with respect to the inactive and the unemployed.
This analysis categorizes individuals with no or weak labor market attachment which include the “out of work” and those who are employed sub-optimally. The analysis yields distinct subgroups of people in terms of characteristics and employment barriers they face. Developing narrower, more distinct categories provides a stronger evidence base to help design and prioritize activation and employment support policies. It also encourages critical examination of existing policies to assess their relevance to needs of target populations and their priorities.
This study offers policy makers a powerful statistical tool to help understand characteristics of out of work or marginally employed individuals. This tool also opens a channel to review and design of policies and programs suited to the distinct needs of these vulnerable individuals. Moreover, particularly for ministries and agencies in charge of labor and employment policy, this paper provides a sound framework to prioritize the needs of this population.
3.1. Population of analysis: Individuals with potential labor market difficulties
The “target population”, or focus of our analysis, is a subset of the Croatian working age population: those aged 18-64, excluding full-time students and those serving compulsory military service. The
0 5 10 15 20 25 30 2006200720082009201020112012201320142015 Unemployment, Croatia
ISCED 0 & 2 HR ISCED 3 & 4 HR ISCED 5 & 6 HR 0 5 10 15 20 25 30 2007 2008 2009 2010 2011 2012 2013 2014 2015 Unemployment, EU-28
ISCED 0 & 2 EU-28 ISCED 3 & 4 EU-28 ISCED 5 & 6 EU-28
population comprises individuals who self-reported being out of work during the entire survey reference period11(i.e., individuals with no employment attachment), as well as those who are marginally employed due to unstable jobs, restricted working hours, or very low earnings. Therefore, the analysis offers a much broader perspective than common profiling exercises that use administrative data collected only for registered jobseekers. It enlarges the scope of traditional profiling to individuals who have difficulties entering the labor market, those who are not working at an optimal level (in terms of stability, hours or job quality), and those not covered by any activation measures or registered as unemployed.
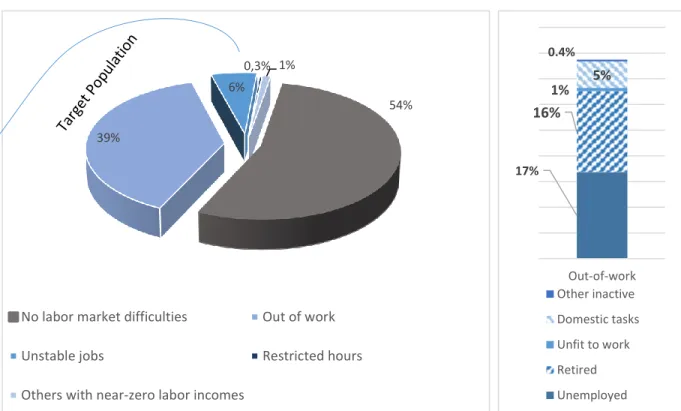
The target population represents 46 percent of the working-age Croatians12 (Figure 9) . This target population can be further disaggregated into: (i) those who are out of work (39 percent) for a variety of reasons including unemployment (17 percent), retirement (16 percent), unfit to work (1 percent), care or domestic duties (5 percent), or other types of inactivity (0.4 percent); (ii) those who have unstable jobs (6 percent); (iii) those with restricted working hours (less than 1 percent); and (iv) those who have near zero
11 The survey data used were EU-SILC 2013 data where the reference period is equal to the previous calendar year, i.e. 2012. For a
discussion on the advantages and disadvantages of EU-SILC data, see Annex 1.
12 Excludes individuals that are studying full time or doing compulsory military service. The working age population also includes individuals with no major labor market difficulties (54 percent in Croatia), who may be thought of as those having relatively good jobs (in full time employment or self-employment with no near-zero income) as well as those with a variety of constraints. This latter category, representing 46 percent of the reference population is the target group. Out of work refers to individuals who report being unemployed or inactive over the entire reference period as well as at the time of the survey interview. Labor market status refers to the main activity reported during the reference period.
Box 1: Definition of target population
The target population comprises people that are either persistently out of work (either who are actively searching for a job or inactive) or who are marginally employed. Specifically:
The persistently out of work are individuals reporting being unemployed or inactive—retired, disabled, engaged in domestic tasks, or other—during each of the 12 months of the reference period of the EU-SILC survey (the calendar year prior to the survey year), in addition to at the time of the survey interview. Individuals who are marginally employed can be categorized into three non-mutually exclusive groups:1
• Unstable jobs: individuals reporting work activity for a maximum five months during the reference period. To reconcile information reported for the income reference period and at the moment of the interview, the following individuals are also considered in this group: workers who report no employment or self-employment during the income reference period but who report being employed or self-employed at the moment of the interview, and workers with between 45 percent and 50 percent of work activity during the income reference period who do not report any work activity in either the last month of the income reference period or at the moment of the interview.
• Restricted working hours: identified as individuals who spent most or all of the reference period working 20 hours or less a week for the following reasons: illness or disability, family or care duties,
absence of other job opportunities. 1 We exclude individuals working 20 or fewer hours due to education
or training, or for whom the limited working hours is still considered a full-time job.
• Negative, zero, or near-zero labor incomes: identified as individuals reporting some work activity during the income reference period but negative, zero, or near-zero earnings. Specifically, to allow comparison across countries, we adopt the same low-earnings threshold for all countries at EUR 120/month in purchasing power parities with EU-28 as the reference. This translates to EUR 79 per month for Croatia, well below the statutory minimum wage of EUR 374 in 2012.1
earnings (1 percent).The other 54 percent of working age Croatians face no major labor market difficulties; that is, they are employed in relatively “good” jobs.
Figure 9: The composition of working age population (left) and out-of-work (right)
Source: World Bank staff calculations based on EU-SILC 2013.
Croatia fares worse compared to the other EU countries in terms of labor market attachment status of its working-age population (Figure 10). On average, the target population makes up 39 percent of the working-age population of the 12 countries in our study: in Croatia, the share of the target population is 46 percent. The out-of-work make up about 39 percent of the population, also well above the cross-country average of 31 percent, only surpassed only by Greece. The share of individuals in unstable jobs, having restricted working hours, or with near-zero earnings is broadly in line with the average among countries.
54% 39%
6%
0,3% 1%
No labor market difficulties Out of work
Unstable jobs Restricted hours
Others with near-zero labor incomes
17% 16% 1% 5% 0.4% Out-of-work Other inactive Domestic tasks Unfit to work Retired Unemployed
Figure 10: Labor market attachment status of working-age* population, Croatia and other EU countries under study (percent)
* Aged 18-64 and not studying full time or serving compulsory military service.
**Weighted average
Source: World Bank staff calculations based on EU-SILC 2013; EU-SILC 2014 for Greece; OECD Draft Country Policy Paper (forthcoming) for Portugal
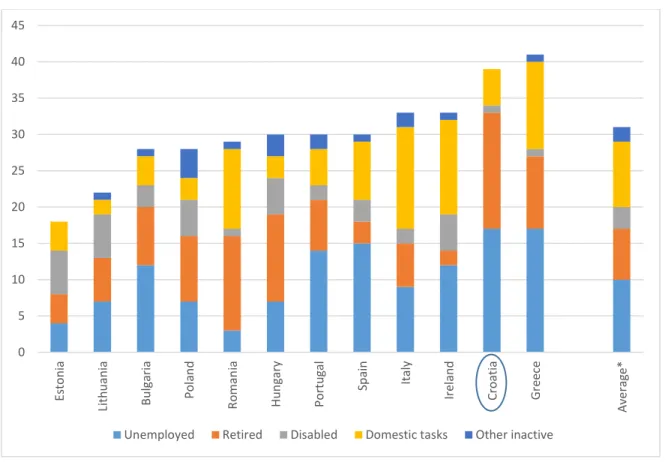
Disaggregating the population persistently out of work by labor market status reveals a high share of retirees and unemployed.13 Figure 11 shows that 17 percent of the Croatian population of working age is classified as unemployed, significantly worse than the 12-country average of 10 percent. Sixteen percent of the working-age population was retired, tied for highest with Greece, and closely followed by Spain, in contrast with the seven percent average for the 12 countries. The percentage of working-age individuals reporting to be engaged in domestic tasks, or disabled, in Croatia are average.
. 0% 10% 20% 30% 40% 50% 60% 70% 80% 90% 100% G re ec e Ire lan d Cro ati a Sp ain Ro man ia Italy Po la n d Po rt u gal H u n gary Bul gari a Li th u an ia Es to n ia A ve rag e* *
No labor market difficulties Persistently out of work Unstable jobs Restricted working hours Near-zero earnings
Figure 11: Composition of persistently out of-work population by labor market status, Croatia and other EU countries under study (percent of working age population)
*Weighted average.
Source: World Bank staff calculations based on EU-SILC 2013; EU-SILC 2014 for Greece; OECD Draft Country Policy Paper (forthcoming) for Portugal
3.2 Employment Barrier Indicators
To segment the target population into distinct groups according to labor market barriers and socioeconomic characteristics, a set of indicators were formulated to capture employment barriers that prevent individuals from partially or fully working. These indicators represent three types of employment barriers, as defined below and illustrated in Figure 12.
• Insufficient work-related capabilities include factors that may limit an individual’s ability to perform certain tasks. These include low education (as a proxy for skills); low work experience; care responsibilities; or limitations in daily activities due to health status.
• Weak economic incentives to search for, or accept, a “good” job: an individual may decide not to participate in the labor market if they might lose social benefits when taking up work or a higher-earning job (substitution effect), or if they already have a high standard of living due to other income sources and can therefore consume more leisure (income effect).
• Scarce employment opportunities: opportunities for employment may be scarce due to a shortage of vacancies in the relevant labor market segment (geographical area or sector); friction in the labor market due to things like information asymmetries, skills mismatches, discrimination, or lack of social capital. 0 5 10 15 20 25 30 35 40 45 Es to n ia Li th u an ia Bul gari a Po la n d R o m an ia H u n gary Po rt u gal Sp ain Italy Ire lan d Cro ati a G re ec e A ve rag e*
Figure 12: Employment Barrier Framework
Source: OECD- and World Bank (2016)
The three types of barriers described above cannot be directly observed using survey data. Thus, we constructed eight using EU-SILC 2013 data to proxy for the three types of employment barriers. Together, the eight indicators serve as a starting point to characterize the target population according to the barriers they face. These indicators represent broad aspects of the three main types of employment barriers, but cannot, of course, capture all barriers. The indicators represent only barriers we are able to capture or proxy using EU-SILC data. More importantly, employment barriers are complex and often result from the interaction of different individual and household characteristics, including gender, age, socioeconomic status, ethnicity, social and cultural norms, as well as frictions in the labor market that we are unable to capture with household data. 14 The indicators used for Croatia are outlined in Box 2 below. Additional information on the definitions and construction of each indicator is available in Annex 2 as well as in the joint methodological paper (OECD and World Bank, 2016)).
14 More detailed information on the definitions and construction of each indicator are available in the background
Box 2. Definitions of employment barrier indicators used for Croatia
The indicators represent three broad types of employment barriers and are constructed from EU-SILC 2013 data as follows:
Five indicators are used to proxy for capabilities barriers
1. Low education: if an individual has an education level equal to or lower than post-secondary non-tertiary
education the International Standard Classification of Education (ISCED)-11 classification)
2. Care responsibilities: if an individual lives with someone who requires care (i.e., children 12 and under receiving under 30 hours of care a week or elderly with health limitations) and is either the only potential care giver in the household or is reported as inactive or working part time because of care responsibilities; 3. Health limitations: if an individual reports some or severe self-perceived limitations in daily activities due
to health conditions;
4. No recent work experience:
o The indicator may represent two situations:
i. those who have worked in the past but have no recent work experience (have not worked for at least 1 month in the last semester of the reference year or at the month of the interview);
ii. those who have never worked;
Two indicators are used to proxy for incentives barriers:
5. High non-labor income: if household income (excluding those from the individual’s work-related activities) is more than 1.6 times higher than the median value in the reference population;
6. High replacement benefits: if earnings-replacement benefits (excluding categorical social benefits) are more than 60 percent of an individual’s estimated potential earnings in work;
One indicator is used to proxy for scarce employment opportunities:
7. Scarce employment opportunities*: if an individual is estimated to have a high probability of being unemployed or involuntarily working part time due to their age, gender, education, and region of residence.
*The scarce employment opportunities indicator does not take into account the fact that individuals who are not unemployed but are inactive may nonetheless face scarce opportunities if they were to search for a job.
Table 1 illustrates that the target population— 46 percent of the working age population—faces much higher employment barriers compared to the rest of the working age population.15 The most common barrier faced by the target population is lack of work experience, either having no recent work experience (65 percent having worked in the past and 20 percent having never worked) or low relative work experience (59 percent). Scarce job opportunities, or risk of remaining unemployed, due to individuals’ gender, age, education, and the region where they reside is also a substantial barrier (35 percent). About one third of the population have low education and another third also report health limitations. About 20 percent have disincentives to work due to high non-labor income, and a small three percent have benefits that may decrease if they switched to full-time work. The share that faces care responsibilities is relatively low (12 percent). In comparison, the proportion of the working-age population facing employment barriers is much lower, especially in terms of capabilities, i.e., education, health limitations, work experience and care responsibilities. The most striking difference is low relative work experience: individuals in the target
15 The care responsibilities barrier, by definition, does not affect any individuals who are not members of the target
population. The same is true of the barriers associated with recent work experience, as the population with stable jobs, by definition, has recent work experience since they have all worked for at least 1 month during the last semester of the reference year or at the month of the interview. All other barriers can equally affect individuals who have stable jobs and are therefore not considered part of the target population.
population are much more likely to have spent more than 60 percent of their potential work lives out of work.
Table 1. Characterization of target population according to barrier indicators (percent)
INDICATOR Target population Working-age population
Capabilities barriers
1 - Low education 30 19
2 - Care responsibilities 12 6
3 - Health limitations 33 21
4- Low relative work experience 59 37
5 - No recent WE - Has worked in the past 65 31
No recent WE - Has never worked 20 9
Incentives barriers
6 - High non-labor income 20 23
7 - High earnings replacement (benefits) 3 2
Opportunity barrier
8 - Scarce job opportunities 35 28
Source: World Bank staff calculations based on EU-SILC 2013
The target population in Croatia shows similar characteristics to the average across the six EU countries in the World Bank study. But some barriers stand out for Croatia, such as low relative work experience and high earnings replacement benefits. Table 2 compares employment barrier indicators for the target groups in the six EU countries. In Croatia, a comparatively very low proportion of individuals have “high-earnings replacement benefits” barriers, indicating relatively low benefits in comparison to shadow wages.16 “Low work experience” is particularly high for Croatia in comparison to Poland and Romania, though similar to Greece.17 Lastly, it is noteworthy that the target population in Croatia has the second highest share (65 percent) of those who” have past work experience but with no recent work experience” and highest share of those with “low relative work experience”.
16 Shadow wage rate is defined as opportunity cost of labor, and may differ from the observed wage because of
distortions in the labor market and in product markets as well
Table 2. A cross-country comparison of barriers faced by the target populations
Country Bulgaria Croatia Greece Hungary Poland Romania Average
Share of target group facing each barrier by country (percent)
Capabilities barriers
1 - Low education 38 30 81*** 31 19 45 33***
2 - Care responsibilities 13 12 16 15 15 13 14
3 - Health limitations 19 33 19 37 30 33 29
4- Low relative work experience (WE) N/A* 59 57 N/A* 43 48 52 5 - No recent WE - Has worked in the past 58** 65 59 73 66 45 62 No recent WE - Has never worked 19** 20 26 9 10 28 19
Incentives barriers
6 - High non-labor income 18 20 23 19 19 19 20
7 - High earnings-replacement benefits 6 3 12 14 9 10 9
Opportunity barrier
8 - Scarce employment opportunities 47 35 45 41 32 26 38
Source: World Bank staff calculations based on EU-SILC 2013 for all countries except for Greece, for which 2014 EU-SILC data is used.
* In Bulgaria and Hungary, a significant share of observations on work experience was missing from the EU-SILC 2013 dataset: as a result, the low relative work experience indicator could not be constructed for these countries.
** In Bulgaria, a significant share of observations was missing from the data on activities conducted in the reference year: as a result, the indicator was constructed differently than in the other countries.
*** In the case of Greece, the cut-off for low education has been set at post-secondary rather than lower secondary level. The reason for the change in the cut-off is that a look at unemployment (employment) rates by education level shows that unemployment (employment) only falls (rises) significantly among individuals who have completed tertiary education. Greece is not included in the average.
The statistical clustering method utilized in this study to analyze the target population is latent class analysis (LCA). This method is able to create proxies, in this case categories of employment barriers, from specific sets of variables, in this case all related to labor market vulnerability. LCA is a statistical segmentation technique that enables characterization of a categorical unobserved latent variable based on analysis of relationships among several observed variables (“indicators” as defined below). It segments the target population into distinct, homogenous sub-groups; in this case, groups made up of individuals who face similar barriers to employment. In contrast to traditional regression analysis, which identifies the effect of one barrier while assuming all other barriers stay constant, LCA exploits the interrelations of the employment barriers and how they interact to determine outcomes.18
18Further details on LCA and selection of indicators are provided in the OECD-World Bank Joint Methodological Paper,
4. Results of the analysis: portraits of labor market exclusion in Croatia
Applying the above methodology19, latent class analysis segments the target population into five distinct groups. Each group varies in size (see Figure 13), characteristics, and the mix and intensity of employment barriers they face.
Figure 13: Latent groups within the Croatian target population
Source: World Bank staff calculations based on EU-SILC 2013.
Below we describe each of the groups emerging from the analysis including employment barriers (Table 3) and the number of barriers for each group (Figure 13). We use characteristics that have a relatively high probability of occurrence for each group as the generic name20 for each group. Annex 3 outlines a detailed list of socioeconomic characteristics by group.
19 The technical details on the selection of the LCA models were omitted for brevity at this stage and will be included
in the Country Policy Paper. The team will be happy to provide these details upon request.
20 The group names are somewhat subjective; nevertheless they mirror most salient the barriers/characteristics
common within each groups.
Group 1: 35%
Group 2: 27% Group 3: 16%
Group 4: 13%
Group 5: 9%
Group 1: Unemployed middle-aged with education but no recent WE and low relative WE
Group 2: Early retirees
Group 3: Married relatively educated long-term unemployed women with care responsibilities
Group 4: NEETs: Young educated long-term unemployed men with low relative work experience
Group 5: Low-skilled inactive married women with care responsibilities or health issues
Table 3. Employment barriers faced by Population with Labor Market Difficulties in Croatia 2013
Group 1 Group 2 Group 3 Group 4 Group 5 Target population
Group size (% of target population) 35 27 16 13 9 100
Share of individuals facing each barrier, by class
Capabilities barriers
1 - Low education 32 28 20 2 82 30
2 - Care responsibilities 6 3 41 3 26 12
3 - Health limitations 41 46 8 5 47 33
4- Low relative work experience (WE) 61 23 73 87 92 59 5 - No recent WE - Has worked in the past 80 97 49 19 27 65 No recent WE - Has never worked 10 3 21 44 72 20
Incentives barriers
6 - High non-labor income 14 26 12 36 19 20
7 - High earnings-replacement benefits 2 6 2 0 6 3
Opportunity barrier
8 - Scarce employment opportunities 40 2 60 83 0 35
Average number of barriers per individual 2.9 2.2 2.9 2.8 3.6 2.9
Source: World Bank staff calculations based on EU-SILC 2013.
The groups also vary in terms of the average number of barriers faced as well as the prominence of simultaneous barriers. Figure 13 shows the distribution of the number of barriers faced by individuals in each group (left axis), as well as the average number of barriers faced (right axis). On average, all individuals in the target population face a total of 2.9 barriers21; 16.8 percent face four or more barriers (Figure 14). Across groups, group 5 stands out as having a particular high average number of barriers (above three). This also translates into a relatively high proportion of individuals facing four or more barriers in this group (58 percent). Groups 1, 3 and 4 have a relatively high percentage of individuals facing three barriers (between 30 to 43 percent). At the other end of the spectrum, Group 2 faces a relatively low number of barriers on average (around two).
Figure 14. Distribution of number of barriers faced by individuals in each group
Source: World Bank staff calculations based on EU-SILC 2013. Groups are ordered according to the average number of barriers.
26.8 3.60 2.90 2.90 2.80 2.20 2.9 0.00 0.50 1.00 1.50 2.00 2.50 3.00 3.50 4.00 0% 10% 20% 30% 40% 50% 60% 70% 80% 90% 100%
Group 5 Group 1 Group 3 Group 4 Group 2 Target
9% 35% 16% 13% 27% 100%
Group 1: Unemployed middle-aged with education but no recent WE and low relative WE (35 percent of the target population).
➢ 91 percent middle-aged (30-55); average age 47 years ➢ 58 percent unemployed and 28 percent retired
➢ 51 percent have been unemployed for 12 months or more ➢ 58 percent male
➢ 61 percent have upper secondary education or more ➢ 80 percent have worked in the past
➢ Most commonly faced barriers are no recent work experience (90 percent—80 percent worked in the past; 10 percent have never worked—and low relative work experience (61 percent)
➢ Average number of barriers: 2.9
Group 1, more than one-third of the target population, is made up largely of middle-aged individuals (91 percent) who are mainly unemployed (58 percent). It also includes a significant proportion of individuals who self-report as retirees (28 percent). The predominant barriers faced by this group are no recent work experience (90 percent—80 percent worked in the past—and low relative work experience (61 percent), followed by health limitations (41 percent) and scarce job opportunities (40 percent). The group is mainly men, but women represent a significant proportion (42 percent). Fifty-eight percent reported being unemployed during most of the reference period, and about half have been unemployed for 12 months or more. Forty percent report themselves as actively searching for a job at the time of the interview. Although one-third have low education, the rest are relatively educated having at least completed upper secondary education (68 percent). See Annex 3 for the full list of indicators. Half of these individuals reside in densely populated areas. This group is also relatively poor with 39 percent are at risk of poverty, versus 32 percent for the target population.
Group 2: Early retirees (27 percent of the target population).
➢ 94 percent aged 56-64; average age 59 years ➢ 80 percent retired
➢ 55 percent female
➢ 46 percent report health limitations ➢ 91 percent receives social benefits
➢ Most commonly faced barriers are no recent work experience (97 percent) and health limitations (46 percent).
➢ Average number of barriers: 2.2
27
Group 3: Married relatively educated long-term unemployed women with care responsibilities (17 percent of the target population).
➢ 61 percent middle aged (30-55) and 39 percent young (18-29); average age 34 years
➢ 70 percent unemployed; 55 percent unemployed for 12 months or more
➢ 79 percent female
➢ 89 percent live with children and 75 percent are married ➢ Most commonly faced barriers are no recent work experience
(49 percent have no recent work experience and 21 percent have never worked), low relative work experience (72 percent) andscarce job opportunities (60 percent)
➢ Average number of barriers: 2.9
Group 3 is younger than the average of the target population (34 vs. 46 years), with 30 percent 18 to 29 years of age and 61 percent between 30-55 years of age. It comprises mostly women (79 percent) who tend to be married (76 percent) and who live in households with children (89 percent), and consequently have care responsibilities (40 percent). Fifty-eight percent of them have children under six and more than half report having limited access to formal childcare. Seventy-one percent live in a household with at least one working person, although a very small percentage face a high non-labor income barrier. Seventy-eight percent also receive social benefits, although few face a high “earnings replacement barrier” indicating that benefits are relatively low. These women are largely unemployed (70 percent), and many are long-term unemployed (55 percent). Forty-four percent reported themselves to be actively looking for a job at the time of the interview. Almost one-fourth are marginally employed in unstable jobs. They have low relative work experience (73 percent) with only half of them with recent work experience, and they are relatively educated with 80 percent having completed upper secondary or tertiary education, versus 53 percent of the target population. The predominant barriers for this group are no recent work experience (70 percent, with 21 percent having never worked), low relative work experience (72 percent) and high risk of remaining unemployed (60 percent). A relatively high portion (39 percent) of this group is at risk of poverty versus 32 percent of the target population.
Group 2 comprises individuals between 56 and 64 years of age (94 percent) who are mostly retirees (80 percent). The majority of them are women (55 percent) and live primarily in urban areas (58 percent). About a fourth of them have high non-labor income, which is explained by the high proportion of them receiving social benefits (50 percent receive old-age benefits; 29 percent receive disability benefits) or living in a household with other income sources (47 percent have another working person in the household). However, few of them face a high “earnings replacement barrier”, which suggests that benefits are low relative to their shadow wage. A substantial portion of this group has health limitations (46 percent). They are relatively well educated with only 29 percent with low education and have few have low relative work experience (23 percent), especially compared to group 1. This group is also relatively better off than any other group, with the at-risk-of-poverty rate at only 21 percent versus 32 percent for the target population. The predominant barriers in this group are no recent work experience (100 percent; 97 percent have worked before) and health limitations (46 percent).
Group 4: NEETs: Young educated long-term unemployed men with low relative work experience (13 percent of the target population)
➢ 73 percent 18-29 years old; average age 30 years
➢ 90 percent unemployed, and 61 percent unemployed for 12 months or more
➢ 66 percent male
➢ 98 percent with high education level
➢ 61 percent live with parents and 36 percent have high non-labor income
➢ Most commonly faced barriers are low relative work experience (87 percent), scarce job opportunities (83 percent) and no recent work experience (63 percent: 19 percent have worked before, 44 percent have never worked).
➢ Average number of barriers: 2.8
The striking features of this group are the unemployment status (90 percent) and relative youth of its members, with 73 percent being 18 to 29 years of age. The group includes mostly men (68 percent) who are relatively well educated compared to the other groups; 81 percent have completed upper secondary education and 17 percent have completed tertiary education, meaning that only 2 percent face the low education barrier compared to 30 percent for the entire target population. Sixty-two percent report they were actively looking for a job at the time of the interview, and 61 percent of them have been unemployed for 12 months or more. Sixty-three percent have no recent work experience (19 percent have worked before; 44 percent have never worked). They, unsurprisingly, have low relative work experience (87 percent) and face scarce job opportunities (83 percent). About one third (36 percent) have non-labor income that may provide a disincentive to work. The other income sources are likely the result of living with at least one parent (80 percent). More than half (56 percent) live in urban areas. The most significant barriers for group 4 are low relative work experience (87 percent), scarce job opportunities thus high risk of remaining unemployed (83 percent), and no recent work experience (63 percent). Twenty-nine percent are at risk of poverty, versus 32 percent of the target population.
Group 5: Low-skilled inactive married women with care responsibilities or health issues living in rural areas (9 percent of the target population)
➢ 59 percent older (56-64); 41 percent middle-aged (30-55); average age 54 years
➢ 57 percent engaged in domestic tasks and 32 percent retired
➢ 100 percent female
➢ 82 percent with low education ➢ 47 percent with health limitations ➢ 26 percent with care responsibilities ➢ 72 percent have never worked
➢ 66 percent live in rural (thinly populated) areas
➢ Most commonly faced barriers are no recent work experience (99 percent: 27 have worked before and 72 percent have never worked), low relative work experience (92 percent) and low education (82 percent)
➢ Average number of barriers: 3.6
This group is composed of women only (100 percent) that are between 30 and 55 years of age (41 percent) or 56 to 64 (59 percent). Another specificity of this group is its activity status, as 57 percent reports being engaged in domestic tasks while 31 percent report themselves as retired. They have low education levels with 81 percent having only completed lower education or less. They also have low relative work experience (91 percent) as most of them have never worked (72 percent) and 27 percent also have no recent work experience. They are mostly married (70 percent), but only 20 percent have children under 12 and 28 percent live with an elderly person in the household. About 26 percent have care duties (including child care and elderly care) and 47 percent report health limitations. These women primarily live in rural areas (66 percent). The most significant barriers for this group are no recent work experience (91 percent; 72 percent never worked), low relative work experience (92 percent) and low education (82 percent). Thirty-five percent of this group is at risk of poverty compared to 32 percent of the target population.
5. Analysis of priority groups for the Croatian labor market
A number of active labor market policies and programs target youth and the long-term unemployed. Youth and long-term unemployed beneficiaries constitute 22 and 3.4 percent of the registered unemployed respectively22. Most of the programs, especially those introduced relatively recently, targeted youth with no
or little experience to ease their transition from school to work. Programs also target the long-term unemployed. Of particular importance is the Youth Guarantee Program that targets youth with no work experience and tries to intervene early to help them enter the job market (see Section 6 for more details). In addition, women (55 percent of the unemployed) and disabled (3 percent of the unemployed) are priority groups targeted for labor market programs.
22 CES Monthly Statistical Bulletin, June 2016
In light of Croatia’s labor market features and challenges, combined with commitment to EU employment strategies to reduce youth and long-term unemployment for socially excluded groups, the young, women, long-term unemployed, and people with little work experience are high priority groups for Croatia. Among these five groups identified using the LCA model, two groups23 stand out as top priorities for activation and employment support programs (AESPs): Group 3, Married relatively educated unemployed women with care responsibilities; and Group 4, Young relatively educated unemployed men with low relative work experience. Groups 1, 2 and 5 are not prioritized because of the demographic profiles of these groups: primarily older, with health barriers, pensions, and at retirement age, with limited ability to enter the labor market or remaining years of work. Table 4 below presents further analysis, with details on demographic and socioeconomic characteristics of both groups.
Groups 3, young NEETs with low relative work experience, and Group 4, long-term unemployed women with care responsibilities, share some challenges. But there are also very specific challenges to each group. For both of these groups, young unemployed and long-term unemployed women, the striking constraints are low relative work experience, including no recent work experience, and high risk of remaining unemployed. They have scarce job opportunities based on their geographic location, age profiles and socioeconomic characteristics. On the other hand, whereas many individuals in group 4 have never worked, half of group 3 has previous work experience. Despite low relative work experience, both groups are relatively educated with 70 and 81 percent of individuals in group 3 and 4 respectively having completed upper secondary education. Another similarity is that individuals in both groups live in households where there is at least one working adult, about 71 and 68 percent for group 3 and 4 respectively, although for group 4 this presents a barrier to work. Within both groups, long-term unemployment is significant, with 55 percent and 61 percent of the individuals respectively having been unemployed 12 months or more. For a significant 41 percent of group 3, care responsibilities represent a barrier; 58 percent live in households with children below 6 years of age and 54 percent live in households where either none or only some of the children under 12 receive formal childcare. Finally, about 30 to 40 percent of individuals in groups 3 and 4 are at risk of poverty. Therefore, even though scarce job opportunities exist for these individuals, this may not be the most important barrier keeping them out of work. Focus should be placed on addressing the other constraints: care responsibilities, lack of work experience, potential skills gaps (given the higher returns to higher education), being out of the labor market for long periods, and sources of household income that create disincentives for work.
Group 3 women are relatively educated with 70 percent having completed upper-secondary education and 10 percent having complete tertiary education. They belong primarily to the poorest two quintiles (69 percent); live with, or are married to, a working person in the household; and receive social benefits (78 percent) suggesting that these are working, but relatively poor households. Most group 3 people live in the Adriatic region, and especially in thinly populated areas. The women in this group average 34 years of age, thus have many years of productive life ahead of them to contribute to the social security system. In addition, a significant portion, 40 percent, of these long-term unemployed women are at risk of poverty compared to 32 percent of the target population; hence, they are likely to need supplementary, temporary social assistance along with employment support.
Eighty-one percent of Group 4 individuals have completed upper secondary school, with the rest having tertiary education. This group’s poverty levels are more equally distributed across income quintiles, although about 30 percent belong to the poorest quintile. The average age is 30 with a large
23 Priority groups have been selected in close consultation with the Ministry of Labor and Croatian Employment
majority (78 percent) not married, living with their parents (81 percent), and in a household with at least one working person (68 percent). A high share of these individuals never worked (44 percent), and among those who have worked, most of them have only 1-5 years of work experience (66 percent). A significant portion (44 percent) reside in the Adriatic region.
Table 4. Employment barriers and socioeconomic characteristics for priority groups24
Employment barriers
Group name
Group 3 Married relatively educated long term
unemployed women with care
responsibilities
Group 4 Young unemployed relatively educated
men with low relative work
experience Target pop.
Group size (% of target population) 16 13 100
Group size (number of individuals) 200,420 176,105
Capabilities barriers
1 - Low education 20 2 30
2 - Care responsibilities 41 3 12
3 - Health limitations 8 5 33
4- Low relative work experience (WE) 73 87 59
5 - No recent WE - Has worked in the past 49 19 65
No recent WE - Has never worked 21 44 20
Incentives barriers
6 - High non-labor income 12 36 20
7 - High earnings-replacement benefits 2 0 3
Opportunity barrier
8 - Scarce employment opportunities 60 83 35
Average number of barriers 2.9 2.8 2.9
Socioeconomic characteristics Group 3 Married relatively educated long term unemployed women with care responsibilities:
Group 4 Young long term
unemployed relatively educated
men with low relative work
experience Target pop.
Percent of target population 18 12 100
Thousands of individuals 200,420 176,105 1,144,364
Women* 79 34 56
Children under 12 in household* 89 7 27
Age group*
Youth (18-29) 39 73 17
Middle-aged (30-55) 61 25 50
Older (56-64) 0 2 33
Main activity during the reference period
Employed 9 4 3
Unemployed 70 90 48
Retired 4 1 35
Domestic tasks 15 1 12
Other inactive or disabled 3 3 3
Degree of urbanization
Densely and intermediate populated 45 56 51
Thinly populated 56 44 49
Region
Sjeverozapadna Hrvatska (Northwestern) 16 22 21
Sredisnja i Istocna (Panonska) Hrvatska(Central and Eastern (Pannonian) 30 34 29
Jadranska Hrvatska (Adriatic) 55 44 49
Target group**
Out of work 68 63 85
Unstable jobs 23 34 12
Restricted hours 1 1 1
Near-zero income 8 2 2
Main activity at moment of interview
Employed 20 22 9
Unemployed 61 72 43
Retired 5 2 35
Domestic tasks 13 1 11
Other inactive, disabled or student 2 3 3
Months in unemployment
Zero months 27 8 51
1 to 11 months 18 31 11
12 or more 55 61 38
Actively searching for a job at time of interview 44 62 30
At risk of poverty (60% of median income) 39 29 32
At risk of poverty (40% of median income) 18 16 16
Equivalized income quintile
Poorest 40 30 33
2 29 19 23
3 19 19 20
4 8 20 14
Richest 4 12 10
Severe material deprivation 22 22 22
Years of work experience***
1 to 5 45 66 23
6 to 10 25 13 12
11 to 20 21 14 21
21 to 30 7 5 23
More than 30 1 2 22
Average years of work experience*** 9 7 18
Education level Primary or less 4 0 9 Lower secondary 16 2 36 Upper secondary 70 81 47 Post-secondary 0 0 3 Tertiary 10 17 6
Age groups (more disaggregated)
18-24 years 17 41 9 25-34 years 40 34 15 35-44 years 30 12 17 45-54 years 12 10 22 55-59 years 1 2 17 60-64 years 0 1 19 Average age 34 30 46